Irrigation and water management
ESTIMATION OF RETENTION PARAMETERS USING PRESSURE PLATE EXTRACTOR DATA
Author’s name Dr P. N. Chandramouli Professor, Department of Civil Engineering, NIE, MYSORE-
[email protected] Sumaraj, Madhushree A.R, Chandan M.C, Manoj K.G B.E Students, Department of Civil Engineering, NIE, MYSORE
[email protected],
[email protected],
[email protected],
[email protected]
Abstract The importance of the unsaturated zone as an integral part of the hydrological cycle has long been recognized. The vadose zone plays an inextricable role in many aspects of hydrology, including infiltration, soil moisture storage, evaporation, plant water uptake, groundwater recharge, runoff and erosion. Interest in the unsaturated (vadose) zone has dramatically increased in recent years because of growing concern that the quality of the subsurface environment is being adversely affected by agricultural, industrial and municipal activities. Fertilizers and Pesticides applied to agricultural lands inevitably move below the soil root zone and may contaminate underlying groundwater reservoirs. Chemicals migrating from municipal and industrial disposal sites also represent environmental hazards. The moisture movement in unsaturated zone is usually analyzed by solving Richards’ equation. Soil hydraulic properties such as retention and conductivity functions are needed for solution of Richards’ equation. Unsaturated soil parameters i.e. water retention function and hydraulic conductivity are highly nonlinear functions of pressure head. The water retention function is usually determined from laboratory or in situ measurements of water content and pressure head. Hydraulic conductivity can be determined directly from steady state flow experiments. In this present study, estimation of retention parameters ∝ 𝑎𝑛𝑑 𝑛 from pressure plate extractor data is given. Key words: water retention function, hydraulic conductivity
1 Introduction
The water retention characteristic (𝜃 − 𝜓 relationship) of the soil describes the soil’s ability to store and release water. The 𝜃 − 𝜓 relationship is called soil moisture retention curve or soil moisture characteristic [SMC]. The shape of the SMC depends upon the pore size distribution of the soil. Many empirical functional forms exist in the literature for the SMC, the most popular being Brooks and Corey (1964), Campbell (1974) and Van Genuchten 1
Irrigation and water management
(1980) relationships. The parameters involved in these empirical relationships can be obtained from the pressure head moisture content data or by the mechanical properties such as particle size distribution, organic content, bulk density etc. Gupta and Larsen (1979) presented regression models for determining characteristics of soil from particle size distribution, percent organic matter and bulk density. Ghosh (1980) proposed methods for estimating soil moisture characteristics from mechanical properties. Saltar and Williams (1965) discussed the influence of texture on the 𝜃 − 𝜓 characteristics.The SMC should be such that the continuity should be present in the slope of the soil moisture retention curve and it should be amenable to yield closed form equations for the hydraulic conductivity. The relationship proposed by Van Genuchten (1980) permits a representation of the total soil moisture characteristic (SMC). Campbell (1974) and Brooks and Corey (1964) relationships describe only the portion of the SMC for pressure heads less than the bubbling pressure or pressure at which air will enter the soil. In the present study, the relationship proposed by Van Genuchten (1980) is used for SMC.
Van Genuchten Relationship: Θ=
1 1+ 𝛼𝜓 𝑛
𝑚
𝑓𝑜𝑟 𝜓 ≤ 0
(1)
Θ=1 𝑓𝑜𝑟 𝜓 > 0 (2) -here,𝛼, and 𝑛 are unsaturated soil parameters with 𝑚=1-(1/𝑛) and 𝑛 > 1. and Θ is the effective saturation defined as, 𝜃 − 𝜃𝑟 Θ= (3) 𝜃𝑠 − 𝜃𝑟 where, θs is the saturated moisture content and θr is residual moisture content of the soil. Rawls et al., (1992) provided the following regression equations to estimate Brooks and Corey parameters from a wide soil texture data base. Brooks-Corey bubbling pressure, (cm) ℎ𝑏 = exp 5.3396738 + 0.1845038 𝑐 − 2.48394546 ∅ − 0.00213853 𝑐 2 − 0.04356349 𝑠 ∅ − 0.61745089 𝑐 ∅ + 0.00143598 𝑠 2 ∅2 − 0.00855375 𝑐 2 ∅2 − 0.00001282 𝑠 2 𝑐 + 0.00895359 𝑐 2 ∅ − 0.00072472 𝑠 2 ∅ + 0.0000054 𝑐 2 𝑠 + 0.50028060 ∅2 𝑠 + 0.50028060 ∅2 𝑐 (4) Brooks-Corey Pore-size distribution index 𝜆 = exp −0.7842831 + 0.0177544 𝑠 − 1.062498 𝜙 − 0.00005304 𝑠 2 − 0.00273493 𝑐 2 + 1.11134946 𝜙 2 − 0.03088295 𝑠 𝜙 + 0.00026587 𝑠 2 𝜙 2 − 0.00610522 𝑐 2 𝜙 2 − 0.00000235 𝑠 2 𝑐 + 0.00798746 𝑐 2 𝜙 − 0.00674491 𝜙 2 𝑐 (5) Brooks-Corey Residual water content (volume fraction) 𝜃𝑟 = −0.0182482 + 0.00087269 𝑠 + 0.00513488 𝑐 + 0.02939286 𝜙 − 0.00015395 𝑐 2 − 0.0010827 𝑠 𝜙 − 0.00018233 𝑐 2 𝜙 2 + 0.00030703 𝑐 2 𝜙 − 0.0023584 𝜙 2 𝑐 (6) Brooks and Corey effective Saturation Θ = 0.01162 − 0.001473 𝑠 − 0.002236 𝑐 + 0.98402 𝜙 + 0.0000987 𝑐2 + 0.03616 𝑠 𝜙 − 0.010859 𝑐 𝜙 − 0.00096 𝑐2 𝜙 − 0.0024372 𝜙 𝑠 + 0.0115395 𝜙2 𝑐 (7) Here, 𝑐- %clay (5< %< 60); 𝑠 = % sand (5 < % < 70); 𝜙 = porosity (volume fraction). Lakshman Nandagiri and Ramprasad (1996) proposed an algorithm to convert Brooks and Corey Parameters to Van Genuchten Parameters. The conversion obviates the use of nonlinear least square regression needed for directly obtaining Van Genuchten Parameters. The proposed algorithm is as follows.
2
Irrigation and water management
Van Genuchten (1980) suggested that the best location of SMC for evaluating its slope 𝑆 𝑙 is halfway between 𝜃𝑠 and 𝜃𝑟 . At the halfway point P, we have, 𝜃𝑠 + 𝜃𝑟 𝜃𝑃 = (8) 2 −1/𝜆 𝜓𝑃 = 𝜓𝑏 0.5 (9) Θ = 0.5 (10) The slope of Brooks-Corey SMC curve at P is, 𝑆𝑃𝑙 = 1.151𝜆 (11) Van Genuchten (1980) proposed the following equations for estimating 𝑛 and 𝛼 as: 1 = 1 − 𝑒𝑥𝑝 −0.85𝑆𝑃 0 ≤ 𝑠𝑝 ≤ 1 𝑛 0.5755 0.1 0.025 𝑚=1− + 2 + 𝑆𝑃 > 1 𝑆𝑃 𝑆𝑃 𝑆𝑃3 Knowing 𝑚, 𝑛 is computed as, 1 𝑛= 1−𝑚 The Parameter 𝛼 is obtained by applying eqn. (1) at P as, 1 1/𝑚 1/𝑛 𝛼= 2 −1 𝜓𝑃 𝑚= 1−
(12) (13)
(14) (15)
2 Experiment details The soil factors needed for parameter estimation are textural properties, bulk density, particle density etc.
2.1 Texture Soil samples were obtained from 0-0.3m, 0.3-0.6m, 0.6-0.8m, and 0.8-1.0m depth, at the experimental site. These samples were subjected to a detailed grain size analysis using a set of standard sieves and a calibrated hydrometer, following the methodology suggested by Trout et al., (1982). Table 1 shows the depth wise distribution of mean textural fractions for the soil from which, it is evident that the soil profile up to 1.0m is fairly uniform in texture. Hence, a uniform soil textural classification is considered for 0-1.0m depth. For the depth 0-1.0m, mean values of sand, silt and clay are 57.085%, 25.25%, and 17.575%, yielded the U.S.D.A. soil textural class of sandy loam for the site. Table 1: Depth wise Textural properties Textural separates (%) Sand
Silt
Clay
Bulk density (g/cc)
0-0.3
58
28
18
1.59
0.3-0.6
57.34
26
17.5
1.6
0.6-0.8
57
23.5
17.5
1.64
Depth (m)
3
Irrigation and water management
0.8-1.0 0-1.0
56
23.5
17.3
1.67
57.085
25.25
17.575
1.625
±2.0
±2.25
±0.35
±0.04
2.2 Bulk density and particle density Undisturbed soil samples were obtained using core samplers, from the same depths at which the textural fractions were determined. Bulk density, which is defined as the mass of solids per unit volume of dry soil, has been determined for the sample by the procedure suggested by Trout et al.,(1982). Values obtained for each layers up to 1.0m depth are shown in Table 1. The indicated increase in the values with depth is typical of field soils and may be attributed to increasing overburden. Deviation of values for different layers is insignificant, so a uniform value of 1.625 g/cc is considered. The Pycnometer method (Trout et al., 1982) has been used to determine this quantity from four soil samples. An average value of 2.5 g/cc is considered. Using the measured values of soil particle and bulk densities, soil porosity has been computed using the relation: 𝑃𝑜𝑟𝑜𝑠𝑖𝑡𝑦 = 1 −
𝐵𝑢𝑙𝑘 𝑑𝑒𝑛𝑠𝑖𝑡𝑦
(16)
𝑃𝑎𝑟𝑡𝑖𝑐𝑙𝑒 𝑑𝑒𝑛𝑠𝑖𝑡𝑦
The value of porosity comes out to be 0.348 cm3/ cm3.
2.4 Pressure plate extractor test Pressure plate Extractor is one of the most commonly used equipment for the determination of SMC in the laboratory. Laboratory experiments are conducted to determine the SMC of the soils using 1500 -15 Bar Pressure Plate Extractor (Soil Moisture Equipment Corp. California). To regulated pressure, pressure gauge 0780P0300 with 6-inch diameter with an accuracy of 1% is used, for 15 Bar Extractor. Plates 1 shows the pressure plate extractor and the pressure gauge set up used in the study. Air dried, 2mm sieve passed, soil sample obtained from the 0.3-0.4m depth interval in the field, was used to obtain desorption data using this pressure plate apparatus. Six replicate subsamples of about 20g each were prepared for each pressure application and placed on the appropriate ceramic plate using rubber retainer rings (5.5cm diameter, 1cm height) provided for this purpose. The samples were allowed to saturate on the ceramic plate for about 24 hours, following which excess free water was removed with a syringe. The plate was then loaded into the extractor and the appropriate constant pressure applied from an external source. At equilibrium, when no further outflow of water was noticed, the pressure was released, soil samples immediately transferred into air tight container, and weighed. Again after oven drying, at 105 0 C for 24 hours, the same soil samples are weighed, which facilitate calculation of equilibrium moisture content on a dry weight basis, which are later converted to volume fractions.
3 Estimation Of Retention (𝜶 𝐀𝐍𝐃 𝒏) Parameters From Laboratory Pressure Plate Extractor Data
4
Irrigation and water management
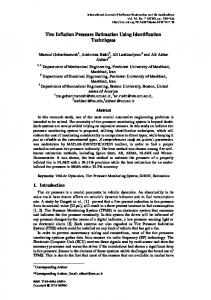
The pressure plate extractor data of the laboratory sample of soil is presented in Tables 2. Van Genuchten 𝜃 − 𝜓 model parameters 𝛼 and 𝑛 are obtained by nonlinear regression. Fig. 1 shows the Van Genuchten model fits using optimal parameters given in Table 2. Table 3 shows the comparison between optimal values of the parameters 𝛼 and 𝑛 and the estimates from textural properties.
Plate 1: Pressure Plate Extractor Table 2: Pressure Plate Extractor Data Suction pressure (bars)
Volumetric Moisture content
Suction pressure (bars)
Volumetric moisture content
0.1
0.33
1.0
0.245
0.2
0.32
1.5
0.23
0.3
0.315
2.0
0.21
0.4
0.31
2.5
0.21
0.5
0.29
3.0
0.2
0.6
0.285
3.5
0.19
0.7
0.28
4.0
0.18
0.8
0.27
4.5
0.17
0.9
0.265
Table 3: Parameters estimates of 𝜶 and 𝒏 from direct methods Parameters
Estimates from Pressure plate extractor
Estimates from textural properties
𝛼 (1/𝑐𝑚)
0.0185
0.0195
𝑛
1.3
1.27
5
Irrigation and water management
4 Conclusion
Suction pressure (cm)
The comparison in Table 3 indicates that the parameters obtained from pressure plate extractor data and from textural properties are comparable. Even though, estimation of retention parameters ∝ 𝑎𝑛𝑑 𝑛 from pressure plate extractor data is more reliable compared to estimate from textural properties, but at the same time, pressure plate extractor is costly and is time consuming. In addition, since, the parameters are obtained from small core samples; the estimates may not represent true values at field scale.
1000 100 Experimental 10 Van Genuchten Model
1 0
0.2
0.4
Moisture content (θ)
Fig. 1: Van Genuchten 𝜽 − 𝝍 Model fit with Pressure Plate Extractor Data
References 1. 2. 3. 4. 5. 6. 7.
8. 9.
Brooks, R.H., and Corey, A.T. (1964). “Properties of porous media affecting fluid flow”, J. Irrigation. Drainage Division. American Society Civ. Eng., 92, 61-88. Campbell G.S. (1974). “A simple method for determining Unsaturated conductivity from moisture retention data”, J. Soil Sci. 117, 311-314. Ghosh, R.K. (1980). “Estimation of soil-moisture characteristics from mechanical properties of soils”. J. Soil Sci., 130, 60-63. Gupta, S.C, and Larsen, W.E. (1979).”Estimating soil water retention characteristics from particle size distribution, organic matter percent and bulk density”. J. Water Resource Research, 15(6), 1633-1635. Laxman Nandagiri, and Rama Prasad, (1996). “Relative performance of textural models in estimating Soil Moisture Characteristic”. J. Irrigation and Drainage, 131 (3), 238-248. Rawls.W.J. Ahuja. L.R., Brakensiek,.D.L., and Adel. Shirmohammadi. (1992). “Infiltration and soil water movement”. Handbook of Hydrology, McGraw Hill Inc., New York, Chapter 5, 5.1-5.51. Salter, P.J, and Williams, J.B., (1965). “The influence of texture on the moisture characteristics of soil, I.A, critical comparison of techniques for determining the available-water capacity and moisture characteristic curve of a soil”. J. Soil Sci. 16,1-15. Trout, T.J., Garcia- Castillas, I.G., and Hart, W.E. (1982). “Soil- Water Engineering: Field and Laboratory manual”. Academic Publishers, Jaipur, India. Van Genuchten M Th. (1980). “A closed form equation for Predicting the hydraulic conductivity of unsaturated soil”, J. Soil. Sci. Soc. Am, 44, 892-898. 6