ABSTRACT. Detection and estimation of overpressure using well data have been attempted. Suites of logs from three wells in the overpressured oil fields of the ...
Umorem et al.
72
INTERNATIONAL JOURNAL OF NATURAL AND APPLIED SCIENCES (IJNAS), VOL. 6, NOS.1& 2 (2011); P. 72 – 76, 1 TABLE, 12 FIGS.
Detection and estimation of overpressure using borehole data from oil fields in the Niger Delta N. E. Umorem 1, J. O Ebeniro1,., and C. N. Ehirim2. ABSTRACT Detection and estimation of overpressure using well data have been attempted. Suites of logs from three wells in the overpressured oil fields of the Niger Delta were used. Using the formation pressure information, the hydrostatic pressures of the three wells were derived. Working intervals were carefully selected from the same lithology (shale) within the depth of interest (6,000ft – 15,000ft) using gamma ray log. Overpressured formations display numerous properties when compared with a normally pressured zone at the same depth. The crossplots revealed the behavior of these properties with increasing depth. Comparison of these rock properties at different depth points showed changes in their trend behavior. Overpressure zones were significant with increasing depth (9,000ft).
INTRODUCTION
METHODOLOGY
During drilling of wells for hydrocarbon exploration or
This work used the regular formation evaluation tools
production, abnormal pressures are bumped into worldwide.
(sonic, resistivity and density logs) to derive rock properties
For safe drilling planning, there is need for pore pressure
to comprehend the relationship between rock and fluid
estimation
hazardous
properties, estimate pore pressure from the relationship
(overpressure) zones within the reservoir during drilling
between these properties and identify overpressured zones
operations, reducing time and cost. Abnormal pressure
by crossplotting certain parameters. Gamma ray, sonic
could be underpressure or overpressure. Underpressure is
velocity, density and resistivity plots were made for the
pore fluid pressure less than normal pore pressure (Mukerji
whole depth range.
because
this
can
predict
et al., 2002; Presgraf, 2007; Ruth et al., 2004). A rock is
The lithology was determined using gamma ray log
said to be overpressured when its pore pressure is
hence the lithology of interest (shale) was selected. Three
significantly greater than hydrostatic pressure.
working intervals (A, B and C) were chosen from the shale
Overpressures in sedimentary basins have been attributed
zones for each of the three wells (1, 2, and 3). The
to different mechanisms but can be categorized into four
formation pressure data were given for each well and this
main causes: compaction disequilibrium, fluid expansion,
was used to identify overpressure zones by determining the
lateral transfer and tectonic loading (Bowers, 2002).
hydrostatic pressure for each well using the equation:
Compaction disequilibrium, which is also known as
Hydrostatic pressure = Pw * TVD + Pa
undercompaction, is the major cause of overpressure in the
where
(1)
Pw = 0.433 = hydrostatic pressure for pure water
Niger Delta area. This occurs most commonly when low
TVD = true vertical depth at each point (ft)
permeability formation prevents pore fluid from escaping as
Pa=14.7 = Atmospheric pressure
rapidly as pore space tries to compact. During deposition of
Hydrostatic and formation pressures together versus depth
sediments, excess pressure builds up and the weight
were crossplotted.
squeezes
compaction
Eaton equation was also used to estimate pore pressure
disequilibrium or undercompaction (Bois, 1994, Bradley
according to the relation:PP = obg – (obg-nhg)*(valo/valn)EE
and Powley, 1995).
where
the
trapped
fluid
causing
valo = observed log value
Since sonic, density and resistivity logs are sensitive to
valn = normal log value
porosity, they provide a means of estimating overpressure.
obg = overburden gradient (psi/ft)
*Corresponding author. Email: 1 Department of Physics, Geophysics Research Group, University of Port Harcourt, Port Harcourt, Nigeria. © 2011 International Journal of Natural and Applied Sciences (IJNAS). All rights reserved.
Detection and estimation of overpressure using borehole data Umorem et al.
73
nhg = normal hydrostatic gradient (psi/ft)
Analysing the behavior of the rock properties from the log
EE = Eaton Exponent
plots, it was observed that:
PP = pore pressure
Velocity increased with depth for a normal
(Petrospec Technologies Tools, 2007). Eaton equation for
pressure zone. In overpressured zones, the
pore pressure can be applied in different well logs (Eaton,
velocity invariably decreased (Fig. 4, 5 and 6).
1975).
Bulk density measurements (
b)
versus depth
indicated a normal increasing trend until a top of RESULTS
an
overpressure
zone
was
reached.
In
Crossplotting hydrostatic and formation pressure together
overpressure environments, the bulk density
versus depth revealed the true state of the formation
values were lower than the normal trend values
pressure of the wells (Fig.1, 2 and 3). With this, one could
due to increased pore volume in these zones (Fig.
understand where there is normal pressure and abnormal
7, 8 and 9).
pressure (underpressure or overpressure).
Fig.1. Well 1
Fig.2. Well 2
Fig. 4. Velocity versus Depth Well 1- A, B and C
Fig. 5. Velocity versus Depth Well 2- A, B and C
Fig.3. Well 3
Umorem et al.
Fig. 6. Velocity versus Depth Well 3- A, B and C
Fig. 7. Density versus Depth Well 1- A, B and C
Fig. 8. Density versus Depth Well 1- A, B and C
Fig. 9. Density versus Depth Well 1- A, B and C
In normal pressure zones, resistivity increases with depth,
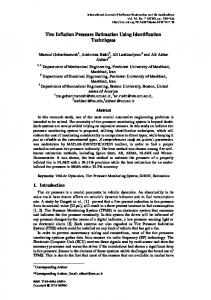
The estimation of pore pressure (a means of detecting
since porosity decreases due to compaction. In the
geopressure) using Eaton equation as demonstrated using
overpressure zones, the resistivity of shale departed from
sonic velocity log (Fig. 12) showed the calculation made for
the normal trend, that is, it decreased (Fig. 10, 11 and 12).
just two depth points: 10000ft and 12500ft. The overburden
74
Detection and estimation of overpressure using borehole data Umorem et al.
75
pressure gradient used was the summarized overburden
At 10000ft:
pressure of the Niger Delta.
Eaton predicted pore pressure = 4858.92(psi)
Eaton Method using sonic velocity
Hydrostatic pressure = 4344.7(psi)
At 12,500ft:
PP = obg – (obg-nhg)*(Vo/Vn)
EE
Hydrostatic pressure = 5427.2 (psi)
Eaton predicted pore pressure = 6112.43 (psi) Comparing the hydrostatic pressure value to Eaton
At 10000ft:
predicted pore pressure based on the calculation made
PP = 9680 – (9680-4344.7)*(8795.075/9097.24) ^3
above, the predicted pore pressure is higher than the
= 9680 – (5335.3)*(0.90362) = 9680 – 4821.1
hydrostatic
PP = 4858.92(psi)
overpressured zone detected.
pressure
at
both
depth
points
At 12500ft: PP = 12300 – (12300-5427.2)*(11321.13/11724.5) ^3 = 12300 – (6872.8)*(0.900298) = 12300 – 6187.569 PP = 6112.43 (psi) At 10000ft:
Formation pressure = 4517.784(psi)
At 12500ft:
Formation pressure = 6082.789(psi)
From the formation pressure data given, Eaton calculated pore pressure is slightly different though the difference is insignificant. This shows that Eaton equation can be used to predict pore pressure using well log data.
Fig. 10. Resistivity versus Depth Well 1- B and C
Fig. 11. Resistivity versus Depth Well 2- A, B and C
V ELOCITY(ft/s ) 0
10 0 0 0
20000
9000
10 0 0 0
DEPTH(ft)
110 0 0
12 0 0 0
13 0 0 0
14 0 0 0
Fig. 12. Velocity versus Depth
hence,
76
Umorem et al. DISCUSSION
REFERENCES
Crossplotting particular rock properties with depth
Bois, M., Grosjean, Y., and de Pazzis, L. (1994). Shale
within the depth of investigation used for this study
compaction and abnormal pressure evaluation –
revealed the overpressure zones. The overpressure zones
application to the offshore Mahakam, paper IPA94-
were detected by the change in the behavioral pattern of
1.1-187, In 23rd Annual Convention Proceedings, V. 1:
the rock properties. Overpressure formations exhibited
Indonesian Petroleum Association, Jakarta, p. 245-
higher porosities, lower bulk densities, lower interval
259.
velocities and lower resistivities. The top of overpressure in Well 1 was observed at 9500ft while Well 2 was
Bowers, G. L. (2002). Detecting High Overpressure:
11200ft. The overpressure zones continued down the
Applied Mechanics Technologies Houston, Texas
depth, observable in shale zones. Well 3 was an isolated
U.S.; The Leading Edge P. 174 – 184.
case where overpressure began at a shallower depth (below 6000ft). Correlating Wells 1 and 2, it can be
Bradley, J. S. and Powley, D.E. (1995). Pressure
established that overpressure can be detected at great
compartments in sedimentary basin – a review, chapter
depths (from 9000ft).
1, in Ortoleva, P. J., ed., basin compartments and seals:
The formation pressure and hydrostatic pressure plots
AAPG Memoir 61, p.3-26.
acted as a control for the detection and estimation of overpressure zones. The use of well logs (sonic log,
Eaton, B.A. (1975). How to use drilling petrophysical data
density log and resistivity log) was to correlate the trend
in prospect evaluation [2 parts]: World Oil, v. 216, no
change of the rock properties at same depth points from
9, p. 69-74; v.216, no.10 p. 45-54.
the different logs. An uneven estimate was made by linking the Eaton method of pore pressure prediction with
Mukerji, T., Dutta, N., Prasad, M. and Dvorkin, J. (2002).
the well log data and the Formation pressure of the well
Seismic Detection and Estimation of Overpressures
(Table 1). Comparing the values of Eaton calculated pore
(The Rock Physics Basis): Stanford Rock physics
pressure with formation pressure, it was observed that they
Laboratory, Stanford California USA and Western
are nearly equal. This closeness confirms that Eaton
Geco, Houston Texas USA CSEG Recorder p. 34 -57.
equation can be used to predict pore pressure using well log data. At both depth points, the Eaton calculated pore pressure and formation pressure were higher than the
Petrospec Technologies Tools, (2007). On-line Pore Pressure Analysis Software Conroe, Texas.
values for Hydrostatic pressure, and this indicates overpressure zones. The future of pore pressure prediction will see dramatic changes in the purpose for which the
Presgraf, (2007). Drilling challenge from Abnormal Pore Pressure: Landmark; Halliburton.
technique used, the types of data used, and the types of analyses employed to get more detailed high-resolution velocity data.
Ruth, V., John, P., Hillis, R. and Tingate P. (2004). The origin of overpressure in the Carnarvon basin Western Austrialia from porosity effective stress analysis.
Table1. Comparing Eaton Calculated Pore Pressure with the Formation Pressure and Hydrostatic Pressure of the Well Depth Formation Hydrostatic Eaton (ft)
pressure
pressure (psi)
(psi)
calculated pore pressure (psi)
10,000 4517.784
4344.7
4858.92
12,500 6082.789
5427.2
6112.43