8 | P a g e. Estimation of Snow Physical Parameters Using EO-1 Hyperion. 1 ..... ,from,http://eo1.usgs.gov/documents/EO1userguidev2pt320030715UC.pdf. [11].
IOSR Journal of Applied Physics (IOSRJAP) ISSN – 2278-4861 Volume 1, Issue 6 (Sep.-Oct. 2012), PP 08-13 www.iosrjournals.org
Estimation of Snow Physical Parameters Using EO-1 Hyperion 1
Manjeet Singh, 2V.D Mishra, 3Jyoti Dhar Sharma, 4Anita Negi 1,3
2
Department of Physics, Shoolini University, Solan (H.P)-173212, India Snow & Avalanche Study Establishment, Defence Research & Development Organization Chandigarh (U.T) - 160036, India 4 Indian Institute of Ecology and Environment, New Delhi-110030, India
Abstract: Snow is a highly unstable and porous material which is composed of frozen water (ice) and air. It undergoes constant change due to ambient conditions and becomes essential matter in earth’s climate system. This makes snow physical parameters as an important tool to study global climate change especially when satellite data provide timely and efficient information about large land area. In the present paper, one of the snow physical parameters (i.e snow grain size) has been estimated using spectral angle mapper (SAM) method and validated with existed grain index (GI) method. Study was carried out by using NASA’s hyperspectral EO-1 Hyperion sensor. The analysis procedure consists of Fast Line-of-sight Atmospheric Analysis of Spectral Hypercubes (FLAASH) atmospheric correction code derives its physics-based algorithm from the Moderate Resolution Transmittance (MODTRAN4) radiative transfer code as well as topographic correction to retrieve surface reflectance. The spectral reflectance of different types of snow grain size, vegetation-mixed snow and boulder-mixed snow has been collected in field, using optical spectro-radiometer and compared with satellite derived spectra. The study reveals a good agreement between the grain size classes i.e. fine, medium and coarse and quantitatively retrieved grain sizes using SAM theory. Keywords: Hyperion, FLAASH, MODTRAN, GI, SAM
I.
Introduction:
Snow is a wide dynamic natural resource which exerts an influence on water management, hydropower generation, climate study, avalanche forecasting, flood forecasting, strategic planning and many other development activities, all contribute to national economy [1-2]. This makes snow cover mapping an important tool to study global climate change especially when satellite data provide timely and efficient information about large land area. Satellite remote sensing is one of the important and proven tools for the mapping and monitoring of vast, rugged and remote snow cover areas [3]. Snow was first observed by satellite in eastern Canada from the TIROS-1 satellite in April 1960. Since then, the potential for operational satellite-based mapping has been enhanced by the development of higher temporal-frequency and satellite sensors with higher spatial resolution [4]. Numerous studies have been performed by different researchers on the spectral properties of snow in the optical region by using multispectral remote sensing [5-[9]. Arrival of hyperspectral remote sensing facilitates the improved retrieval of snow physical parameters in comparison to multispectral remote sensing. The objective of this study is to explore the potential of space-born hyperspectral EO-1 hyperon in Himalayan region and estimation of snow grain size using spectral angle mapper (SAM) method and its comparison/validation with grain size, retrieved from grain index (GI) methods.
II.
Study area
The study area is located in north of greater Himalayan range, lies between 34043'00" N to 34053'00" N latitude and 77046'00" E to 77054'00" E longitude at Ladakh district of Jammu & Kashmir, India (Fig. 1). Generally, the study area has low humidity and an average annual precipitation around 116 mm per year. This region is almost entirely above 3000 m above sea level, thus winters are extremely cold. Due to high altitude zone this area is mostly glaciated and shows no vegetation. The average winter temperature in this region is about −20 °C with extremes as low as −40 °C and summer is pleasantly warm 20 °C. 2.1. Satellite data and Sensor description The current study carried out with 25 November 2003, Level 1_A: L1G/L1T data (geometric and terrain corrected) of Hyperion sensor onboard NASA‟s Earth Observing one (EO-1) platform. This image was available in GeoTIFF format (http://eo1.usgs.gov). Hyperion collects 220 unique spectral channels ranging from 357nm to 2576nm with a 10-nm bandwidth [10]. The instrument operates in a push broom fashion, with a spatial resolution of 30 meters for all bands with a standard scene width of 7.7 kilometers. The data is available in 16-bit signed integer‟s radiance values.
www.iosrjournals.org
8|Page
Estimation of Snow Physical Parameters Using EO-1 Hyperion
Fig. 1 Study area on India map and Hyperion satellite image III.
Methodology
3.1. Satellite data processing Hyperion sensor covered the wavelength region by two detector arrays, one for the visible and nearinfrared (VNIR: 356 nm to 1058 nm) and other for short-wave infrared (SWIR: 852 nm to 2577 nm) with 242 bands of 10 nm spectral resolution and 30 m spatial resolution [10]. But due to radiometric detraction and signal to noise issues only 198 bands are calibrated [11]. The detail description of radiometric errors in Hyperion data are reported by [12-13]. As a result, only a subset of 158 bands maintained for further analysis. Hyperion satellite data was pre-processed in ENVI 4.7 software [14]. The flow chart of the detailed methodology is given in fig. 2.
Fig. 2 Flow chart summarizing the methodology followed in the study 3.2. Atmospheric correction Atmospheric effects caused by molecular, particulate scattering and absorption from the „radiance-atdetector‟ has been eliminated by using Fast Line-of-sight Atmospheric Analysis of Spectral Hypercubes (FLAASH) module based on the MODTRAN-4 radiative transfer code [15][16] in order to retrieve „reflectanceat-surface‟ values. FLAASH allows a researcher to define all parameters that influence atmospheric absorption and scattering such as relative solar position, aerosol, and scattering models, visibility parameters, ozone total vertical column, adjacency effects (scattering of reflected radiance from surroundings into a pixel), artifact www.iosrjournals.org
9|Page
Estimation of Snow Physical Parameters Using EO-1 Hyperion suppression [17] and provides water vapor retrieval. In the present study, atmospheric model with 2-band KT aerosol model [18] was used for atmospheric correction.
3.3 Reflectance estimation for Hyperion
Digital values in Hyperion data represent absolute radiance (W/m 2*µm*sr) values stored as 16-bit signed integers with a scaling factor of 40 for VNIR bands and 80 for SWIR bands. The spectral radiance at sensor pixel using FLAASH is derived from a standard equation [16] as: (1) and Where Lgi is the at-sensor radiance reflected by the target and Lpi is the at-sensor radiance scattered into the path by the atmosphere and the surrounding targets, (ρ) is the pixel surface reflectance, (ρi) is an average surface reflectance for the pixel and a surrounding region, (S) is the spherical albedo of the atmosphere and (La) is the radiance back scattered by the atmosphere. The coefficient A and B depends on atmospheric and geometric conditions but not on the surface. Each of these variables depends on spectral channels; the wavelength index has been omitted for simplicity. The values of A, B, S and La are determined from MODTRAN4 calculations that use the viewing and solar angles and the mean surface elevation of the measurement, and they assume a certain model atmosphere, aerosol type, and visible range.
3.4
Grain size mapping using SAM
A physically-based classification spectral angle mapper (SAM) method was used in present study for the grain size retrieval. The algorithm determines the spectral similarity between the two spectra (i.e. the pixel spectra to known/reference spectra) by calculating the angle between two vectors representing these spectra [19]. To evaluate the selected methodology and classification results, the selection of endmembers based on “Spectral Hourglass” processing scheme [19] were implemented. This Procedure includes the generation of Minimum Noise Fraction-Images (MNF) for data dimensionality estimation and reduction by decorrelating the useful information and separating noise [20], Pixel Purity Index-Mapping (PPI) for the determination of the purest pixels in an image (as potential endmembers) utilizing the (uncorrelated) MNF-images and finally the extraction of endmembers utilizing the n-Dimensional-Visualizer tool (Fig. 3). Shadow Vegetation No contamination Less contamination snow Highly contamination snow
Fig.3 3-D visualization for endmembers collection The extracted endmembers spectra are then compared with the in-situ measured spectral reflectance using optical spectro-radiometer (Fig. 4(a), 4(b) and 4(c)) for identification. The selected image spectra endmembers were further used as reference spectra for mapping grain size using SAM method. The threshold value of SAM angle for classification was set after iteration for tuning the angle between the pixel spectra and the reference spectra to avoid misclassification especially in the shadow regions. SAM angle of 8.5 degree was found suitable for the grain size (fine, medium and coarse) classification (Fig. 5) when compared with field collected grain size spectra (Fig. 6) for fine, medium and coarse grain snow.
3.5 Grain size mapping using GI The snow grain size map was estimated using grain index (GI) method proposed by [21] based on the field collected hyperspectral reflectance data: (2)
www.iosrjournals.org
10 | P a g e
Estimation of Snow Physical Parameters Using EO-1 Hyperion In the present study, Hyperion band number-24 (589.62nm) with bandwidth of 10.65nm and band number-90 (1043.59 nm) with bandwidth of 11.04 nm, were used in equation (2). Further, by the inversion of grain index, fine, medium and coarse grain size snow map was generated (Fig. 7a) using the threshold values 0.0-0.17, 0.17-0.26 and 0.26-0.35 respectively [21]. The above relation was only valid for snow cover pixels, which were selected with the help of normalized difference snow index (NDSI) and visible channel reflectance [22]. NDSI
(3)
Here the threshold value of NDSI, which is normally used 0.4 for binary snow cover mapping [4][22] was raised to 0.6, with a criteria that the visible channel (500nm) reflectance should be greater than 0.6 to avoid fractional snow cover and heavy contaminated snow [9][21].
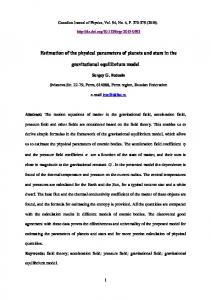
Fig.4 In situ measured spectral reflectance (a) Snow, soil, vegetation, water (b) Boulder-mixed snow (c) Noncontaminated snow and contaminated snow 1.0 0–0.5 mm
0.9
0.5–1.0 mm
0.8
1.0–2.0 mm
Reflectance
0.7 0.6 0.5 0.4 0.3 0.2 0.1 0.0 350
850
1350 Wavelength (nm)
1850
2350
Fig. 5 Estimated Spectral reflectance for different grain sizes by SAM
Fig. 6 Field collected spectra for different grain size IV.
Results and Discussion
The snow grain size was retrieved using SAM algorithm and compared with GI method for a part of the greater Himalaya range on 25 November 2003. Fig. 7a and 7b shows the spatial distribution of grain sizes at a continuous scale for SAM and GI respectively. It has been observed that fine grains are in snow accumulation www.iosrjournals.org
11 | P a g e
Estimation of Snow Physical Parameters Using EO-1 Hyperion area and medium/coarse grains are at ablation / lower elevation areas. The selection of threshold value of SAM angle helps avoid misclassification along steep slopes and shadow or low illuminated areas denoted as unclassified (black) areas. On comparing snow grain size classes using SAM (Figure 7(b) with GI method (Figure 7(a), similar classes as well as similar area for medium grains has been observed (Table 1). In few places, small deviation may be due to the selection of threshold values used for the conversion of grain index to grain size classes. The matrix comparison of different snow grain size classes using SAM and GI shows overall matching area in approximately 93.6 % (Table 1). This indicates the present methodology for the mapping of snow grain size using SAM is well suited for Himalayan region at varying altitude from 3000 m and above.
Table 1. Comparison of retrieved snow grain size using SAM and Grain Index method Study area
Area (Km2) (GI method)
Area (Km2) (SAM method)
46.92
39.56
Error in area (Km2) 7.36
Medium (0.5 – 1.0)
59.57
60.03
0.46
Coarse (1.0 –2.0)
19.32
26.22
6.9
104.19
104.19
0.0
Grain size (mm) Fine (