Evaluating a Trading Rule Mining Method based on Temporal Pattern Extraction Hidenao Abe1, Satoru Hirabayashi2, Miho Ohsaki3, and Takahira Yamaguchi4 1
Department of Medical Informatics, Shimane University, School of Medicine
[email protected] 2 Graduate School of Science and Technology, Keio University
[email protected] 3 Faculty of Engineering, Doshisha University
[email protected] 4 Faculty of Science and Technology, Keio University
[email protected]
Abstract. In this paper, we present an evaluation of the integrated temporal data mining environment for trading dataset from the Japanese stock market. Temporal data mining is one of key issues to get useful knowledge from databases. However, users often face difficulties during such temporal data mining process for data pre-processing method selection/construction, mining algorithm selection, and post-processing to refine the data mining process as shown in other data mining processes. To get more valuable rules for experts from a temporal data mining process, we have designed an environment which integrates temporal pattern extraction methods, rule induction methods and rule evaluation methods with visual human-system interface. After implementing this environment, we have done a case study to mine temporal rules from a Japanese stock market database for trading. The result shows the availability to find out useful trading rules based on temporal pattern extraction
1
Introduction
In recent years, KDD (Knowledge Discovery in Databases) [3] has been widely known as a process to extract useful knowledge from databases. In the research field of KDD, ‘Temporal (Time-Series) Data Mining’ is one of important issues to mine useful knowledge such as patterns, rules, and structured descriptions for a domain expert. However, huge numerical temporal data such as stock market data, medical test data, and sensor data have been only stored to databases. Besides, many temporal mining schemes such as temporal pattern extraction methods and frequent itemset mining methods have been proposed to find out useful knowledge from numerical temporal databases. Although each method can find out partly knowledge of each suggested domains, there is no systematic framework to utilize each given numerical temporal data through whole of the KDD process. To above problems, we have developed an integrated temporal data mining environment, which can apply numerical temporal data to find out valuable
knowledge systematically. The environment consists of temporal pattern extraction, mining, mining result evaluation support system to attempt numerical temporal data from various domains. In this paper, we present an evaluation of the integrated temporal data mining environment with Japanese stock market data. Then, we discuss about the availability of the temporal rule mining process based on temporal pattern extraction.
2
Related Work
Many efforts have been done to analyze temporal data at the field of pattern recognitions. Statistical methods such as autoregressive model and ARIMA (AutoRegressive Integrated Moving Average) have been developed to analyze temporal data, which have linearity, periodicity, and equalized sampling rate. As signal processing methods, Fourier transform, Wavelet, and fractal analysis method have been also developed to analyze such well formed temporal data. These methods based on mathematic models restrict input data, which are well sampled. However, temporal data include ill-formed data such as clinical test data of chronic disease patients, purchase data of identified customers, and financial data based on social events. To analyze these ill-formed temporal data, we take another temporal data analysis method such as DTW (Dynamic Time Wrapping)[1], temporal clustering with multiscale matching [5], and finding Motif based on PAA (Piecewise Approximation Aggregation) [6]. To find out useful knowledge to decide orders for stock market trading, many studies have done. For example, temporal rule induction methods such as Das’s framework [2] have been developed. Frequent itemset mining methods are also often attempt to the domain [15]. Although they analyze the trend of price movement, many trend analysis indices such as moving average values, Bolinger band signals, MACD signals, RSI and signals based on balance table are often never considered. In addition, these studies aim not to find out decision support knowledge, which directly indicates orders for stock market trading, but useful patterns to think better decision by a domain expert. Therefore, the decision support of trading order is still costly task even if a domain expert uses some temporal data analysis methods. The reason of this problem is that decision criteria of trading called anomaly are obtained from very complex combination of many kinds of indices related to the market by domain experts.
3
An integrated temporal data mining environment
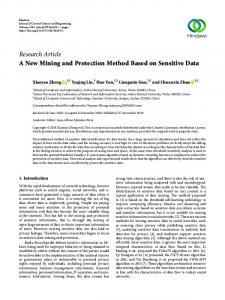
Our temporal data mining environment needs temporal data as input. Output rules are if-then rules, which have temporal patterns or/and ordinal clauses, represented in A=x, Az. Combinations of extracted patterns and/or ordinal clauses can be obtained as if-then rules by a rule induction algorithm. Fig. 1 illustrates a typical output it-then rule visualized with our temporal data mining environment.
IF: courses of observation period
THEN: course of prediction period
Test item C Test item A
Test item B Test item A
Fig. 1. Typical output if-then rule, which consists of patterns both its antecedent and its consequent.
To implement the environment, we have analyzed temporal data mining frameworks [2, 10]. Then, we have identified procedures for pattern extraction as data pre-processing, rule induction as mining, and evaluation of rules with visualized rule as post-processing of mined result. The system provides these procedures as commands for users. At the same time, we have designed graphical interfaces, which include data processing, validation for patterns on elemental sequences, and rule visualization as graphs. Fig. 2 shows us a typical system flow of this temporal data mining environment. Pre-Processing Procedures for structuring a dataset Cleaning
Integration
Equalizing Sampling cycle
Interpolation
Pattern Extraction Extracting sub-sequences
Commands for users Time-series data
Setting up the mining target and observation period. Evaluating patterns Visualizing extracted patterns
Clustering
Attribute Selection
Mining Rule Induction
• Time-series data preprocessing • Selecting Mining algorithms • Rule & Data visualization • Rule evaluation • Database operations
Validation on raw data
Postprocessing Sorting with an index
Setting up an index for sorting. Input rule evaluations Prediction of interest
Visualizing as graphs
Visualized Rules
Fig. 2. A system flow view of the integrated temporal data mining environment.
3.1 Details of procedures to mine temporal rules We have identified procedures for temporal data mining as follows: Data pre-processing - pre-processing for data construction - temporal pattern extraction - attribute selection Mining - rule induction Post-processing of mined results - visualizing mined rule - rule selection - supporting rule evaluation Other database procedures - selection with conditions - join As data pre-processing procedures, pre-processing for data construction procedures include data cleaning, equalizing sampling rate, interpolation, and filtering irrelevant data. Since these procedures are almost manual procedures, they strongly depend on given temporal data and a purpose of the mining process. Temporal pattern extraction procedures include determining the period of sub-sequences and finding representative sequences with a clustering algorithm such as K-Means, EM clustering and the temporal pattern extraction method developed by Ohsaki et al. [12]. Attribute selection procedures are done by selecting relevant attributes manually or using attribute selection algorithms [7]. At mining phase, we should choose a proper rule induction algorithm with some criterion. There are so many rule induction algorithms such as Version Space [9], AQ15 [8], C4.5 rule [13], and any other algorithm. To support this choice, we have developed a tool to construct a proper mining application based on constructive metalearning called CAMLET. However, we have taken PART [4] implemented in Weka [16] in the case study to evaluate improvement of our pattern extraction algorithm. To predict class of a test dataset with learned a classification model, the system should formally predict pattern symbols of the test dataset using some classification learning method L based on the training dataset as shown in Figure 3.
Test data
Training data Datasets Datasetswithout withoutTemporal TemporalPatterns Patterns t
Pattern extraction with clustering
Datasets Datasetswithout withoutTemporal TemporalPatterns Patterns t
Predicting patterns with classification
Datasets Datasets Datasetswith withTemporal TemporalPatterns Patterns Datasetswith withTemporal TemporalPatterns Patterns t t Learning classification model with L.
Fig. 3. The process to obtain a test dataset based on temporal patterns of a training dataset using classification learning algorithm.
To validate mined rules correctly, users need readability and ease for understand about mined results. We have taken 39 objective rule evaluation indexes to select mined rules [11], visualizing and sorting them depended on users’ interest. Although these two procedures are passive support from a viewpoint of the system, we have also identified active system reaction with prediction of user evaluation based on objective rule evaluation indexes and human evaluations. Other database procedures are used to make target data for a data mining process. Since the environment has been designed based on open architecture, these procedures have been able to develop separately. To connect each procedure, we have only defined input/output data format.
4 Evaluating Temporal Rule Mining Performances with the Integrated Temporal Data Mining Environment After implementing the integrated temporal data mining environment described in Section 3, we have done a case study on Japanese stock market database. In this case study, we firstly gathered temporal price data and its trend index values through Kaburobo SDK [17]. Then, using the environment, we evaluated the performance of if-then rules based on temporal patterns. Finally, with regarding to the results, we discuss about the availability of our temporal rule mining based on temporal pattern extraction.
4.1
Description about Temporal Datasets
Using Kaburobo SDK, we got four price values, trading volume, and 13 trend index values as shown in Table 1. Excepting DMI, volume ratio, and momentum, the trend indices are defined as trading signals: buy and sell. The attribute values of these indices are converted from 1.0 to -1.0. Thus, 0 means nothing to do (or hold on the stock) for these attributes. Table 1. The descripiton about attributes from Kaburobo SDK. Attribute name
Description
R A W
opening
opening price of the day ( Ot )
high
Highest price of the day ( H t )
low
Lowest price of the day ( Lt )
closing
Closing price of the day ( Ct )
Volume
Volume of the day ( Vt )
Moving Average
Buy: if SMAt − LMAt < 0 ∩ SMAt −1 − LMAt −1 > 0,Sell: if SMAt − LMAt > 0 ∩ SMAt −1 − LMAt −1 < 0 Where SMAt = (Ct + Ct −1 + K + Ct −12 ) / 13 , and LMAt = (Ct + Ct −1 + K + Ct − 25 ) / 26
Bolinger Band
Buy: if Ct ≥ ( MAt + 2σ ) × 0.05 , Sell: if Ct ≤ ( MAt − 2σ ) × 0.05 where MAt = (Ct + Ct −1 + K + Ct − 24 ) / 25
Envelope
Buy: if
HLband
Buy: if Ct < LowLinet −10 days, Sell: if Ct > HighLinet −10 days
MACD
Buy: if MACDt − AvgMACDt −9 days > 0 ∩ MACDt −1 − AvgMACD(t −1)−9 days < 0 Sell: if MACDt − AvgMACDt −9 days < 0 ∩ MACDt −1 − AvgMACD( t −1)−9 days > 0 Where MACDt = EMAt −12days − EMAt − 26 days , EMAt = EMAt −1 + ( 2 / range + 1)(Ct −1 − EMAt −1 )
DMI
Buy: if PDI t − MDI t > 0 ∩ PDI t −1 − MDI t −1 < 0, Sell: if PDI t − MDI t < 0 ∩ PDI t −1 − MDI t −1 > 0 t t t t Where PDI = ∑ ( H i − H i −1 ) ÷ ∑ TRi ×100 , MDI = ∑ ( Li − Li −1 ) ÷ ∑ TRi ×100 i =t −n i =t − n i =t − n i =t − n , TR = max{( H − C ), (C − L ), ( H − L )}
T R E N D I N D I C E S
Ct ≥ MAt + ( MAt × 0.05) , Sell: if Ct ≤ MAt − ( MAt × 0.05)
t
volumeRatio
VRt = {(
t −1
t
t
∑V
i i = t − 25 , H i > Li
+
t
∑V
i i = t − 25, H i = Li
RSI
RSI t = 100 − 100 /{
Momentum
M t = Ct − Ct −10
t −1
) /(
t
+
t
i i = t − 25, H i < Li
t
∑ (C
t
∑V
i −1 i = t −13 , C i −1 < C i
− Ci ) /
t
t
∑V
i i = t − 25, H i = Li t
∑ (C
i −1 i = t −13 , C i −1 > C i
)} ×100 − C i ) + 1}
Ichimoku1
Buy: if Ct −1 < RLt −9 days ∩ Ct > RLt −9 days , Sell: if Ct −1 > RLt −9 days ∩ Ct < RLt −9 days Where RLt −9 days = average(max(H i ) + min( Li )) (i = t − 8, t − 7,K t )
Ichimoku2
Buy: if Ct −1 < RLt − 26 days ∩ Ct > RLt − 26 days , Sell: if Ct −1 > RLt − 26 days ∩ Ct < RLt − 26 days Where RLt − 26 days = average(max( H i ) + min( Li )) (i = t − 25, t − 24,Kt )
Ichimoku3
Buy: if RL( t − 2 ) − 26 days < RL( t − 2 )−9 days ∩ RL( t −1) − 26 days > RL( t −1) −9 days ∩ RL(t −1)− 26 days < RLt − 26 days Sell: if RL( t − 2 ) − 26 days > RL( t − 2 ) −9 days ∩ RL( t −1) − 26 days < RL( t −1) −9 days ∩ RL( t −1) − 26 days > RLt − 26 days
Ichimoku4
Buy: if Ct > AS1t − 26 ∩ Ct > AS 2t − 26 , Sell: if Ct < AS1t − 26 ∩ Ct < AS 2t − 26 Where AS1t = median( RLt −9 days − RLt −26 days ) , AS 2t = (max(H i ) − min( Li )) / 2 (i = t − 51, t − 50,K t )
We obtained temporal data consists of the above mentioned attributes about five financial companies and four telecommunication companies as follows: Credit Saison (Saison), Orix, Mitsubishi Tokyo UFJ Financial Group (MUFJFG), Mitsui Sumitomo Financial Group (MSFG), Mizuho Financial Group (MizuhoFG), NTT, KDDI, NTT Docomo, and Softbank. The period, which we have collected from the temporal stock data, is from 5th January 2006 to 31st May 2006. For each day, we have made decisions as the following: the decision is if the closing value rises 5% within 20 days then 'buy', otherwise if the closing value falls 5% within 20 days then 'sell', otherwise 'hold'. We set these decisions as the class attribute to each target instance. Table 2 shows the class distributions about the nine stocks for the period.
Table 2. The distributions of decisions of the nine stocks during the five months.
Finance Saison Orix MUFJFG MSFG MizuhoFG
Buy 37 43 0 6 38
sell 53 40 50 27 31
Telecom. NTT KDDI NTTdocomo Softbank
buy 27 42 19 23
sell 32 39 29 69
For each gathered temporal data of the nine stocks, the system extracted temporal patterns for each attribute. Then, the symbols of each pattern and the decision of each day joined as each instance of the target dataset as illustrated in Figure 4. Fig. 4. An illustration of the process to obtain target datasets from temporal data Dataset Datasetfor forTemporal TemporalPattern PatternExtraction Extraction t
Price / Technical Index values t
Separating Each Index SubSequence
Clustring each items & join decisions
Target TargetDataset Dataset Decision point …
Sub-Sequenced Sub-SequencedData Data
Price / Technical Index pattern symbols Decision
4.2
Mining results of the nine temporal stock data
To extract temporal patterns, we have used K-Means and EM algorithm, which are implemented in Weka. Then, to predict temporal pattern of each test dataset, we have used Boosted C4.5 [14], which is also implemented in Weka. As shown in Table 3, predicting temporal patterns for test dataset are succeeded, because the accuracies of the nine dataset are satisfactory high scores as a classification task.
Table 3. Accuracies (%) of re-substitution on the two temporal pattern extraction with KMeans and EM algorithm.
Finance
K-Means
EM
Telecom.
K-Means
EM
Saison Orix MUFJFG MSFG MizuhoFG
90.1 88.9 90.9 96.0 92.9
88.9 84.8 93.9 90.9 83.8
NTT KDDI NTTdocomo Softbank
84.8 86.9 80.8 93.9
90.9 78.8 85.9 89.9
Table 4 shows accuracies (%) of cross stock evaluation on the two temporal pattern extraction algorithms. The cross stock evaluation uses different stocks as training dataset and test dataset. Stocks in rows mean training datasets, and columns mean test datasets. As shown in this table, bolded accuracies go beyond 50%, which means that the mined rules work better than just predicting sell or buy. The result shows the performance of our temporal rules depends on the similarity of trend values rather than the field of each stock. Table 4. Accuracies (%) of cross stock evaluation with tempral patterns using K-Means and EM algorithm. K-Means Saison MUFJFG MSFG MizuhoFG Orix NTT KDDI NTTdocomo Softbank Saison 44.4 28.3 31.3 40.4 29.3 35.4 22.2 49.5 MUFJFG 46.5 44.4 30.3 42.4 32.3 39.4 29.3 55.6 MSFG 44.4 24.2 38.4 31.3 28.3 27.3 29.3 22.2 MizuhoFG 46.5 31.3 33.3 29.3 22.2 20.2 22.2 58.6 Orix 38.4 27.3 31.3 32.3 39.4 19.2 30.3 50.5 NTT 14.1 27.3 31.3 14.1 39.4 37.4 6.1 50.5 KDDI 12.1 44.4 27.3 31.3 41.4 16.2 56.6 55.6 NTTdocomo 26.3 40.4 33.3 23.2 30.3 20.2 8.1 52.5 Softbank 44.4 28.3 18.2 45.5 34.3 40.4 30.3 26.3 EM Saison MUFJFG MSFG MizuhoFG Orix NTT KDDI NTTdocomo Softbank 51.5 65.7 Saison 46.5 28.3 31.3 38.4 21.2 32.3 MUFJFG 31.3 31.3 38.4 29.3 41.4 22.2 46.5 51.5 MSFG 23.2 34.3 31.3 43.4 32.3 30.3 29.3 58.6 MizuhoFG 35.4 31.3 34.3 31.3 42.4 38.4 43.4 20.2 Orix 41.4 29.3 39.4 34.3 37.4 21.2 28.3 25.3 NTT 41.4 21.2 20.2 42.4 44.4 33.3 23.2 39.4 KDDI 28.3 27.3 42.4 28.3 37.4 61.6 59.6 50.5 NTTdocomo 27.3 42.4 29.3 25.3 30.3 19.2 28.3 52.5 52.5 Softbank 45.5 27.3 31.3 41.4 33.3 43.4 19.2
Figure 5 shows an example of temporal rules. These rules are obtained from the training dataset with EM algorithm temporal pattern extraction for Saison. As shown in Table 3, the rule set of Saison works the best to KDDI test dataset.
Fig. 5. An example of rule for 'buy' and rule for 'sell'. The Therule rulefor for'buy' 'buy' momentum
186.2
The Therule rulefor for‘sell' ‘sell'
Bolinger opening Band
sell
5780 1
Ichimoku4
buy
1
0.5
0.5
-172.0
buy
5610
Ichim oku4
opening B olingerBand M om entum
hold
0 -75
-65
-55
-45
-35
-25
-15
-5
0 -75
days
4.3
-65
-55
-45 days
-35
-25
-15
-5
Discussion about the temporal rule mining
The prediction of decisions for each dataset works correctly with regarding to the result of Table 3, predicting temporal patterns of test dataset with a classification learning algorithm. However, mined rules based on temporal patterns are rather over fitting to each training dataset as shown in Table 4. One of the solutions to avoid over fitting will be to mine a temporal rule set from a training dataset, which consists of multiple stocks. With regarding to Figure 5, our temporal rule mining system can find out adequate combinations of trend index patterns for each stock. To learn adequate trend index pattern combinations is very costly work for trading beginners. Thus, our temporal rule mining can support traders who want to know the adequate combinations of trend indices for each stock.
5
Conclusion
We have designed and implemented a temporal data mining environment, which integrates temporal pattern extraction, rule induction, and rule evaluation. As the result of the case study on the nine Japanese stock datasets, this environment mines valuable temporal rules to predict different stock decisions based on temporal pattern extraction. The result also indicated the availability to support stock traders to learn adequate combinations of trend index patterns. In future, we will evaluate trading result with the predictions of decisions by each mined temporal rule set on the stock trading simulator included in Kaburobo SDK. Although we have not tried to select proper algorithms for the temporal pattern extraction procedure, the attribute selection procedure and the mining procedure, it is also able to connect subsystems for selecting each proper algorithm to this environment.
References 1. Berndt, D. J. and Clifford, J. “Using dynamic time wrapping to find patterns in time series”, in Proc. of AAAI Workshop on Knowledge Discovery in Databases (1994) pp.359-370 2. Das, G., King-Ip, L., Heikki, M., Renganathan, G., and Smyth, P., “Rule Discovery from Time Series”, in Proc. of International Conference on Knowledge Discovery and Data Mining (1998) pp.16-22 3. Fayyad, U. M., Piatetsky-Shapiro, G., and Smyth, P., “From Data Mining to Knowledge Discovery: An Overview”, Advances in Knowledge Discovery and Data Mining, AAAI Press / The MIT Press, CA (1996) pp.1-34 4. Frank, E., Witten, I. H., “Generating accurate rule sets without global optimization”, in Proc. of the Fifteenth International Conference on Machine Learning (1998) pp.144-151 5. Hirano, S. and Tsumoto, S., “Mining Similar Temporal Patterns in Long Time-Series Data and Its Application to Medicine”, in Proc. of the 2002 IEEE International Conference on Data Mining (2002) pp.219-226 6. Lin, J., Keogh, E., Lonardi, S., and Patel, P., “Finding Motifs in Time Series”, in Proc. of Workshop on Temporal Data Mining (2002) pp.53-68 7. Liu, H., and Motoda, H., “Feature selection for knowledge discovery and data mining”, Kluwer Academic Publishers (1998) 8. Michalski, R., Mozetic, I., Hong, J., and Lavrac, N., “The AQ15 Inductive Leaning System: An Overview and Experiments”, Reports of Machine Leaning and Inference Laboratory, MLI-86-6, George Maseon University, (1986) 9. Mitchell, T. M., “Generalization as Search”, Artificial Intelligence, 18(2) (1982) pp.203-226 10.Ohsaki, M., Sato, Y., Yokoi, H., and Yamaguchi T., "A Rule Discovery Support System for Sequential Medical Data - In the Case Study of a Chronic Hepatitis Dataset -, ECML/PKDD-2003 Workshop on Discovery Challenge, (2003) pp.154-165 11.Ohsaki, M. Kitaguchi, S., Okamoto, K., Yokoi, H., and Yamaguchi, T., “Evaluation of Rule Interestingness Measures with a Clinical Dataset on Hepatitis”, in Proc. of ECML/PKDD 2004, LNAI3202 (2004) pp.362-373 12.Ohsaki, M., Abe, H., Kitaguchi, S., Kume, S., Yokoi, H., and Yamaguchi, T., “Development and Evaluation of an Integrated Time-Series KDD Environment - A Case Study of Medical KDD on Hepatitis-", Joint Workshop of Vietnamese Society of Artificial Intelligence, SIGKBS-JSAI, ICS-IPSJ and IEICE-SIGAI on Active Mining (2004) No.23. 13.Quinlan, J. R., “Programs for Machine Learning”, Morgan Kaufmann (1992) 14.Quinlan, J. R., "Bagging, Boosting and C4.5", AAAI/IAAI, 1 (1996) pp. 725-730 15. Raymond, W., and Ada, F., "Mining top-K frequent itemsets from data streams", Data Mining and Knowledge Discovery, 13(2) (2006) pp.193-217 16.Witten, I. H. and Frank, E., “Data Mining: Practical Machine Learning Tools and Techniques with Java Implementations”, Morgan Kaufmann, San Francisco (2000) 17. KabuRobo: [http://www.kaburobo.jp] (in Japanese)