Special Issue: NANOCELLULOSE Nordic Pulp & Paper Research Journal Vol 29 no (1) 2014
Characterization of fibrillated celluloses. A short review and evaluation of characteristics with a combination of methods Heli Kangas, Panu Lahtinen, Asko Sneck, Anna-Maija Saariaho, Ossi Laitinen and Erkki Hellén called cellulose nanofibrils. In turn, cellulose microfibrils, manufactured by mechanical treatments alone, are polydisperse materials with broad size distribution of particles and can contain both micro- and nano-sized fibrils. The proposal for definition of nanomaterials given by the European Commission also provides a means to distinguish between CMFs and CNFs, stating that a nanomaterial is “a natural, incidental or manufactured material containing particles, in an unbound state or as an aggregate or as an agglomerate and where, for 50 % or more of the particles in the number size distribution, one or more external dimensions is in the size range 1 nm - 100 nm” (European Commission 2011). Nano-sized celluloses have many unique properties different from micro- or millimetre sized cellulose fibres, which make them attractive for several applications, such as strength enhancement additives in packages and lightweight composites, rheology modifiers in e.g. coatings, paints, food and cosmetics, barrier materials in foodcontact materials and as porous and absorbent materials for various purposes (Klemm et al. 2011).These so-called nano-specific properties include their high aspect ratio of 100-150 (Siró, Plackett 2010) and large specific surface area, which has been estimated to be around 100200 m2/g (Lavoine et al. 2012). Cellulose micro- and nanofibrils can also be considered as strong and elastic materials, as estimates for the axial Young’s modulus of cellulose nanofibrils and fibrils range from 13 to 180 GPa, depending on the raw material and the preparation method (Josefsson et al. 2013). As with any new materials, proper characterization of cellulose micro- and nanofibrils is essential, both for their trade and for their safety assessment. However, characterization of fibrillated celluloses is challenging, due to their heterogeneous nature and the fact that they mostly consists of long, slender fibrils with a high degree of branching. Fibrillated celluloses contain fibrils and fibres with variable dimensions and thus their proper assessment requires methods that can operate on several dimensional scales. Direct characterization of fibrillated celluloses relies at the moment primarily on microscopic imaging. However, microscopic evaluation is timeconsuming and is based on subjective assessment of small areas in the larger sample. In addition, improper pre-treatment may introduce artefacts into the images. Some indirect measurements methods have also been introduced, generally the interest being in the correlation to the particle size of fibrillated celluloses. However, very few methods have been shown to work well for fibrillated cellulose. As an example, methods suitable for measuring the particle size distribution of (assumingly) spherical particles, such as methods based on light scattering, are generally not suitable for fibrillated celluloses.
KEYWORDS: Cellulose microfibrils (CMF), Cellulose nanofibrils (CNF), Characterization, Microscopy, Low shear viscosity, Transmittance SUMMARY: The most important properties of fibrillated celluloses and the state-of-the-art methods for their characterization are discussed on the basis of literature review and our collective experience on the material. Five mechanically manufactured fibrillated celluloses were analysed with a combination of methods, revealing information on their morphology, rheological properties, average size and size distribution and amount of the true nano-sized material. The results showed that the studied samples differed greatly in their properties. The phenomena behind their behaviour proved to be complex, and any single characterization method cannot be used to describe their properties and behaviour. Instead, a combination of methods based on different measuring principles must be applied. Based on the results, a basic characterization package can now be recommended for chemically un-modified fibrillated celluloses, including shear viscosity and transmittance measurements, as well as evaluation of appearance, morphology and fibril size by optical and electron microscopy. ADDRESSES OF THE AUTHORS: Heli Kangas (
[email protected]), Panu Lahtinen (
[email protected]), Asko Sneck (
[email protected]) and Erkki Hellén (
[email protected]): VTT Technical Research Centre of Finland, P.O. Box 1000, FI-02044 VTT, Finland. Anna-Maija Saariaho (
[email protected]): Kemira Oyj, R&D and Technology, P.O. Box 44, FI-02271 Espoo, Finland. Ossi Laitinen (
[email protected]): University of Oulu, Fibre and Particle Engineering laboratory, P.O. Box 4300, FI-90570 University of Oulu, Finland. Corresponding author: Heli Kangas Cellulosic materials consisting of cellulose fibres or fibrils with at least one external dimension in the nanoscale, i.e. between 1-100 nm, are generally called nanocelluloses. Fibrillated celluloses, manufactured by mechanical treatments, or with a combination of chemical or enzymatic and mechanical treatment, can be considered as a class of nanocelluloses. Two types of fibrillated celluloses are generally recognised, namely cellulose microfibrils (CMF, or microfibrillated cellulose, MFC) and cellulose nanofibrils (CNF, or nanofibrillated cellulose, NFC). However, there is no clear distinction, when a material should be called cellulose microfibrils and when it can be referred to as cellulose nanofibrils. Generally, the monodisperse materials consisting solely of individual nano-sized cellulose fibrils, prepared by using strong oxidative chemical treatments, such as TEMPO (2,2,6,6-tetramethylpiperidine-1-oxyl radical)mediated oxidation, prior to mechanical treatment, are 129
Special Issue: NANOCELLULOSE Nordic Pulp & Paper Research Journal Vol 29 no (1) 2014
The aim of the current work is firstly to review the state-of-the-art in the characterization of fibrillated celluloses and based on this, identify the most critical properties that need to be analysed for the proper characterization of the material. The review was limited to cellulose micro- and nanofibrils prepared by mechanical means or by a combination of mechanical and chemical or enzymatic treatments. However, characterization of various nanocellulose grades modified by e.g. silylation, is outside the scope of this text. Based on the knowledge of critical properties for fibrillated celluloses and information on the best analytical methods for their characterization, a set of characterization methods was selected and used to analyse five different samples of fibrillated cellulose. The aim in the characterization was the assessment of the most basic properties of fibrillated celluloses, which might provide for example the producers of these types of materials a useful combination of characteristics and analysis methods. Fast and agile characterization methods, potentially capable for routine and on-site analysis, were therefore preferred in this work. Based on the characterization results presented in this work, a set of analysis methods can now be recommended for the characterization of basic properties of chemically unmodified fibrillated celluloses.
need to be dry and the drying method is known to influence the quality of the images. The samples can be prepared by air-drying, freeze drying or by critical point drying (Abe et al. 2007; Korhonen et al. 2011). Air drying has been performed by filtration, by drying a drop of dilute fibril suspension on a flat substrate and by spin coating (Ahola et al. 2008; Chinga-Carrasco, Syverud 2010; Pääkkö et al. 2007; Pöhler et al. 2011; Vartiainen et al. 2011). Solvent-exchange can be performed prior to air drying to prevent aggregation of fibrils (Henriksson et al. 2008). In addition, for SEM imaging, the samples usually need to be coated with a metallic conductive layer, the thickness of which should be minimized in order to avoid overestimation of the dimensions (Fukuzumi et al. 2009). As shown by Chinga-Carrasco and Syverud (2010), the FE-SEM imaging can also be performed without the conductive layer, by using low acceleration voltages. However, in most cases, the resolution provided by SEM is not adequate for evaluation of details of nanoscale cellulose fibrils and microscopic techniques with higher resolution, TEM and AFM, are utilized. Typically, TEM has resolution between 0.1 and 0.2 nm (Michler 2008). The sample preparation is challenged by the fact that the samples for TEM need to be quite thin, typically less than 100 nm (Wågberg et al. 2008). Another challenge is that the contrast between cellulose nanofibrils and the background is often quite modest (Moon et al. 2014). This can be improved by different staining methods. TEM can also be operated at cryomode, enabling the analysis of vitrified samples. AFM can be used for topography measurements of cellulose nanofibrils, revealing morphological characteristics at nano-scale. For AFM analysis, usually a drop of dilute suspension is placed on a mica surface and left to dry. Typically an intermittent-contact mode is used to image the cellulose nanofibrils in order to avoid surface artifacts. The AFM tip convolution effects can lead to exaggeration of the dimensions of the cellulose nanofibrils measured by AFM topographical images and also make it difficult to image the individual particles within agglomerates. However, the height of the cellulose nanomaterial can be determined with sub-nanometer resolution and the height measurement can be used as an estimate of the object width (Moon et al. 2014). Traditionally, microscopic methods have been used as a tool to analyse the dimensions and quality of fibrillated celluloses produced from various raw materials using different fibrillation techniques (Abe et al. 2007; Chakraborthy et al. 2005; Cheng et al. 2010; Iwamoto et al. 2008; Jonoobi et al. 2009; Kaushik, Singh 2011; Pääkkö et al. 2007; Pöhler et al. 2010; Saito, Isogai 2004; Saito et al. 2006; 2007; 2009; Wang et al. 2012; Zimmermann et al. 2004). For obtaining the best and most accurate information on the morphology and dimensions of cellulose nanofibrils, a combination of the microscopic methods, such as FE-SEM and TEM or cryo-TEM and AFM, has usually been utilized. Due to the polydisperse nature and irregular shape of particles, manual or semi-automated microscopic image analysis has been the best, and basically the only, method so far for obtaining direct information on the size and size distribution of fibrils in fibrillated celluloses (Vartiainen
Literature on characterization of fibrillated celluloses Morphology and estimation of fibril dimensions Microscopic methods at different magnifications are valuable tools for studying the appearance, morphology, sizes and shapes of micro- and nanofibrillated celluloses. Optical microscopy (OM) can be used to get an overview of the fibrillated celluloses, for example of the sample homogeneity (Pöhler et al. 2010; Saito, Isogai 2004; Saito et al. 2006; 2007; 2009). Microscopy enabling imaging with higher resolution such as scanning electron microscopy (SEM), transmission electron microscopy (TEM) and atomic force microscopy (AFM) provide details of the fibril dimensions (Abe et al. 2007; Ahola et al. 2008; Henriksson et al. 2008; Johansson et al. 2011; Pääkkö et al. 2007; Saito et al. 2007). At the moment, the high resolution electron microscopy or atomic force microscopy can be considered as the state of the art methods for measuring the particle size and size distribution of polydisperse fibrillated cellulose samples (Linsinger et al. 2012). SEM has a resolution between optical microscopes and TEM and AFM, and is able to give information from millimetre scale to true nanometer scale. However, the resolution of SEM depends on the electron source, and field emission (FE) emitters are needed for imaging the dimensions at nano-scale (Goldstein et al. 1992). SEM imaging has been therefore used to provide a rough estimation of the width of the nanofibrils formed (Abe et al. 2007; Iwamoto et al. 2008). SEM imaging can also be used to study the branching of the nanofibrils, but determination of length is difficult due to the entanglement of the fibrils and their micrometer-scale length (Moon et al. 2014). For SEM imaging, the samples 130
Special Issue: NANOCELLULOSE Nordic Pulp & Paper Research Journal Vol 29 no (1) 2014
et al. 2011; Wang et al. 2012). However, this method is laborious and produces only subjective data, the result depending on the person performing the analysis. Vartiainen et al. (2011) obtained information on the size distribution of cellulose microfibrils by measuring manually the widths of 300 single fibrils from FE-SEM images by image analysis software. Wang et al. (2012) determined the diameters of nanofibrils by quantitative imaging analysis from both SEM and TEM images using image analysis software. According to their results, SEM imaging is only capable of resolving fibril diameters of 100 nm or more, while TEM imaging can be used to analyse fibril diameters as low as a few nanometers. The particle size of fibrillated celluloses can also be evaluated using indirect methods, such as transmission measurements (Saito et al. 2006). For suspensions of TEMPO-oxidized cellulose nanofibrils, the transmittance measured by UV-vis spectrometer increased with increased addition of the oxidizing reagent, indicating that the suspension became more transparent as the disintegration of the particles progressed, i.e. their particle size decreased. Chinga-Carrasco (2013) found recently that the fibrillation degree of CMF can be evaluated by studying the light scattering properties of CMF films with an optical scanner. In this method, fibres and poorly fibrillated fibres are detected as darker areas and film areas with high fraction of nanofibrils have high light transmittance. Fractionation of fibrillated cellulose into separate size fractions can provide a useful tool for particle size evaluation by providing estimates of the amount of different size fractions in the samples. In addition, fractionation could be utilized as a pre-treatment for microscopic imaging, as image analysis is facilitated when particles of very different size are placed in different fractions. The fractionation can be performed by mechanical fractionation (Tanaka et al. 2012) or by tube flow fractionation (Haapala et al. 2013).
have been used to obtain complementary information of the behaviour of fibrils under shear. The gel-like behaviour of suspensions has been observed above the critical microfibril concentration, while below that concentration the behaviour of the suspension can be close to Newtonian (Lowys et al. 2001; Lasseuguette et al. 2008). It is believed that the fibrils form a network at the critical concentration. High elastic moduli have been measured for the CMF suspensions due to well controlled networking of the fibrils (Pääkkö et al. 2007). Two shear thinning regions have been observed, under low and high shear conditions, with a viscosity plateau in between (Iotti et al. 2011; Karppinen et al. 2012; Saarikoski et al. 2012). The suspension’s floc size and behaviour are related to the applied shear, but also a relation to the fibrillation degree could be found (Karppinen et al. 2012; Saarikoski et al. 2012).
Amount of nanomaterial The amount of nanomaterial is an important property for polydisperse fibrillated celluloses, since the size of the majority of the material may well be outside the nanoscale. Besides estimating the particle size distribution, the mechanical fractionation described by Tanaka et al. (2012) could potentially be used to analyse the amount of nano-sized fibrils in the sample. Ahola et al. (2008) used ultracentrifugation for the separation of nanofibrils from the larger-sized particles in the fibrillated cellulose sample. During centrifugation, the nanofibrils were concentrated in the supernatant and the content of the nano-sized material was determined as the solids content of the supernatant. The centrifugation conditions depended on the type of fibrillated cellulose treated; the fibrillated celluloses with low charge density were centrifuged for 45 minutes at c. 10 000 g, while 2 h was used for the fibrillated celluloses with high charge density. Taipale et al. (2010) used ultracentrifugation for 45 minutes to determine the content of nano-sized material in both chemically unmodified and modified CMFs. However, currently the results given by either of the methods described above can be considered only as indicative, since the size distribution of fibrils found either in the smallest-size fraction after mechanical fractionation or in the supernatant after centrifugation has not been systematically studied.
Rheology Herrick et al. (1983) were the first to study the rheological properties of CMF suspension and to find out the interesting pseudoplastic, i.e. shear thinning behaviour. In their pioneering paper, it was claimed that the relative viscosity of a 2% CMF suspension could be used as a measure of the degree of homogenization or microfibrillation of a given wood cellulose pulp. CMF is also well-known for its gel forming property, observed already at low concentrations, such as 0.125% (Pääkkö et al. 2007). This behaviour is due to the strong interfibrillar forces of cellulose fibrils. The rheological properties of fibrillated celluloses are interesting from the scientific point of view but also due to their application potential, and have therefore they gained a lot of research interest (Charani et al. 2013; Iotti et al. 2011; Karppinen et al. 2012; Lasseuguette et al. 2008; Lowys et al. 2001; Saarikoski et al. 2012). The rheology of the cellulose fibril suspensions has been studied using various types of rheometers, measuring in steady state, stepped flow or under dynamic conditions as well as under low and high shear. Optical measurements
Physical structure Crystallinity, specific surface area and degree of polymerization (DP) can be considered important physical structural properties of any cellulosic material. The crystallinity as well as the crystal structure and size of native cellulose depend on its source, and these properties can be further modified during manufacturing of fibrillated celluloses, especially if chemical treatments are included. Specific surface area is known to increase when producing small-scale cellulosic particles. DP value gives an estimation of the chain length of cellulose. Several techniques can be used for the determination of cellulose crystallinity and the dimensions of cellulose crystals, including X-ray diffraction (XRD), Raman spectroscopy, infrared spectroscopy and 13C nuclear 131
Special Issue: NANOCELLULOSE Nordic Pulp & Paper Research Journal Vol 29 no (1) 2014
Surface chemistry
magnetic resonance (NMR). The results obtained for cellulose crystallinity will therefore depend on the analysis method used, as well as the on differences in data analysis. For example, in XRD analysis, several methods are available for calculating the results, such as peak height/intensity (Segal et al. 1959), peak area/deconvolution (e.g. Garvey et al. 2005) and amorphous subtraction methods (Ruland 1961). The different calculation methods can influence the results significantly (Park et al. 2010). The comparison of cellulose crystallinities reported in the literature is therefore challenging. XRD analysis has been by far the most common method for evaluation of cellulose crystallinity of fibrillated celluloses (Abe, Yano 2010; Cheng et al. 2007; 2010; Isogai et al. 2011; Iwamoto et al. 2007). However, the results have been often controversial. For example, XRD analysis of mechanically manufactured fibrillated celluloses have shown both decrease (Iwamoto et al. 2007) and increase (Abe, Yano 2010) in cellulose crystallinity during grinding. With XRD analysis, Cheng et al. (2010) observed changes in the crystalline structure of cellulose fibres during high-intensity ultrasonic treatment, whereas with FT-IR analysis, no changes were observed. In addition, the XRD results calculated here with the peak area method resulted in much lower values than those analysed previously with the peak height method (Cheng et al. 2007). Several methods have been utilized for the determination of specific surface area (SSA) of fibrillated cellulose. One of the methods used quite frequently is the measurement of N2 adsorption for cellulose nanofibril aerogels, followed by calculation of SSA from the adsorption curve by Brunauer-Emmet-Teller (BET) method (Pääkkö et al. 2008; Liebner et al. 2008; Sehaqui et al. 2011). For this technique, the sample preparation is critical for obtaining representative results, since the method of drying directly affects the available surface area. Often the samples are prepared by solvent exchange followed by for example supercritical CO2 drying (Sehaqui et al. 2011). Spence et al. (2010) utilized the Congo red adsorption method based on staining for the determination of SSA for CMFs produced from various raw materials, and differing in their lignin content. The authors concluded that the Congo red adsorption method may suffer from an artefact, due to the dye adsorbing more readily to hydrophobic lignin than to hydrophilic cellulose. Leppänen et al. (2010) determined the SSA of commercial CMF with small-angle X-ray scattering (SAXS). The CMF was analysed as wet (10% suspension in water), as air-dried and as re-immersed in water and in ethanol. The specific surface area of cellulose increased when CMF was immersed in both water and ethanol, indicating opening of the fibre bundles due to solvent interaction. In this case also, the sample preparation plays a very important role in the determination of the SSA. For determination of DP for fibrillated celluloses, a viscosity method based on copper ethylenediamine according to standard ISO 5351 has generally been used (Iwamoto et al. 2007; Henriksson et al. 2007; 2008; Zimmermann et al. 2010). Generally, the DP has been found to decrease during the fibrillation process.
The surface chemical properties of chemically unmodified fibrillated celluloses are very similar to that of native cellulose, whereas chemical pre- or posttreatments naturally change the cellulose chemistry, creating the need for surface chemical analysis. Measurement of surface charge and determination of surface chemistry, e.g. functional groups on the surface may be combined to follow the extent of chemical reaction on the surface and thus monitor the success of the chemical treatment. For the estimation of charge level on the cellulose surface, determination of zeta potential has been found to be a useful tool. Taipale et al. (2010) measured the zetapotentials of four cellulose microfibril samples, three of them without chemical pre-treatment and one pre-treated by carboxymethylation. The zeta-potentials of the mechanically treated samples were similar, while that of the carboxymethylated sample was twice as high. Eronen et al. (2012) also reported differences in the zetapotentials between untreated, TEMPO-oxidized and cationized cellulose nanofibrils. These results indicate that charge measurements are essential for chemically modified nanocelluloses, but not always necessary for unmodified samples. Different titrimetric methods have been used both for the determination of surface charge and the content of functional groups on the surface of cellulose nanofibrils. Electric conductivity titration method has been used to monitor the kinetics of TEMPO-mediated oxidation of cellulose fibres by measuring the formation of carboxylate and aldehyde groups (Saito and Isogai 2004; Okita et al. 2010). Syverud et al. (2011) determined the carboxylate content of TEMPO-oxidized cellulose nanofibrils by conductometric and potentiometric titrations, which were found to give comparable results. Junka et al. (2013) found that a conductometric method with hydrochloric acid (HCl) back titration is a suitable method for the determination of total charge of carboxymethylated cellulose fibrils, while for the surface charge the direct polyelectrolyte titration is more suitable than the indirect polyelectrolyte titration method, which resulted in too high values. Fourier transform infrared spectroscopy (FT-IR) has also been used to evaluate the oxidation level of cellulose fibrils during TEMPO-oxidation by monitoring the absorbance due to carbonyl groups at 1738 cm-1, which increased at higher oxidation levels (Saito et al. 2006). Detailed information on the surface chemistry of cellulose nanofibrils can be obtained with surfacesensitive analysis methods, such as X-ray photoelectron spectroscopy (XPS). XPS has been found to provide quantitative information on surface modification of cellulose nanofibrils (e.g. Aulin et al. 2010; Siqueira et al. 2010; Stenstad et al. 2008). XPS has also been utilized for an indirect evaluation of the surface reactivity of cellulose nanofibrils (Johansson et al. 2011; Österberg et al. 2013).
132
Special Issue: NANOCELLULOSE Nordic Pulp & Paper Research Journal Vol 29 no (1) 2014
The most important properties of fibrillated celluloses and the state-of the art characterization methods
on the structure of the films, such as the porosity and density, as well as on the method and conditions of sheet preparation and mechanical testing, as recently reviewed by Dufresne (2012). In this work, the authors concluded that the testing of mechanical properties of fibrillated celluloses should be performed using methodology relevant to the intended application, such as composites or films, and therefore the testing was considered outside the scope of this work. In this work, the following basic characteristics of fibrillated celluloses were addressed: morphology, rheological properties, particle size and size distribution and amount of nanomaterial. The methods chosen for the determination of the amount of nanomaterial were fractionation by centrifugation and by tube flow. Attempts were made to study the average size and size distribution of the fibrillated cellulose by indirect methods such as transmittance measurements and using the data given by image analysis during the tube flow fractionation. SEM imaging was used to get direct information about the fibril dimensions. Optical microscopy was also utilized to study the overall appearance of the samples, especially their homogeneity on macro- and micro-scale. The rheological properties of the fibrillated celluloses samples were studied by shear viscosity measurements.
Based on the literature review on the characterization of fibrillated celluloses as well as on our experience on the material, the most important properties of fibrillated celluloses were recognised, along with the most suitable characterization methods (Table 1). In this work, we aimed at the general characterization of chemically unmodified fibrillated celluloses, which could be performed for example at production site. Therefore, some of the characteristics listed in Table 1, such as the amount and quality of the dissolved and colloidal substances and the specific surface area were considered to be too advanced for the purpose of this work. In addition, great variations were not expected in the samples’ surface chemical properties or their crystallinity and thus these were not addressed in this work. The mechanical properties are also very important characteristics of fibrillated celluloses, and some efforts have been taken towards measuring the strength and elastic moduli of individual cellulose fibrils by AFM (Iwamoto et al. 2009; Cheng et al. 2009). However, a more common approach for evaluating the mechanical properties of fibrillated celluloses has been through measuring the strength properties of CNF films. The mechanical properties of films are known to depend both
Table 1 - The most important properties of fibrillated celluloses and state-of-the-art characterisation methods. Property Amount of nanomaterial Average particle size and size distribution
Rheology i.e. viscosity, yield stress, gel point, aspect ratio Appearance, dimensions, branching degree, fibril aspect ratio (length/width, L/w) Dissolved (colloidal) substance (amount and quality) Crystallinity Specific surface area Surface charge and chemistry (chemically modified cellulose)
Mechanical properties
Characterization method Mechanical fractionation by combination of sieves and membranes (Tanaka et al. 2012) Fractionation by centrifugation (Ahola et al. 2008) Field / tube flow fractionation (Haapala et al. 2013) Light scattering measurements (for low aspect ratio materials) Transmittance by UV-vis spectroscopy (Saito et al. 2006) Fibre analysers Fractionators Turbidity Microscopy (for fibrillated materials) by scanning electron (SEM), transmission electron (TEM) or atomic force microscopes (AFM) (Vartiainen et al. 2011; Wang et al. 2012) Low shear viscosity by viscometers (Iotti et al. 2011) Gel strength, viscoelastic properties by rheometers (Pääkkö et al. 2007) Microscopy by optical microscope (OM) and SEM/TEM/AFM (Pääkkö et al. 2007; Ahola et al. 2008) Gel permeation chromatography (GPC) Size-exclusion chromatography (SEC) High-performance liquid chromatography (HPLC) Microscopy by SEM/TEM/AFM X-ray diffraction (XRD) (Iwamoto et al. 2007) X-ray scattering by small-angle XRS (SAXS) (Leppänen et al. 2010) N2 adsorption, Brunauer-Emmett- Teller (BET) isotherms (Pääkkö et al. 2007) Conductometric titration (Saito, Isogai 2004) Polyelectrolyte (PE) titration (Junka et al. 2013) Zeta –potential (Eronen et al. 2012) X-ray photoelectron spectroscopy (XPS) (Johansson et al. 2011) Fourier Transform Infrared Spectroscopy (FT-IR) (Saito et al. 2006) Strength properties of cellulose films
133
Special Issue: NANOCELLULOSE Nordic Pulp & Paper Research Journal Vol 29 no (1) 2014
mixing was 6 mm, the power 200 W, the frequency 20 kHz and the amplitude 50% of the maximum. The conditions of ultrasound mixing had been tested previously and adjusted so that no further defibrillation or aggregation took place during mixing. Temperature of the samples was adjusted to 20±1°C. The shear viscosity was measured at 300 measuring points at 0.5 rpm, 5 rpm and 10 rpm, as well as at 100 measuring points at 50 rpm and 100 rpm. The relative viscosities were measured twice for each sample. Light mixing was performed between the measurements. The torque during the measurements was kept between 10 and 100%.
Materials and Methods Fibrillated celluloses Five fibrillated celluloses with different degrees of fibrillation were chosen and characterized with selected analysis methods. Commercial fibrillated cellulose Daicel Celish KY-100G was purchased from Daicel Fine Chemicals, Tokyo, Japan. The dry matter content of the delivered material was around 10%.The sample will be referred to as Daicel in the text. Two pre-commercial fibrillated cellulose samples manufactured at pilot scale were obtained from the manufacturers. Both samples had dry matter contents around 2.5% and will be referred to as pilot 1 (P1) and pilot 2 (P2) in the text. The VTT grades were manufactured by an ultra-fine friction grinder (Masuko Supermasscolloider) from once-dried bleached hardwood kraft pulp with the rotation speed of 1500 rpm. The grades were ground to different coarseness levels by varying the number of passes of the material through the grinder. The less ground sample passed through the grinder three times and will be referred to as VTT coarse. The more ground sample passed though the grinder eight times and was named as VTT fine in the text. The dry matter content of these materials was around 3%.
Transmittance measurements Transmittance was measured by Perkin Elmer Lambda 900 UV-VIS spectrophotometer at 0.1% sample consistency. The samples were well dispersed into MilliQ water before testing with propel mixer for 10 minutes at 300 rpm and then with ultrasound mixing for one minute. Otherwise the conditions in the ultrasound mixing were similar than prior to the viscosity measurements. Samples were analysed immediately after dispersing so that no flocculation or sedimentation would take place. The transmittance was measured at wavelengths between 200 and 800 nm. A transmission measurement combined with a settling/sedimentation rate measurement was made with TurbiScan LAB Expert (Formulaction, France) which measures the specific volume of sedimentation at a certain time frequency with both transmittance and backscatter detectors. Measurements were carried out at 0.1% concentration for 5 h 9 min. Before the measurements, the samples were dispersed in a similar fashion as described for the transmittance measurements. The height of the sediment of the samples was estimated from the X-axis where the transmission and backscattering curves drop and the transmittance of the sediment was estimated from the Y-axis of transmission curve.
Characterization methods Optical microscopy Before imaging of fibrillated cellulose samples they were dyed with 1% Congo red solution by mixing fibrillated cellulose and dye in a ratio of 1:1 and further diluting the dyed mixture on the microscope slide (2:1). Optical microscopy was performed with Olympus BX 61 microscope equipped with WH10X-H eyepieces, fluorite objectives and ColorView 12 camera. Scanning Electron microscopy The fibrillated cellulose samples were prepared for analysis by solvent exchange with t-butylalcohol. First the samples were treated with 40% t-butylalcohol for 5 min, followed by 100% t-butylalcohol for 5 min. A drop of the sample was pipetted to an aluminium surface and frozen in a freezer (-26°C for a minimum of 30 min). The sample was then transferred to pre-cooled freeze dryer and dried overnight at -60°C and 200 mbar. Prior to imaging, the samples were coated with Pt/Pd using Agar High Resolution Sputter Coater. Three layers were applied, resulting in total thickness of around 6 nm. The imaging was done with Philips XL 30 Feg FE-SEM from Oxford Instruments.
Fractional analysis Fractional analysis of the fibrillated celluloses was performed with MicroFracon device (Metso Automation, Finland) employing a tube flow fractionation principle (Laitinen et al. 2011). The samples were dispersed into water using an Ultra-Turrex mixer at 8000 rpm for 10s. A sample of 5 ml, at a consistency of 0.1%, was fractionated with deionised water acting as the eluent at a flow rate of 7.7 ml/s in a long plastic tube, in order to separate the particles according to their sizes, primarily by the longest dimension of the particles. Four different size categories (fractions) were obtained by taking the samples after separation of specific fractionation time of 100 seconds, resulting in a set of samples classified as FR1 (the largest particles), FR2, FR3 and FR4 (the smallest particles) (Haapala et al. 2013). The amount of material in the different size categories was measured in the presence of a flocculent (cationic polyacrylamide, CPAM) by filtration on a membrane (Ø=0.1 µm), which was followed by precision weighing. The material balances of the four fractions were followed to ensure the retention of the fractions on the membrane.
Shear viscosity measurements The shear viscosities of dilute fibrillated cellulose samples were measured by Brookfield rheometer model RVDV-III Ultra using vane type spindles. The measurements were performed at 1.5% consistency. Vane spindle V-73 was used for the measurements of VTT coarse and fine, Daicel and P2, while sample P1 was measured with vane spindle V-72 due to its less viscous nature. Samples were first mixed with propel mixer for 10 min at 700-800 rpm and then with ultrasound mixing with Branson 102C for two minutes. The tip used in the 134
Special Issue: NANOCELLULOSE Nordic Pulp & Paper Research Journal Vol 29 no (1) 2014
Results
Table 2 - Number of particles analysed from fractions FR1-FR3 by image analysis during tube flow fractionation. Daicel VTT Coarse VTT Fine P1 P2
FR1, % 14 467 15 327 701 47 293 22 636
FR2, % 66 942 64 415 30 998 1 287 4 595
Morphology and evaluation of particle size
FR3, % 5 892 1 891 7 546 24 177
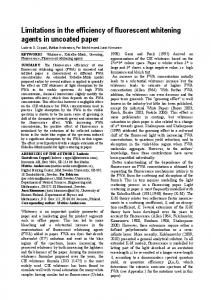
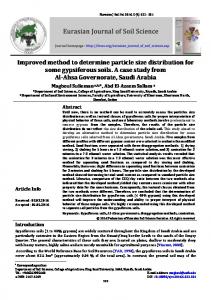
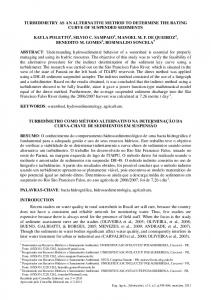
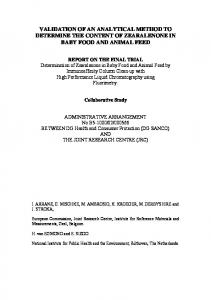
Microscopy Optical microscopy provided a fast method for the visualization of the fibrillated cellulose samples, enabling the assessment of the appearance, the type of cellulose fibrils and their macrostructure. Based on the images, the degree of fibrillation and the amount of un-fibrillated fibres and fibre fragments were evaluated (Fig 1). The commercial fibrillated cellulose sample consisted of long fibrils with small diameter but some un-fibrillated fibre fragments and larger fibril aggregates could also be seen (Fig 1a).The images taken from the VTT samples clearly showed the effect of increased refining energy to the sample homogeneity and fibril size. In the coarse VTT sample (Fig 1b), some unrefined fibres still remained, while with more passes through the grinder, the unrefined fibres were no longer observed (Fig 1c). The two pilot samples were relatively coarse and heterogeneous, containing large fibre fragments as well as fibrous particles with small dimensions (Fig. 1d and e). The resolution of optical microscopy performed in this work was around 1 µm, and therefore nano-scale fibrils were not detected. Optical microscopy thus gave information on the sample homogeneity on micro-scale. The scanning electron microscopy (SEM) images were used to assess the structural and dimensional appearance of the fibrillated celluloses (Fig 2). The images showed that the studied samples had different fibrillar morphologies when they underwent the used sample preparation. The samples P1and P2 formed porous and bulky fibrillar networks, whereas the rest of the samples formed more even layer of fibrils. The tendency for film formation could be related to the finer fibrillar structure as well as to the water removal properties.
The particles in the fractionated particle-water suspension were visualised with a CCD camera with a resolution of 1.6 µm, with a sub-pixel algorithm delivering, in practice, optical image analysis measurement sensitivity around 1 µm. The imaged area in the analysis was 2200 μm x 1700 μm (Laitinen, Niinimäki 2014). The average dimensions of the particles, i.e. the longest dimensions (LD) and the shortest dimensions (SD), were obtained from the fractionation images by optical image analysis. The average dimensions of fractions FR1-FR3 could be evaluated by the on-line image analysis, while the sensitivity was not sufficient for measuring the particles in the smallest fraction FR4. The number of particles analysed from the different fractions for each of the samples are presented in Table 2. Ultracentrifugation The content of nano-sized material was defined gravimetrically by ultracentrifugation for 20min, 45min and 2h with Eppendorf 5804R centrifuge at 10000 g based on a method described by Ahola et al. (2008). The samples were first mixed with ultrasonication with otherwise similar conditions as prior to viscosity and transmittance measurements, but for the amplitude and time, which were 25% of the maximum and 10 minutes, respectively. The amount of nano-sized material was measured by determining the solids content of the supernatant and calculating its relative amount in relation to the solids content of the whole sample. The measurements were carried out in duplicate.
Fig 1 - Optical microscopy images of five fibrillated cellulose samples a) Daicel, b) VTT coarse, c) VTT fine, d) P1 and e) P2. The scale bar is 200 µm. 135
Special Issue: NANOCELLULOSE Nordic Pulp & Paper Research Journal Vol 29 no (1) 2014
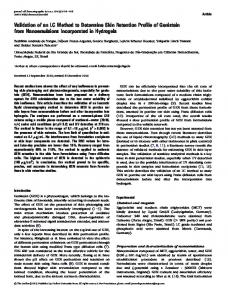
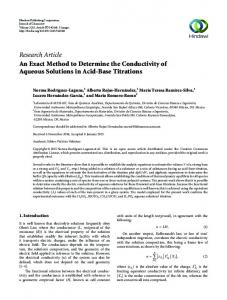
Fig 2 - Scanning electron microscope images of the fibrillated cellulose samples a) Daicel, b) VTT coarse, c) VTT fine, d) P1 and e) P2. Scale bar is 1 µm. and smaller particle size compared to the other samples. The result is supported by the appearance of the different samples, as assessed by optical microscopy (Fig 1). The low transmittance value of Daicel is a slightly surprising result, since based on the visual evaluation the sample consisted mostly of slender fibrils and very few coarse particles were observed. Possibly the result was due to the length of the fibrils or their tendency to agglomerate. Another possible explanation is that the sample contained a high amount of medium-sized fibrils the size of which was close to the wavelength of light, thus increasing the scattering of light and decreasing its transmission. The transmittances of samples VTT coarse, P1 and P2 were rather similar, thus indicating similar particle size. However, according to the OM images, samples P1 and Fig 3 - Transmittances of fibrillated cellulose samples at P2 contained much more large fibre fragments than VTT wavelengths 200-800 nm. coarse. The reason for the similar transmittance values Transmittance measurements for these three samples could be that they contain similar Light transmittance of nanocellulose suspensions is amounts of medium sized fibrils. influenced by many factors, particle size being the main Transmittance measurements were also performed with one, but particle shape, concentration, colour and the Turbiscan Lab Expert apparatus, which gave additional difference between refractive indexes of the particle and information about the sedimentation behaviour and the sample fluid also playing a role. Regarding suspension stability of the samples. In Fig 4, the change nanocelluloses, it is known that small-sized colloidal in the height of the sediment of fibrillated cellulose particles such as cellulose nanocrystals form a suspension suspension, ΔH, is presented as a function of time. The that is transparent or glaze, whereas individual nanofibrils steeper the curve, the faster is the sedimentation and thus such as those prepared by chemi-mechanical treatments the less stable is the suspension of fibrillated cellulose. can be either transparent or have a slight colour shade. The stability of the fibrillated cellulose suspensions thus CMF suspensions, however, are white or opaque, decreased in the order VTT fine > VTT coarse > Daicel > indicating that they consist of larger particles than the P1 > P2. VTT fine with the finest structure and the other nanocellulose types do. smallest particle size thus formed the most stable In theory, different types of nanocellulose samples can suspension, while visually the most heterogeneous thus be distinguished with transmittance measurements. samples P1 and P2 had the lowest stability. Generally, finer materials have higher transmittance than coarse materials. However, transmittance is known to be Fractional analysis Tube flow fractionation of the fibrillated celluloses sensitive towards larger particles in the sample. For our resulted in four size fractions, FR1, FR2, FR3 and FR4. fibrillated celluloses, the largest difference in transmittance was observed at 800 nm (Fig 3). VTT fine had the highest transmittance, indicating finer structure 136
Special Issue: NANOCELLULOSE Nordic Pulp & Paper Research Journal Vol 29 no (1) 2014
Fig 5 - Low shear viscosities of fibrillated cellulose samples.
Fig 4 - Change in the height of sediment of fibrillated cellulose suspension measured with Turbiscan. In theory, FR1 contained the largest particles and FR4 the smallest particles. The averages of the longest and shortest dimension, i.e. length and width, respectively, of the fibrils in fractions FR1-FR3 are presented in Table 3 along with their 95% confidence levels. Both the dimensions decreased when moving from fraction FR1 to FR3, confirming that the fractionator worked as expected in separating the particles. Daicel and P2 were found to contain fibres with the largest dimensions, which is supported by the optical microscopy images (Fig 1). The dimensions of fractions from VTT coarse, VTT fine and P1 were rather close to each other. Based on the OM images, one would expect larger dimensions for P1. The reason for this result could be that the number of very large fibres was small in P1, and the number of fibres with smaller dimensions contributed more to the average dimensions. Due to the limited resolution of the image analysis, dimensional information could only be obtained of the micro-scale cellulose fibrils, and nano-scale fibrils remained undetected.
increase in the number of particles and increase in fibrilfibril interactions, leading to more internal friction within the suspension. However, in the case of fibrillated celluloses, the size, the aspect ratio and the amount of fibrils are also known to affect the viscosity, and the decrease in the aspect ratio due to cutting of fibres with increasing fibrillation degree may have an opposite effect on viscosity. Of the studied samples, VTT coarse and fine as well as Daicel clearly had higher viscosities than the two pilot samples, P1 and P2 (Fig 5). VTT coarse, VTT fine and Daicel had a finer structure and more homogeneous network structure (Fig 1, Fig 2), which caused the notable increase in the apparent viscosity. Previously, it has been shown that microfibrillated celluloses with different number of grinding passes can be distinguished (Sneck et al. 2011). However, this was not observed for our two samples with different grinding passes, namely VTT coarse and fine, which had almost identical viscosities (Fig 5). This is probably due to the differences in the size and shape of cellulose fibrils in VTT coarse and VTT fine. In VTT coarse, the fibrils have a branched structure and high aspect ratio, thus forming a very strong network structure, which increases the viscosity of the dispersion. As the grinding proceeds, the fibrils start to get cut, leading to a decreased aspect ratio and thus a lowered viscosity. The network structure can then become weaker and lose some of its elasticity under high shear and compression and consequently, the internal resistance to flow decreases.
Rheological properties of fibrillated cellulose suspensions In this work, the rheology of the fibrillated cellulose suspensions was measured at low shear using a spindle with vane geometry, which is widely accepted as a convenient way of testing viscous, polydisperse materials. The method is particularly advantageous for testing samples that are significantly heterogeneous or that could slip when tested with conventional, smooth spindle geometries such as plate or coaxial cylinder. Viscosity describes the suspension's internal resistance to flow. For fibrillated celluloses, the viscosity generally increases with increased fibrillation degree due to decreased particle size. Smaller particle size means an
Fractional studies Tube flow fractionation The mass percentages of the four fractions obtained by tube flow fractionation are shown in Table 4. The results show that the VTT fine was indeed the most fibrillated
Table 3 - Average dimensions (micro-scale) of fractions FR1-FR3 obtained by image analysis during tube flow fractionation.
Daicel VTT Coarse VTT Fine P1 P2
FR1 length, µm 141 ± 13
FR2 length, µm 55 ± 5
FR3 length, µm 20 ± 2
FR1 width, µm 4.45 ± 0.4
FR2 width, µm 2.08 ± 0.2
FR3 width, µm 1.45 ± 0.1
34 ± 3 49 ± 4 41 ± 4 178 ± 16
19 ± 2 12 ± 1 22 ± 2 17 ± 2
11 ± 1 9±1 NA 8±1
2.20 ± 0.2 2.68 ± 0.2 2.99 ± 0.3 4.52 ± 0.4
1.49 ± 0.1 1.24 ± 0.1 1.65 ± 0.1 1.67 ± 0.1
1.32 ± 0.1 1.06 ± 0.1 NA 1.24 ± 0.1
NA=not analysed due to low amount of particles. 137
Special Issue: NANOCELLULOSE Nordic Pulp & Paper Research Journal Vol 29 no (1) 2014
Table 4 - Mass percentages of four fractions of fibrillated cellulose samples obtained by tube flow fractionation. Daicel VTT Coarse VTT Fine P1 P2
FR1, % 31.4 27.0 1.8 46.0 57.2
FR2, % 53.6 59.7 63.8 50.9 23.2
FR3, % 13.7 9.8 29.7 3.2 14.9
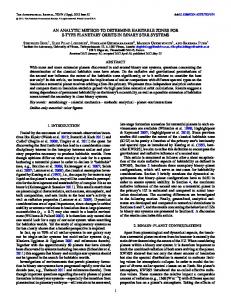
samples Daicel, VTT coarse and VTT fine. Taipale et al. (2010) reported a value of 3% for the nano-sized material in their fibrillated cellulose prepared by grinding. Compared to the proportion of FR4 in the samples, obtained by the fractional analysis (Table 4), ultracentrifugation gave slightly higher amounts for the content of nano-sized materials, yet the order of samples in terms of amount of nano-sized material and the amount of FR4 were the same. However, for the pilot samples P1 and P2 the amount of nano-sized material given by ultracentrifugation was surprisingly high given the properties of the samples as analysed with other characterisation methods. One possible explanation for the result could be that changes were induced to the samples by the ultrasonification pretreatment. The treatment was relatively intensive for such a dilute sample (1.7 g/l) containing unravelled fibres and fibre fragments, and lasted much longer compared to the ultrasonication performed prior to viscosity and transmittance measurement. It is possible that during the treatment, some kind of peeling off could have happened and fine fibrillar material became detached from the fibre surfaces. However, we have no further proof of that taking place. Another possible explanation is that the samples P1 and P2 contained very narrow and long fibrils that were not detected by any other characterization methods besides ultracentrifugation. This is supported by the fact that the majority of the particles in the fractions FR2 and FR3 of P1 and fraction FR3 of P2 were not detected by the image analysis, indicating that their dimensions were below 1 μm. In addition, as the sedimentation studies showed (Fig 4), the sedimentation of the samples P1 and P2 in suspension was faster than that of the other samples, which were relatively fine and more homogeneous. In our experience, fine fibrillated celluloses form stable gel-like sediments, which retain the fibrils inside the structure, whereas coarse samples have a more loose structure. The removal of fibrils from the loose structure during centrifugation is easier and therefore, the possibility of having fine material also in the supernatant more probable. The result of higher content of nano-sized fibrils in samples P1 and P2 were supported by the SEM images taken from the supernatants (Fig 6). These images showed the relatively long and thin fibrils that were present in the samples after centrifuging.
FR4, % 1.3 3.5 4.8 0.0 4.7
Table 5 - The proportions of nano-sized material in fibrillated cellulose samples measured by ultracentrifugation.
Daicel VTT Coarse VTT Fine P1 P2
20 min., % 0 5.2
STDEV
STDEV
0 0.8
45 min., % 2.6 5.6
STDEV
3.7 1.9
120 min., % 2.6 2.7
6.5
0.9
6.9
0.5
2.3
0.3
48.8 24.3
3.7 2.4
50.7 20
0.1 0.1
47.1 21.2
1.6 2.9
3.1 0.4
into small particles, since the proportion of the largest fraction was very small and especially the content of fraction FR3 was high compared to the other fibrillated celluloses. This result is supported by the optical microscopy images and the transmittance values (Fig 1, Fig 3). Based on the mass percentages, P1 was very coarse compared to the other fibrillated celluloses, containing only a small amount of the finest fractions FR3 and FR4. However, when the number of particles from fractions FR2 and FR3 detected by image analysis (Table 2) were compared to the mass percentages of these fractions, it could be seen that both fractions contained particles that were not detected by the image analysis, i.e. particles that had dimensions under μm. The particles were probably long and narrow; because of their length they were retained in the coarser fractions but due to their width they were not optically detected. Similar result can be seen for the fraction FR3 of sample P2: very few particles were detected by image analysis but the mass percentage of this fraction was quite significant. Otherwise, this sample was quite coarse, containing the highest proportion of the largest fraction FR1. However, the content of the smallest fraction FR4 was also high. Ultracentrifugation The proportions of nano-sized material in the fibrillated cellulose samples, calculated from the solids content in the upper phase after centrifugation for different time intervals, are presented in Table 5. The results were shown to depend on the centrifugation time. 120 min was clearly too long time for this type of material, since some of the fibrils had obviously moved from the supernatant back to the sediment, as indicated by the decrease in the amount between 45 min and 120 min centrifugation time for VTT coarse. Both Ahola et al. (2008) and Taipale et al. (2010) used 45 minutes centrifugation time for this type of fibrillated cellulose, and our results also showed that this was probably the best centrifugation time. The amount of nano-sized material given by ultracentrifugation for 45 minutes seemed reasonable for
Discussion In this work, several characterization methods were used to analyse the most important basic properties of fibrillated celluloses prepared by mechanical treatments, and the results obtained as well as the importance of each characterization method are further discussed here. The summary of the characterization results obtained in this work is shown in Table 5. The different measurements gave results pointing to the same direction for most of the samples. For example, VTT fine was estimated to have the finest structure by optical microscopy and this was supported by its highest transmittance value. In addition, the content of small fibrils was high in the sample, as evaluated by fractional 138
Special Issue: NANOCELLULOSE Nordic Pulp & Paper Research Journal Vol 29 no (1) 2014
Fig 6 - Scanning electron microscope images of the supernatants fractionated from a) P1 and b) P2. Scale bar is 200nm. Table 5 - Summary of basic properties of fibrillated cellulose samples. Visual appearance (OM, SEM)
Shear viscosity, mPa·s (10 rpm, 1.5%) Transmittance, % (800 nm, 0.1%) Content of smallest fraction (FR4), % Content of nanosized fraction, %
Daicel Coarse, long slender fibrils Heterogeneous Film-like fibril network
VTT Fine Fine Homogeneous Film-like fibril network
P1 Coarse, large fragments Heterogeneous Porous and bulky fibril network
P2 Coarse, unfibrillated fibres Heterogeneous Porous and bulky fibril network
15 777
VTT Coarse Coarse/fine, few large fragments Slightly heterogeneous Film-like fibril network 23 176
22 502
2 784
3 654
8
34
60
25
26
1.3
3.5
4.8
0
4.7
2.6
5.6
6.9
50.7
20
analysis and ultracentrifugation. However, the shear viscosity was on the similar level than that of a much coarser sample, VTT coarse. In this case the shear viscosity measurement alone would not be enough to distinguish the two samples. For some samples, such as P1, the interpretation of the results was not as straightforward, especially considering the amount of nanomaterial in the sample. The examples provided above clearly show that for materials like fibrillated cellulose, the phenomena behind their behaviour are complex. Therefore, any single characterisation method cannot be used to describe the properties and behaviour. Instead, a combination of characterization methods based on different measuring principles must be applied. During this work, the comparison of our results to those previously published proved to be difficult due to the numerous different characterization techniques employed for the fibrillated celluloses prepared in many different ways. The field would thus greatly benefit if some consensus could be reached regarding the used characterization methods. When considering the results presented in Table 5, we found that a combination of optical and electron microscopy, shear viscosity and transmittance gave us a fairly good estimate of the basic sample characteristics of mechanically fibrillated celluloses. When combined,
these measurement methods provide us with information on the macro- and micro-scale homogeneity of the samples, dimensional and structural appearance, particle size distribution and rheological properties. With these selected characterization methods, the differences in the sample characteristics could be revealed and their influence on behaviour assessed. In our opinion, these methods can form a basis for the characterization of chemically unmodified, mechanically prepared fibrillated celluloses, to which complementary advanced information based on specific requirements would be obtainable with the other characterization methods listed in Table 1. Microscopic imaging is very important for the characterization of fibrillated cellulose, as it is a direct method for obtaining information of them. Optical microscopy can be used to get an overview of the appearance and macro/micro-scale homogeneity of the fibrillated cellulose sample, while electron microscopy reveals detailed information about the fibril morphology. Electron microscopy (SEM or TEM) is a rather fast method to get an overview of the fibril structure and size. However, quantitative analysis of fibril dimensions needs a more comprehensive study with high resolution methods, such as TEM and AFM, thus making it time consuming. Furthermore, because of the rather small field 139
Special Issue: NANOCELLULOSE Nordic Pulp & Paper Research Journal Vol 29 no (1) 2014
of view many images have to be analysed to get an accurate statistical analysis. High-resolution microscopic techniques also suffer from some degree of subjectivity, since often the areas containing the most nano-scale fibrils are preferably assessed and micrometer scale fibrils and fibres are excluded from the analysis. In the case of fibrillated celluloses, sample preparation is an important consideration and the choice of the used method depends on the fibril property of interest. The analysis of fibril size requires distinguishing individual fibrils, which can be achieved by using a very low consistency for the formation of sparse layer of fibrils (Pääkkö et al. 2007). With the help of spin coating device fibrils can be cast sparsely on the substrate (Ahola et al. 2008). The drying method of the samples is also critical. Air drying and slow freeze drying tend to cause film formation of fibrils. Critical point drying (CPD) preserves the fibrils close to the state in which they are in the water suspension and the fibrils thus appear as individual objects which are easy to detect. However, this method is the most time consuming. The low shear viscosity measurement is relatively fast and easy to perform and provides good accuracy for routine characterisation of fibrillated celluloses, and when combined with other measurements, also for quality control purposes. Although the method does not use absolute shear rate values, it is useful for analysing rheologically complex materials and similar fibrillated cellulose grades with a fairly good repeatability. Therefore it is essential to focus on sample preparation and hydration process when diluting the samples for the fixed concentration. Samples with a different initial dry matter content need not only intensive mixing, but also some time to stand undisturbed in order to regain their initial viscosity and to remove most of the air bubbles possibly generated by mixing. The benefits of this method also include the fact that the particles can be kept in the suspension during the testing cycle and only minimal disruption of the sample during measurement is expected. However, the problem of sedimentation usually appears when the sample is measured below its gel point. The possible slippage during the measurement can be avoided when using the recommended vane geometry. Already the visual inspection of fibrillated cellulose gels or their dilute suspensions can give an impression of their particle size; the finer the material, the more transparent it becomes. Therefore, transmittance measurements can be used as an indirect and indicative method for measuring the size of the fibrils. Transmittance is a secondary property which correlates with the magnitude or number of coarse particles. In fibrillated celluloses, transmittance is sensitive towards larger particles, such as un-fibrillated fibres or fibre fragments. In addition, fibrillated celluloses are prone to flocculation, which can be seen as lowered transmittance. Transmittance measurements as a function of time give information of the stability of fibrillated celluloses in suspension. Transmittance of particles is a complex phenomenon with many factors known to affect the results. For this reason, the interpretation of the results is difficult, especially in the case of fibrillated celluloses, and cannot be done solely
based on this method but together with other measurements such as optical microscopy. In addition to these methods, both fractional analysis and ultracentrifugation can be used to give an estimate of the amount of nano-sized material among the fibrillated cellulose samples. However, currently it is not known exactly how accurate the numerical results given by these two methods are. Tube flow fractionation offers an interesting novel method to study the amount and dimensions of nanomaterial in the fibrillated cellulose samples, but due to the limited resolution of the image analysis, it provides only micro-scale dimensional information, and the smallest fraction obtained cannot be studied except with high-resolution microscopy. Therefore, method development is needed before the method can be used to unambiguously determine the amount of nano-sized material. However, already today the method is very useful in separating the fibrils into different size fractions, which may then be utilized further, for example in safety testing, or characterized by microscopy. Similarly, ultracentrifugation can give us a numerical value for the content of nanomaterial in the fibrillated cellulose sample. However, it was shown in this work that the result is dependent on the centrifugation time as well as on the sample type. For fibrillated celluloses, part of the nano-sized fibrils may still be attached to the larger fibrils, fibril aggregates or to fibres fibrillated to different extents, and thus will not be measured as part of the nano-sized materials with methods like these. On the other hand, as our results showed, the sample preparation may affect samples in a different way, thus influencing the results. Deeper understanding of the method should thus be gained before routine analysis can be recommended.
Conclusions Fibrillated celluloses are novel bio based materials, the unique properties of which make them potential for numerous applications. The material properties of fibrillated celluloses must be well known before commercial utilization is possible, making establishment of proper characterization methods essential. The methods must be such that comparison of different grades can be accomplished and preferably, the methods can be standardized. The characterization of the material’s physical and chemical properties must meet the requirements needed for its safety assessment. In addition, characterization is needed to enable the commercial trade of the material. From the literature review it can be concluded that in order to obtain an extensive view on the important properties of fibrillated celluloses, a combination of characterization methods is truly needed. In this work, a systematic study was performed on the basic material properties of five mechanically manufactured, chemically un-modified fibrillated celluloses. As an outcome, a set of methods, including microscopic evaluation by optical and high resolution microscopes as well as low shear viscosity and transmittance measurements, was identified for effective basic characterization of these fibrillated celluloses. 140
Special Issue: NANOCELLULOSE Nordic Pulp & Paper Research Journal Vol 29 no (1) 2014
evaluated by atomic force microscopy, Composites: Part A 40, 583. Cheng, Q., Wang, S., Rials, T.G. and Lee, S.-H. (2007): Physical and mechanical properties of polyvinyl alcohol and polypropylene composite materials reinforced with fibril aggregates isolated from regenerated cellulose fibres, Cellulose 14, 593 Chinga-Carrasco, G. (2013): Optical methods for the quantification of the fibrillation degree of bleached MFC materials, Micron 48, 42. Chinga-Carrasco, G. and Syverud, K. (2010): Computerassisted quantification of the multi-scale films made of nanofibrillated cellulose, J. Nanopart. Res. 12(3), 841. Dufresne, A. (2012): Nanocellulose, Walter de Gruyter Gmbh, Berlin, 43-75. Eronen, P., Laine, J., Ruokolainen, J. and Österberg, M. (2012): Comparison of multilayer formation between different cellulose nanofibrils and cationic polymers, J. Colloid Interface Sci. 373, 84. European Commission (2011): Commission Recommendation of 18 October 2011 on the definition of nanomaterial. http://eurlex.europa.eu/LexUriServ/LexUriServ.do?uri=CELEX:32011H06 96:EN:NOT Accessed 28 January 2013. Fukuzumi, H., Saito, T., Iwata, T., Kumamoto, Y. and Isogai, A. (2009): Transparent and high gas barrier films of cellulose nanofibers prepared by TEMPO-mediated oxidation, Biomacromolecules 10(1), 162. Garvey, C.J., Parker, I.H. and Simon, G.P. (2005): On the interpretation of X-ray diffraction powder patterns in terms of the nanostructure of cellulose I fibres, Macromolecular Chem Phys 206(15), 1568. Goldstein, J.I., Newbury, D.E., Echlin, P., Joy, D.C., Romig, Jr., A.D., Lyman, C.E., Fiori, C. and Lifshin, E. (1992): Scanning electron microscopy and X-ray microanalysis. A text for biologists, material scientists, and geologists, 2nd ed, Plenum Press, New York. Haapala, A.T., Laitinen, O., Karinkanta, P., Liimatainen, H. and Niinimäki, J. (2013): Optical characterization of of size, shape and fibrillarity from microfibrillar and microcrystalline cellulose, and fine ground wood powder fractions, Appita J. 66(4), 331. Henriksson, M., Berglund, L.A., Isaksson, P., Lindström, T. and Nishino, T. (2008): Cellulose nanopaper structures of high toughness., Biomacromolecules 9(6), 1579. Henriksson, M., Henriksson, G., Berglund, L.-A. and Lindström T. (2007): An environmentally friendly method for enzyme-assisted preparation of microfibrillated cellulose (MFC) nanofibers, Eur. Polymer J. 43, 3434. Herrick, F.W., Casebier, R.L., Hamilton, J.K. and Sandberg, K.R. (1983): Microfibrillated cellulose: morphology and accessibility, J. Appl. Polym. Sci.: Appl. Polym. Symp. 37, 797. Iotti, M., Gregersen, O.W., Moe, S. and Lenes, M. (2011): Rheological studies of microfibrillar cellulose water dispersions, J. Polym. Environ. 19, 137. Isogai, T., Saito, T. and Isogai, A. (2011): Wood cellulose nanofibrils prepared by TEMPO electro-mediated oxidation, Cellulose 18, 421.
Microscopic analysis is a valuable tool for assessing the homogeneity and general appearance of the samples, as well as obtaining direct information about the dimensions of the cellulose fibrils when using the methods with high resolution. Microscopic evaluation should always be part of any characterization performed for fibrillated celluloses. When combined with other measurements, the apparent viscosity measurement can be used as a fast method for quality control as well as evaluating the rheological properties of the fibrillated cellulose gels, whereas indirect evaluation of the materials particle size can be obtained with transmittance values. A characterization package containing these methods can thus be recommended for basic characterization of chemically un-modified fibrillated celluloses. The information obtained with this combination of methods could be used for material specification purposes when trading fibrillated celluloses. Acknowledgements The authors would like to thank Seppo Kuosmanen for grinding the VTT’s samples. Ulla Salonen, Katja Pettersson and Vuokko Liukkonen are thanked for the preparation of the samples and performing the viscosity measurements and ultracentrifugation studies. The research leading to these results was performed as part of the “Efficient Networking towards Novel Products and Processes” (EffNet) research programme of Finnish Bioeconomy Cluster (FIBIC). The EffNet programme has received funding from Tekes – the Finnish Funding Agency for Technology and Innovation and Forestcluster Ltd. Literature Abe, K., Iwamoto, S. and Yano, H. (2007): Obtaining cellulose nanofibers with a uniform width of 15 nm from wood, Biomacromolecules 8, 3276. Abe, K. and Yano, H. (2010): Comparison of the characteristics of cellulose microfibril aggregates isolated from fiber and parenchyma cells of Moso bamboo (Phyllostachys pubescens), Cellulose 17, 271. Ahola, S., Salmi, J., Johansson, L.-S., Laine, J. and Österberg, M. (2008): Model films from native cellulose nanofibrils. Preparation, swelling, and surface interactions, Biomacromolecules 9,1273. Aulin, C., Netrval, J., Wågberg, L. and Lindström, T. (2010): Aerogels from nanofibrillated cellulose with tunable oleophobicity, Soft Matter 6, 3298. Chakraborthy, A., Sain, M. and Kortschot, M. (2005): Cellulose microfibrils: A novel method of preparation using high shear refining and cryocrushing, Holzforschung 59, 102. Charani, P.R., Dehghani-Firouzabadi, M., Afra, E. and Shakeri, A. (2013): Rheological characterization of high concentrated MFC gel from kenaf unbleached pulp, Cellulose 20, 727. Cheng, Q., Wang, S. and Han, Q. (2010): Novel process for isolating fibrils from cellulose fibers by high-intensity ultrasonication. II. Fibril characterization, J. Appl. Polym. Sci. 115(5), 2756. Cheng, Q., Wang, S. and Harper, D.P. (2009): Effects of process and source on elastic modulus of single cellulose fibrils
141
Special Issue: NANOCELLULOSE Nordic Pulp & Paper Research Journal Vol 29 no (1) 2014
Iwamoto, S., Nakagaito, A.N. and Yano, H. (2007): Nanofibrillation of pulp fibers for the processing of transparent nanocomposites, Appl. Phys. A 89, 461. Iwamoto, S., Abe, K. and Yano, H. (2008): The effect of hemicelluloses on wood pulp nanofibrillation and nanofiber network characteristics, Biomacromolecules 9, 1022. Iwamoto, S., Kai, W., Isogai, A. and Iwata, T. (2009):Elastic modulus of single cellulose microfibrils from tunicate measured by atomic force microscopy, Biomacromolecules 10, 2571. Johansson, L.-S., Tammelin, T., Campbell, J.M., Setälä, H. and Österberg, M. (2011): Experimental evidence on medium driven cellulose surface adaptation demonstrated using nanofibrillated cellulose, Soft Matter 7, 10917. Jonoobi, M., Harun, J., Shakeri, A., Misra, M. and Oksman, K. (2009): Chemical composition, crystallinity and thermal degradation of bleached and unbleached Kenaf Bast (Hibiscus cannabinus) pulp and nanofibers, Bioresources 4, 626. Josefsson, G., Tanem, B.S., Li, Y., Vullum, P.E. and Gamstedt, E.K. (2013): Prediction of elastic properties of nanofibrillated cellulose from micromechanical modeling and nano-structure characterization by transmission electron microscopy, Cellulose 20, 761. Junka, K., Filpponen, I. Lindström, T. and Laine, J. (2013): Titrimetric methods for the determination of surface and total charge of functionalized nanofibrillated/microfibrillated cellulose (NFC/MFC), Cellulose 20, 2887. Karppinen, A., Saarinen, T., Salmela, J., Laukkanen, A., Nuopponen, M. and Seppälä, J. (2012): Flocculation of microfibrillated cellulose in shear flow, Cellulose 19, 1807. Kaushik, A. and Singh, M. (2011): Isolation and characterization of cellulose nanofibrils from wheat straw using steam explosion coupled with high shear homogenization, Carbohydrate Res. 346, 76. Klemm, D., Kramer, F., Moritz, S., Lindström, T., Ankerfors, M., Gray, D. and Dorris, A. (2011): Nanocelluloses: a new family of nature-based materials. Angew. Chem. Int. Ed. 50, 5438. Korhonen, J.T., Hiekkataipale, P., Malm, J., Karppinen, M., Ikkala, O. and Ras, R.H.A. (2011): Inorganic hollow nanotube aerogels by atomic layer deposition onto native nanocellulose templates , ACS Nano 5(3), 1967. Laitinen, O.T., Kemppainen, K., Stoor, T. and Niinimäki, J. (2011): Fractionation of pulp and paper particles selectively by size, Bioresources 6, 672. Laitinen, O. and Niinimäki, J. (2014): Fractional Study of the Microfibrillated Cellulose, Tappi J., in press. Lasseuguette, E., Roux, D. and Nishiyama, Y. (2008): Rheological properties of microfibrillar suspension of TEMPOoxidised pulp, Cellulose 15, 425. Lavoine, N., Desloges, I., Dufresne, A. and Bras, J. (2012): Microfibrillated cellulose - Its barrier properties and applications in cellulosic materials: a review, Carbohydrate Polym. 90, 735. Leppänen, K., Pirkkalainen, K., Penttilä, P., Sievänen, J., Kotelnikova, N. and Serimaa R. (2010): Small-angle x-ray scattering study on the structure of microcrystalline and nanofibrillated cellulose, J. Phys.: Conf. Ser. 247, 012030. Liebner, F., Potthast, A., Rosenau, T., Haimer, E., and Wendland, M. (2008): Cellulose aerogels: Highly porous, ultralightweight materials, Holzforschung 62, 129.
Linsinger, T., Roebben, T., Gilliland, D., Galzolai, L., Rossi, F., Gibson, N. and Klein, C. (2012): Requirements on measurements for the implementation of the European Commission definition of the term "nanomaterial". JRC Reference Reports, European Commission, Joint Research Centre (JRC), Institute for Reference Materials and Measurements, Brussels, Belgium. Lowys, M.-P., Desbrieres, J. and Rinaudo, M. (2001): Rheological characterization of cellulosic microfibril suspensions. Role of polymeric additives, Food Hydrocolloids 15, 25. Michler, G.H. (2008): Electron microscopy of polymers, Springer Laboratory, Leipzig. Moon, R.J., Pöhler, T. and Tammelin, T. (2014): Microscopic characterization of nanofibers and nanocrystals, In: Oksman, K., Mathew, A.P., Bismarck, A., Rojas, O. and Sain, M. (eds.), Handbook of Green Materials. Vol 1. Bionanomaterials: separation processes, characterization and properties, Chapter 11, in press. . Okita, Y., Saito, T. and Isogai, A. (2010): Entire surface oxidation of various cellulose microfibrils by TEMPO-mediated oxidation, Biomacromolecules 11, 1696. Park, S., Baker, J.O., Himmel, M.E., Parilla, P.A. and Johnson, D.K. (2010): Cellulose crystallinity index: Measurement techniques and their impact on interpreting cellulose performance, Biotechnology Biofuels 3, 10. Pääkkö, M., Ankerfors, M., Kosonen, H., Nykänen, A., Ahola, S., Österberg, M., Ruokolainen, J., Laine, J., Larsson, P.T., Ikkala, O. and Lindström, T. (2007): Enzymatic hydrolysis combined with mechanical shearing and highpressure homogenization for nanoscale cellulose fibrils and strong gels, Biomacromolecules 8, 1934. Pääkkö, M., Vapaavuori, J., Silvennoinen, R., Kosonen, H., Ankerfors, M., Lindström, T., Berglund, L.A. and Ikkala, O. (2008): Long and entangled native cellulose I nanofibers allow flexible aerogels and hierarchically porous templates for functionalities, Soft Matter 4, 2492. Pöhler, T., Lappalainen, T., Tammelin, T., Eronen, P., Hiekkataipale, P., Vehniäinen, A. and Koskinen, T.M. (2010): Influence of fibrillation method on the character of nanofibrillated cellulose (NFC), 2010 Tappi International Conference on Nanotechnology for Forest Products Industry, Espoo, Finland, Sept. 27-29, 2011, Tappi. Ruland, W. (1961): X-ray determination of crystallinity and diffuse disorder scattering, Acta Cryst. 14, 1180. Saarikoski, E., Saarinen, T., Salmela, J. and Seppälä, J. (2012): Flocculated flow of microfibrillated cellulose water suspensions: an imaging approach for characterization of rheological behaviour, Cellulose 19, 647. Saito, T. and Isogai, A. (2004): TEMPO-mediated oxidation of native cellulose. The effect of oxidation conditions on chemical and crystal structures of the water-insoluble fractions, Biomacromolecules 5, 1983. Saito, T., Hirota, M., Tamura, N., Kimura, S., Fukuzumi, H., Heux, L. and Isogai, A. (2009): Individualization of nano-sized plant cellulose fibrils by direct surface carboxylation using TEMPO catalyst under neutral conditions, Biomacromolecules 10, 1992.
142
Special Issue: NANOCELLULOSE Nordic Pulp & Paper Research Journal Vol 29 no (1) 2014
Saito, T., Kimura, S., Nishimara, Y. and Isogai, A. (2007): Cellulose nanofibers prepared by TEMPO-mediated oxidation of native cellulose, Biomacromolecules 8, 2485. Saito, T., Nishiyama, Y., Putaux, J.-L., Vignon, M. and Isogai, A. (2006): Homogeneous suspensions of individualized microfibrils from TEMPO-catalyzed oxidation of native cellulose, Biomacromolecules 7, 1687. Segal, L., Creely, J.J., Martin, A.E. and Conrad, C.M. (1959): An empirical method for estimating the degree of crystallinity of native cellulose using the X-ray diffractometer, Tex. Res. 29, 786. Sehaqui, H., Zhou, Q., Ikkala, O. and Berglund, L.A. (2011): Strong and tough cellulose nanopaper with high specific surface area, Biomacromolecules 12, 3638. Siró, I. and Plackett, D. (2010): Microfibrillated cellulose and new nanocomposite materials: a review, Cellulose 17, 459. Siqueira, G., Bras, J. and Dufresne, A. (2010): New process of chemical crafting of cellulose nanoparticles with a long chain isocyanate, Langmuir 26(1), 402. Sneck, A., Pitkänen, M., Kangas, H., Tammelin, T. and Hellén, E. (2011): New approach to classification of cellulose fibrils and suitable methods for their characterization, 2011 Tappi International Conference on Renewable raw materials, Washington D.C., USA, June 6-8, 2011, Tappi, Washington D.C. Spence, K.L., Venditti, R.A., Rojas, O.J., Habibi, Y. and Pavlak J.J. (2010): The effect of chemical composition on microfibrillar cellulose films from wood pulps: water interactions and physical properties for packaging applications. Cellulose 17, 835. Stenstad, P., Andresen, M., Tanem. B.S. and Stenius, P. (2008): Chemical surface modifications of microfibrillated celluloses, Cellulose 15, 35. Syverud, K., Xhanari, K., Chinga-Carrasco, G., Yu, Y. and Stenius, P. (2011): Films made of cellulose nanofibrils: surface modification by adsorption of a cationic surfactant and characterization by computer-assisted electron microscopy, J. Nanopart. Res. 13, 773.
Taipale, T., Österberg, M., Nykänen, A., Ruokolainen, J. and Laine, J. (2010): Effect of microfibrillated cellulose and fines on the drainage of kraft pulp suspension and paper strength, Cellulose 17, 1005. Tanaka, A., Seppänen, V., Houni, J., Sneck, A. and Pirkonen, P. (2012): Nanocellulose characterization with mechanical fractionation, Nord. Pulp Paper Res. J. 27, 689. Vartiainen, J., Pöhler, T., Sirola, K., Pylkkänen, L., Alenius, H., Hokkinen, J., Tapper, U., Lahtinen, P., Kapanen, A., Putkisto, K., Hiekkataipale, P., Eronen, P., Ruokolainen, J. and Laukkanen, A. (2011): Health and environmental safety aspects of friction grinding and spray grinding of microfibrillated cellulose, Cellulose 18, 775. Wang, Q.Q., Zhung, J.Y., Gleisner, R., Kuster, T.A., Baxa, U., McNeil, S.E. (2012): Morphological development of cellulose fibrils of a bleached eucalyptus pulp by mechanical fibrillation, Cellulose 19, 1631. Wågberg, L., Decher, G., Norgren, M., Lindström, T., Ankerfors, M. and Axnäs, K. (2008): The build-up of polyelectrolyte multilayers of microfibrillated cellulose and cationic polyelectrolytes, Langmuir 24, 784 Zimmermann, T., Bordeanu, N. and Strub, E. (2010): Properties of nanofibrillated cellulose from different raw materials and its reinforcement potential, Carbohydrate Polym 79, 1086. Zimmermann, T., Pöhler, E. and Greiger, T. (2004): Cellulose fibrils for polymer reinforcement, Adv. Eng. Mater. 6, 754. Österberg, M, Peresin, M.S., Johansson, L.-S. and Tammelin, T. (2013): Clean and reactive nanostructured cellulose surface, Cellulose 20, 983. Manuscript received November 1, 2013 Accepted February 7, 2014
143