In Proceedings of the European Workshop on Data Mining and Text Mining for Bioinformatics, held in conjunction with ECML/PKDD. Dubrovnik, Croatia, 2003.
Evaluating Context Features for Medical Relation Mining Špela Vintar♦, Ljupčo Todorovski♠, Daniel Sonntag♣, Paul Buitelaar♥ ♦
Faculty of Arts, University of Ljubljana,
[email protected] Department of Intelligent Systems, Jožef Stefan Institute,
[email protected] ♣ DaimlerChrysler AG, Research & Technology, Ulm,
[email protected] ♥ DFKI GmbH – German Research Center for Artificial Intelligence,
[email protected] ♠
often too generic, ambiguous or incomplete. Also, for many knowledge modelling or information extraction tasks 54 different relations are too much, as the boundaries between, say, associated_with and interacts_with tend to be blurred. We therefore seek for better ways of identifying selected domainspecific relations in medical texts, and since we believe that meaningful relations between concepts are verbalized in some way or another, the aim is to identify the context features that most reliably point to a certain semantic relation and learn the most effective way of representing them. By context features we mean in particular the linguistic environment of a pair of concepts, which we explore at different levels, including pure tokens, selected part-of-speech classes and semantic classes.
Abstract The paper describes a set of experiments aimed at identifying and evaluating context features and machine learning methods to identify medical semantic relations in texts. We use manually constructed lists of pairs of MeSH-classes that represent specific relations, and a linguistically and semantically annotated corpus of medical abstracts to explore the contextual features of relations. Using hierarchical clustering we compare and evaluate linguistic aspects of relation context and different data representations. Through feature selection on a small data set we also show that relations are characterized by typical context words, and by isolating these we can construct a more robust language model representing the target relation. Finally, we present graph visualization as an alternative and promising way of data representation facilitating feature selection. 1.
The first indicator of a possible semantic relation is when two concepts co-occur more frequently than would be expected by chance. We use a corpus of medical abstracts obtained from Springer (a subset of Medline) to extract pairs of co-occurring concepts, which we generalize according to MeSHtree membership at level 0. In order to explore context features in a controlled environment we use manually compiled lists of pairs of MeSH-tree leaves, which according to the medical expert very probably represent a specific semantic relation. Thus, for the relation treats the medical expert provided a list of over 100 pairs, such as D13|C23. Similar lists were compiled for 3 other relations, location_of, causes and analyzes.
Introduction
Finding previously unknown information in large text collections is undoubtedly the greatest challenge of Text Mining, and biomedicine remains one of its most interesting domains of application. This is primarily due to the potentially very broad impact of biomedical findings, but also to the extensiveness of electronic knowledge sources (e.g. UMLS and Medline), “waiting” to be exploited in an innovative way integrating natural language processing and machine learning techniques.
Using these data sets and the semantically annotated corpus, we seek to answer the following two questions: Firstly, which context features most reliably characterize a relation or help us distinguish between possible relations, and secondly, which data representation and mining algorithm works best in grouping MeSH-pairs according to the relation they represent.
Using linguistic analysis and medical thesauri, we introduce multiple levels of semantic annotation which help us narrow our search to selected medical concepts or semantic types. Despite all this explicitly or implicitly available knowledge, the identification of semantic relations, such as substance A treats disease B, remains a non-trivial task. Of course, the Semantic Network of the Unified Medical Language System (UMLS) already defines 54 domain-specific relations between the 134 available semantic types, which enables us to identify instances of UMLS relations in texts. However, applying the Semantic Network relations to medical abstracts shows that those relations are
2.
Related work
We are aware of several approaches to mining semantic relations from text for various applications, e.g. ontology construction, information retrieval and knowledge discovery,
64
In Proceedings of the European Workshop on Data Mining and Text Mining for Bioinformatics, held in conjunction with ECML/PKDD. Dubrovnik, Croatia, 2003. much of the latter in the biomedical domain. Approaches to ontology construction are primarily focused on discovering taxonomic or nontaxonomic relations between concepts, for example by learning association rules [12] or by concept clustering combined with grammatical relations [2]. In contrast to a typical ontology building scenario, we exploit an already existing ontology (UMLS) to identify our concepts and semantic classes and then focus on specific (i.e. labelled) medical relations for potential ontology enrichment.
The main semantic resource for the medical domain is UMLS (Unified Medical Language System)3, a multilingual database of medical terms, concepts, definitions and semantic relations. UMLS consists of 3 major parts: Metathesaurus, Semantic Network and Specialist Lexicon. The Metathesaurus is essentially a large termbank listing medical terms and expressions and assigning a language independent code to each term (CUI – Concept Unique Identifier). Since UMLS is being developed as an integrated system unifying various medical thesauri and sources, it also includes the mappings of CUIs to some of these more specific thesauri. Thus, one of such core sources is MeSH (Medical Subject Headings), a thesaurus organizing medical knowledge into 15 top tree nodes, each of which is marked with a letter and subdivided into branches. For example, A stands for Anatomy, B for Organisms, C for Diseases etc.
A more supervised line of research aims to find relations via lexico-syntactic patterns, e.g. {NP}, especially {NP}, which would match pairs of hypernyms as in European countries, especially France [10], [9], [6], [1]. For the purposes of knowledge discovery in medicine even unlabelled associations or statistical correlations may prove useful for hypothesis generation, as Swanson’s experiments show [15]. Later work by Weeber et al. [16] proposes a more sophisticated model of automatic hypothesis generation from a medical corpus, which already integrates some linguistic processing and semantic annotation. Finding specific medical relations, such as X causes Y, was initially attempted through tables of pattern-matching rules based on cooccurrences of MeSH-classes [4]. Rosario et al. [13] use MeSH in a similar way to determine semantic relations within noun compounds. Our approach also uses pairs of co-occurring MeSHclasses, however instead of providing patterns or rules we try to learn the context that determines a particular relation. 3.
In our semantic annotation we identify medical terms and label them with codes (CUIs) from the UMLS Metathesaurus. These are mapped further to semantic types (TUI – Type Unique Identifier) as well as to MeSH codes corresponding to the nodes in the MeSH tree hierarchy. Although the 134 semantic types defined by the UMLS are also hierarchically ordered, we opted for using MeSH descriptors instead, because these transparently show the position of a certain concept within the MeSH tree structure. They also allow us to choose the desired level of abstraction simply by climbing to higher-level tree nodes. Thus, if a text contains the medical term anorexia nervosa, it will be assigned the concept code C0003125 and the MeSH descriptor F03.375.100, which can then be abstracted to F03 – Mental Disorders.
Linguistic and semantic processing 4.
To obtain concept co-occurrence data and contextual features we use two corpora of medical abstracts: the MuchMore Springer bilingual corpus1 of ca. 9,000 abstracts in German and English and a subpart of the Ohsumed corpus of 22,000 abstracts in English. Both corpora were linguistically and semantically processed using tools developed within the MuchMore2 projecton cross-lingual information retrieval in the medical domain. Linguistic processing plays an important role in the accuracy of semantic annotation, where we identify medical terms and map them to UMLS concepts. Linguistic processing included tokenization, partof-speech tagging and lemmatization; for the latter the morphological lexicon was extended to include medical terminology.
1 2
Text Mining methods
4.1 Hierarchical clustering Clustering is an unsupervised learning method [15]. Given data about a set of instances, a clustering algorithm creates groups of objects following two criteria. Firstly, instances are close (or similar) to the other instances from the same group (internal cohesion) and secondly, they are distant (or dissimilar) from instances in the other groups (external isolation). A particular class of clustering methods, studied and widely used in statistical data analysis are hierarchical clustering methods [15]. The hierarchical clustering algorithm starts with assigning each instance to its own cluster, and iteratively joins together the two closest (most similar) clusters. The distances between instances are provided as input to the clustering algorithm.
http://muchmore.dfki.de/resources1.htm http://muchmore.dfki.de
3
65
http://www.nlm.nih.gov/research/umls/
In Proceedings of the European Workshop on Data Mining and Text Mining for Bioinformatics, held in conjunction with ECML/PKDD. Dubrovnik, Croatia, 2003.
The measure of quality of C with respect to R can be defined as: max i , j ,i ≠ j (O1i + O 2 j ) , Q R (C ) = N
The iteration continues until all instances are clustered into a single cluster. The output of the hierarchical clustering algorithm is a hierarchical tree of clusters or dendrogram that illustrates the order in which instances are joined together in clusters. In the final step of the hierarchical clustering algorithm, clusters are obtained by cutting the dedrogram into sub-trees: elements in each sub-tree form a cluster. Cutting the same dendrogram at different heights produces different number of clusters. The optimal “cut point” that produces clusters with maximal internal cohesiveness and minimal external isolation from a given dendrogram is where the difference between heights of two successive nodes in the tree is maximal.
where O ki = R k ∩ C i measures the overlap between clusters and N is the number of instances in the data set. The quality measure assesses the classification accuracy of the classifier that assigns semantic relations to MeSH-pair instances based on the obtained clustering C. The range of the quality measure is [0,1] . The quality of 1 is obtained when the candidate clustering C is identical to the reference R. 5.
4.2 Data representation and distance measures In our experiments, instances are MeSH-pairs. Each MeSH-pair (e.g. A1|C23) is described by 300 most frequent contextual features, which were observed to be nouns and verbs. Two different data representation were used to represent the feature vectors. The first data representation is relative frequency, i.e., frequency of context words relative to the frequency of the observed instance in the corpora. The second is simple binary true/false representation where only presence/absence of words in the context of the observed MeSH-pair is considered.
5.1 Evaluation of context features Starting from the hypothesis that a frequently cooccurring pair of MeSH classes indicates the existence of a semantic relation and that this relation is somehow expressed through language, we wish to determine the context features that help us identify and label the relation. Many linguistically motivated approaches to relations have focussed on verbs as vehicles of relationships between syntactic elements, however in medical texts we observe that nominalizations are frequently used instead of verbal forms, as in The treatment of [disease X] through [substance Y] proved successful. We therefore tested the following possible features occurring within the same sentence: • all tokens (tokens), • all verbs (verbs), • all nouns (nouns), • all other concepts (cuis).
Another parameter that may influence the success of clustering is the measure of distance between instances. Apart from the standard Euclidean and Manhattan distances, which can be used with both the relative frequency and binary data representation, we also tested a distance measure based on the Jaccard coefficient (1) for measuring similarity between binary vectors interpreted as sets of words (X and Y):
JD( X , Y ) = 1 −
Identifying context features for relation mining
Context tokens nouns verbs cuis
| X ∩Y | . (1) | X ∪Y |
4.3 Evaluation of clustering We used a metric for evaluation of clustering that is based on comparison of the set of clusters, obtained in the experiments (candidate clustering), with the reference clustering, provided by human expert. Namely, for each instance in the dataset human expert provides the relation represented by the pair (e.g., treats or location_of). Then, let R = {R1 , R 2 } 4 be the reference clustering and
tl_old 0.5454 0.6591 0.6363 0.5681
tl_new 0.5642 0.6703 0.6872 0.5195
Table 1: Selecting context
For each of the above, frequency data was collected from the corpus for our sets of manually labelled pairs and used for hierarchical clustering. Table 1 shows a comparison of clustering accuracy for all of these settings on two different data sets (tl_old and tl_new); the data representation selected for the above comparison was binary.
C = {C1 , C 2 , l , C n } be the candidate clustering.
It is clear from the above that among these settings, nouns and verbs perform best, we therefore used nouns and verbs as context for all further experiments. We also experimented with the
4
In this paper we deal with the task of distinguishing between two relations only, so the reference clustering consists of two clusters only. 66
In Proceedings of the European Workshop on Data Mining and Text Mining for Bioinformatics, held in conjunction with ECML/PKDD. Dubrovnik, Croatia, 2003.
number of attributes used to describe each pair, which resulted in an optimal cut-off point of 300 for most frequent verbs and nouns.
controlled context on the same data set left us with 4% of the initial context words, a list of 290 distinctive context words for the selected relation pair. Table 3 lists the results obtained with 40%, 20% and 4% of the context words respectively.
5.2 Data representation and distance measure Table 2 shows the evaluation of data representation and distance measures for three different data sets: • tl_old: 49 MeSH-pairs representing the relations treats and location_of, • tl_new: 287 additional MeSH-pairs representing the relations treats and location_of, • ac: 89 MeSH-pairs representing the relations analyzes and causes.
To test whether this list was distinctive only for the data set it had been produced with or for all data sets representing the same relation pair, the new data set tl_new of 190 MeSH-pairs representing the relations treats and location_of was constructed. The context features were now no longer most frequent verbs and nouns but the list of 290 distinctive words, for which data was obtained from the larger corpus, Ohsumed, and clustered. The last two lines of Table 3 show the results of this controlled-context experiment (tl_new 0.04) compared with the uncontrolled-context result given above (tl_new W/O 1.0). The improvement is significant, which shows that contextual features learned on a small data set can be generalized to a larger data set of the selected relation pair.
The distance measures tested were Euclidean (euc), Manhattan (man) and Jaccard (jacc). Data set
Data representation
binary tl_old
relative frequency binary
tl_new
relative frequency binary
ac
relative frequency
Distance measure euc/man jacc euc man euc/man jacc euc man euc/man jacc euc man
Score
0.5227 0.4318 0.5454 0.5682 0.5225 0.7528 0.6910 0.7303 0.7368 0.5131 0.6973 0.6578
Data set
tl_old tl_new
Filtering threshold 0.40 0.20 0.04 0.04 W/O (1.0)
Score
0.6888 0.6888 0.8889 0.8212 0.5225
Table 3: Selecting context words
Table 2: Data representation and distance measures
6.
Graphical representation
The graphical representation is used for visualising the data and for inducing new data instance vectors that serve as alternative input for the ML algorithms. We provide a powerful data engineering facility while projecting the data onto a two-dimensional grid, since the 2D graph format visualises potentially interesting structures. The spatial co-ordinates form new input for learning schemes apart from those obtained using regular attribute selection and discretization methods in higher-dimensional attribute vector spaces.
5.3 Learning typical contexts
For some purposes, for example information retrieval, the results as given by Table 2 might be sufficient to distinguish between two or more relations on the basis of context. However, in all above scenarios the clusters are still very fuzzy. Using the optimal split into clusters indeed produces two clusters most of the time, but the quality of the clusters remains between 70 and 80%. Therefore, in order to obtain a clearer view of which features best function as distinctive and whether it was possible to generalize these findings, an experiment involving supervised feature selection was performed. For the data set tl_old of 49 manually selected MeSH-pairs representing the relations treats and location_of, the context words were automatically weighted according to their occurrence with either treats-pairs or location_ofpairs. Then, only words that were found to occur with one of the relations significantly more often than with the other were kept as context words, others were omitted. Recursively testing this
We use an information-preserving mapping from vector data attributes to graphical properties where all attribute values are reflected in the corresponding graph [3], [5]. Most of these properties represent input to a graph layout optimisation algorithm: We use an automatic graph layout with layout constraints and an objective function based on aesthetic criteria that serves well for displaying semantic proximity if the graph structure is well designed. Most of the global graph properties represent input to the graph layout optimisation algorithm. Every 67
In Proceedings of the European Workshop on Data Mining and Text Mining for Bioinformatics, held in conjunction with ECML/PKDD. Dubrovnik, Croatia, 2003.
It is clear however that any semi-automated or interactive approach to knowledge discovery would benefit from a graphical representation, both for data/parameter selection and evaluation. The graphical representation may act as additional view of the text data to reveal new data characteristics that can be visually explored by the domain expert and quantified by graph properties. In particular, to find relationships between term distribution models and graphical representations may help to characterize how informative a word is [11].
data instance is presented as an undirected graph with all data attributes as vertices. The target concept is a special vertex, with special shape, colour and size. The shape and the colour are perceptual attributes for better visual data inspection, while the size of the node reflects the special status of the target node as a special attribute. Each target node is connected with an edge to every attribute. The ratio of the target node size and attribute node accounts for the fact that one target node is always connected to several attribute nodes. The attribute value (e.g. relative frequency) is projected onto a discrete numerical value representing the preferred edge length that is also input to the layout algorithm. The algorithm accepts integer values between 80 and 400. The mapping function was defined in a way to map the attribute values inversely proportional on this interval. This means that a high attribute value sets a low preferred edge length on the edge between the target node and the attribute node reflecting high term/word weight as (semantic/spatial) proximity between attribute and target.
Data set ac_rf_ne_404 ac_rf_ne_smart tl_new_smart40 tl_old_smart400 tl_old_smart_rf Table 4: coordinates
Visualization
Score (4) 0.4473 (3) 0.5131 (4) 0.4213 (2) 0.5454 (4) 0.5909 and
clustering
6.2 Feature selection through visualization
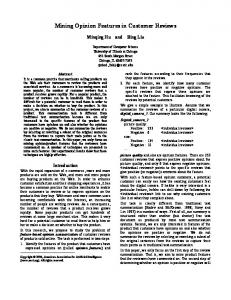
Knowing that semantic relations can be identified by their context, graphical representation can also be used as an alternative way of selecting distinctive features, e.g. typical words. Pictures 1 (ac_rf_ne_smart) and 2 (tl_old_smart_rf) below show the distribution of typical features on the twodimensional grid and their correspondence to the formation of visual clusters. Large black and white boxes represent instances of the two relations, analyzes and causes, and the small boxes represent context words. It can be seen very clearly how typical context words "pull" instances into the white or black cluster. Picture 3 (ac_rf_ne_404) shows the term cloud for analyses-causes. In this constellation we allow for overlapping nodes, which leaves less constraints for the resulting layout. Although the score for this dataset was low, one can see that the different relations are apparent. Interestingly, typical stop words (be, have, are, patient) are positioned in the barycentre of the graph.
When laying out a graph, nodes are considered to be physical objects with mutually repulsive forces, like protons or electrons. The connections between nodes also follow the physical analogy and are considered to be metal springs attached to the pair of nodes. These springs produce repulsive or attractive forces between their endpoints if they are too short or too long. The layouter simulates these physical forces and rearranges the positions of the nodes in such a way that the sum of the forces emitted by the nodes and the edges reaches a (local) minimum [7], [8]. 6.1 Clustering coordinates Using graph objects and their visualization as an alternative way of representing our data and evoking an automatic layout algorithm (and tuning the layout parameters) now produces twodimensional vectors of co-ordinates, which can be clustered with the same algorithm as before and the Euclidean distance. Using the co-ordinates as new input vectors is a special kind of dimensionality reduction method inspired by visualisation techniques for analysing meaning [17]. Table 4 shows the clustering results for all 3 data sets.
In general, the performance of this method is roughly comparable to the statistical method, slightly better with some data sets and slightly worse with others. The visualisation shows that clusters can better be separated visually than automatic clustering reflects.
68
In Proceedings of the European Workshop on Data Mining and Text Mining for Bioinformatics, held in conjunction with ECML/PKDD. Dubrovnik, Croatia, 2003.
7.
Conclusions
Starting from the hypothesis that semantic relations are realized in texts through identifyable context features, the goal of the described experiments was to design a methodology to model relations and determine the parameters that distinguish relations. After evaluating different data representations we propose a method for feature selection on a relatively small data set of 49 manually selected relation instances, which was found to perform well also on a larger set of relation instances. In further work we will explore the interaction between general statistical methods, vector-based representations and graph representations. The result could be used as decision support for textmining algorithm selection or be combined with the outcome of a text-mining algorithm on the original data.
Picture 1: Distinctive features for treats location_of
Although all our test sets were limited to two relations, the approach can be easily generalized to an arbitrary number of domain-specific relations. The evaluation of the approach on distinguishing between more than two relations is another direction for further work. By learning context models of medical semantic relations, new unlabelled instances can be classified and thus identified in texts. A particularly important application of relation extraction is in document retrieval, where a query may be pruned or expanded according to the target relation. On the other hand, collecting new relation evidence from large text collections can also be used for the purposes of enriching the UMLS. In order to test the usability of the methods we propose, context models should be constructed for all target relations and evaluated in a classification task. Finally, we also envisage transferring this approach to a proper knowledge discovery task by expanding the context of a relation to larger text sections or entire documents or search for document parts where the vocabulary and thus the context of a relation instance shifts from one instance to another.
Picture 2: Distinctive features for analyzes causes
Acknowledgements
This research has in part been supported by EC/NSF grant IST-1999-11438 for the MUCHMORE project. References
1. Picture 3: Term Cloud for analyses-causes
69
Agichtein, E.; Gravano, L. (1999) Snowball: Extracting relations from large plain-text collections. Columbia University Computer
In Proceedings of the European Workshop on Data Mining and Text Mining for Bioinformatics, held in conjunction with ECML/PKDD. Dubrovnik, Croatia, 2003.
2.
3. 4.
5.
6.
7.
8. 9. 10.
11.
12.
13.
14. 15.
Science Department Technical Report CUCS033099. Bisson, G.; Nédellec, C.; Cañamero, D. (2000) Designing clustering methods for ontology building: The Mo'K workbench. In: Ontology Learning ECAI 2000 Workshop, Berlin. Bradley, J.; Rockwell, G. (1994) What Scientific Visualisation Teaches us about Text Analysis, ALLC/ACH '94, Paris Cimino, J.J.; Barnett, G. O. (1993) Automatic Knowledge Acquisition from MEDLINE. Methods of Information in Medicine, 32(2): 120-130. Engelhardt, Y. (1997) Toward a Unified Visual Representation of Documents and Concepts, CODATA Euro-American Workshop on Visualisation of Information and Data. Finkelstein-Landau, M.; Morin, E. (1999) Extracting semantic relationships between terms: Supervised vs. unsupervised methods. In: International Workshop on Ontological Engineering in the Global Information Infrastructure, 71-80. Frick, A.; Ludwig, A.; Mehldau, H. (1994) A Fast Adaptive Layout Algorithm for Undirected Graphs (Extended Abstract and System Demonstration) Proc. DIMACS Int. Work. Graph Drawing, GD Fruchterman, T.M.J.; Reingold, E.M. (1991) Graph drawing by force-directed placement. Software-Practice and Experience, 21. Gildea, D.; Jurafsky, D. (2000) Automatic Labeling of Semantic Roles, ACL 2000 Hong Kong, pp. 512-520. Hearst, M.A. (1998) Automated discovery of Wordnet relations. In: Fellbaum, Ch., ed., WordNet: An Electronic Lexical Database, pp. 131-151, MIT Press. Lee, L.; Pereira, F. (1999), Distributional Similarity Models: Clustering vs. Nearest Neighbors, 37th Annual Meeting of the Association for Computational Linguistics, pages 33-40. Maedche, A.; Staab, S. (2000) Discovering Conceptual Relations from Text. In: W. Horn (ed.) ECAI 2000, Proceedings of the 14th European Conference on Artificial Intelligence, Berlin, IOS Press, Amsterdam. Rosario, B.; Hearst, M.A.; Fillmore, Ch. (2002) The descent of hierarchy, and selection in relational semantics. In: Proceedings of ACL '02, Philadelphia, PA. Hartigan, J.A. (1975) Clustering Algorithms. Wiley, New York. Swanson D.R.; Smalheiser N.R. (1997) An interactive system for finding complementary literatures: A stimulus to scientific discovery. Artificial Intelligence 91:183–203. http://kiwi.uchicago.edu.
16. Weeber, M.; H. Klein, A. R. Aronson, J. G.; Mork, L. Jong-van den Berg; R. Vos (2000) Text-Based Discovery in Biomedicine: The Architecture of the DAD-system. In: The American Medical Informatics Association 2000 Symposium. 17. Widdows, D.; Cederberg, S.; Dorow, B. (2002) Visualisation Techniques for Analysing Meaning. Fifth International Conference on Text, Speech and Dialogue, Brno, Czech Republic, September 2002, pages 107-115.
70