Evaluating Lateration-Based Positioning Algorithms for Fine-Grained Tracking Andrew Rice
Robert Harle
Computer Laboratory University of Cambridge, UK
Computer Laboratory University of Cambridge, UK
[email protected]
[email protected]
ABSTRACT
1. INTRODUCTION
There is a growing interest in the localisation of both people and objects in the mobile computing world. Systems are being developed to provide location-based services to humans, whilst sensor networks are increasingly using location information to spatially localise disparate nodes and sensed objects, potentially aiding in communications routing [9]. Fine-grained location systems (with sub-metre positioning accuracy or better) have emerged primarily from sensor platforms designed solely with positioning in mind. Fine-grained tracking enables new interfaces (augmented reality, three-dimensional mouse input, etc), better contextual inferences (people seated around a table implies a meeting, etc), and accurate, location correlated, sensing (mobile nodes placed on a seabed, etc). To date many systems have been developed to provide location data for static and dynamic objects alike [8], utilising visible light [2, 3, 10] infra-red [14], ultrasound [13, 16], and radio in many guises [1, 5]. The positioning calculation has been based on multiangulation (angular bearingbased), multilateration (time- or range-based), or a mix of the two. It may be offloaded to nearby high power systems or performed locally on mobile devices . The former case allows for more complex algorithms, whilst the latter increases location privacy by determinCategories and Subject Descriptors ing its own position. I.6 [Information Systems]: Simulation and Modeling; D.0 [Software]: A significant challenge facing location system designers is that General of multipathed signals — all location systems rely on the propagation of signals, and multipathed signals are those that do not propagate along the expected direct line-of-sight paths. Multipathed General Terms signals reduce the dependability of the output locations. A perfect Algorithms, Experimentation, Reliability positioning algorithm rejects all multipathed signals, but in reality it is not always possible to distinguish direct from multipathed. TraKeywords ditionally this issue is tackled by using algorithms that search for consistent positioning solutions within an over-constrained system Dependable, Fine grained location, Lateration, Location, Positionof lateration measures. ing algorithms In this paper, we examine the trade-offs associated with the use of five positioning algorithms for lateration data. The choice of lateration data over an angular equivalent allows evaluation of the algorithms using real positioning data from an established finegrained positioning system known as the Bat system [16]. We examine the performance of the chosen algorithms with respect to precision, dependability, and computation costs: metrics we define in detail. The algorithms are implemented within an open source positioning library which we have made generally available. Permission to make digital or hard copies of all or part of this work for The rest of this paper is structured as follows: Section 2 sumpersonal or classroom use is granted without fee provided that copies are marises the algorithms evaluated, Section 3 describes the collecnot made or distributed for profit or commercial advantage and that copies tion of location data, Section 4 presents the results, and Section 5 bear this notice and the full citation on the first page. To copy otherwise, to concludes. republish, to post on servers or to redistribute to lists, requires prior specific Accurate, dependable location information enables new services to users and efficient message routing within a sensor network. Finegrained location data are often degraded by prevalent multipath and varying transmission channel characteristics. Successful positioning systems have used over-constrained sensor data to increase resilience to these problems and improve the accuracy of the location information produced. In this paper we evaluate a selection of commonly used algorithms for range-based (lateration) measurement data. We consider their accuracy, dependability, and computational requirements. The evaluation is performed using data collected over an extended period using an established indoor positioning system that locates active tags using the propagation of ultrasound from tag to a matrix of static sensors distributed throughout a 550m2 office floor space. We identify algorithms with successful multipath rejection and highlight the importance of the sensors’ geometric configuration. This is particularly pertinent when considering positioning near cell boundaries in the sensor network. We introduce two new metrics to characterise the dependability of positioning algorithms.
permission and/or a fee. DIALM-POMC’05, September 2, 2005, Cologne, Germany. Copyright 2005 ACM 1-59593-092-2/05/0009 ...$5.00.
This is a non-linear function of the parameters, and thus a nonlinear regression analysis is appropriate. A single application of non-linear regression results in a position estimate based on all input measurements. If the input data set is densely packed with reliable data and only one or two datums are multipathed, this algorithm should perform reasonably well, generally preferring a position that agrees with the majority of the input set. A residual, ei , is defined for each input datum, i, by measuring its agreement with the final output. The overall model fit for n measurements can be estimated by a standard error, σ, where σ2 =
n n 1X 2 1X ei = (ri − di )2 n i n i
(2)
where ri represents the range measurement associated with datum i.1 This quantity serves as the predicted error.
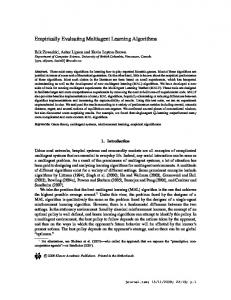
2.2 Iterative Non-linear Regression (INLR) Figure 1: Predicted and actual error.
2.
POSITIONING ALGORITHMS
In a realistic environment it is important to acknowledge the performance of the algorithm in terms of results and execution costs. We parameterise the space of location algorithms with the following dimensions: • Actual Error The algorithm’s actual error describes the Euclidean distance of the estimated position (algorithm output) to the corresponding true position (measured experimentally). • Predicted Error The predicted error is an estimate of the actual error when the true position is unknown i.e. based solely on the lateration data. See Figure 2 for a comparison with actual error. We also introduce the notion of dependability which is the proportion of time the true position lies within the predicted error of the estimated position (it lies outside in the example of Figure 2). • Computation Cost It is often important to minimise computation costs for systems with mobile devices. The five algorithms analyzed in this paper are chosen to provide a spectrum of algorithms with different trade-offs. They are used to process range-based data, and represent a necessary step in the positioning solution (some systems effectively amalgamate sequences of mobile positions using a filter to increase accuracy and dependability [6]: we do not consider such algorithms here since we are interested in deterministic position calculations that are often used as input to such filters)
2.1 Non-linear Regression (NLR) In essence the problem of positioning is one of data-fitting; given a set of input measurements {mi }, what parameters {pj } provide a best fit? In general for such problems regression analysis can be used to estimate the parameters, which in the case of positioning will include the location (x,y,z). The standard choice of fitting function for position determination fits each of the range measurements to the distance between the current position estimate (px ,py ,pz ) and the associated static sensor (sx ,sy ,sz ), di =
p
(sx − px )2 + (sy − py )2 + (sz − pz )2 .
(1)
A useful extension to NLR is to iteratively form NLR models reducing the size of the input data set with each iteration. Following the formation of a model, the single measurement determined to disagree with the estimate most (i.e. the measurement associated with the greatest residual) is discarded and the modelling process starts afresh. The Bat system makes use of a such an algorithm to perform its multilateration. Here, outliers arise from a combination of signal reflections and noise. With each rejection of a range value, a new non-linear model is computed using only the remaining data [15]. This process repeats until either there are insufficient measurements remaining to fully constrain the model (a failure) or the model σ value goes below a nominal threshold (a success). The final σ is used as the predicted error. Essentially this algorithm searches for the largest quorum of consistent values within the measurement set, adopting the corresponding position as its position estimate and the level of agreement within the quorum as the predicted error.
2.3 Least Squares (LS) It is possible to linearise Equation 1 in order to use more traditional linear regression (or least squares). The solution can then be represented as a matrix computation which can be computed faster than using the NLR analysis. Whilst NLR effectively considers the intersection of spheres centred on each receiver, the linearisation considers the intersection of infinite planes. Each pair of spheres that intersect do so entirely within a plane and linearisation identifies all such planes. The point that best represents the intersection of all these planes is then found by the least squares algorithm. Previous work has shown that this technique is highly susceptible to outliers [12]. Evaluating the σ value of the model does not provide a good predicted error since the linearisation process results in residuals that are not representative of obvious spatial quantities. Instead the predicted error can be derived from calculation of the distance residuals using the original (non-linearised) measurements and the estimated position (Equation 2), or based on the magnitude of the maximum residual (where we have used the former we refer to LLSA, whilst we use LLSB for the latter).
2.4 Random Sample Consensus (RANSAC) The RANSAC [4] technique uses trilateration [11] to derive a position from a randomly selected triplet within the dataset. The remainder of the data set is then partitioned into supporting and non-supporting data based on the expected error of each reading. 1
We assume each measurement has a variance of unity.
If a quorum of suitable size is found the algorithm returns the estimated position. Otherwise, another triplet is selected randomly and the process repeated until a predetermined number of iterations has elapsed. We nominally assign the maximum expected error of a reading to be the precision of this algorithm. This algorithm acts in the opposite sense to the INLR algorithm given above, where all data is taken and iteratively discarded. In this case an estimate is produced and additional support is garnered by adding remaining, consistent data points.
2.5 Trilaterate on Minima (ToM) Low resource location systems might require much simpler algorithms for position estimation than those mentioned above. The ToM algorithm produces a position by selecting the three shortest readings from the sample set. This heuristic hopes to eliminate reflected signals by assuming they take a longer path to direct signals. This technique has no mechanism for rejecting sightings and so cannot be considered dependable — bad data cannot be distinguished from good. It uses a heuristic to select a set of data points from the available data. A solution, potentially avoiding outliers, can be reached without iteration. Since the input data to ToM is not over-constrained, calculating a predicted error as with other algorithms is not possible: the algorithm will either fail or provide a result in perfect agreement with its input.
3.
Figure 2: Bats were fixed in positions in the centre of an office and to the walls.
DATA COLLECTION
An evaluation of the performance of each algorithm requires measurements from a real-world environment. Meaningful results cannot be drawn from simulated data since no reliable simulation of indoor environments and people exists. As part of the Sentient Computing project at the University of Cambridge, we have deployed the Bat system [16] — an ultrasonic positioning system. This uses sensors in the form of ultrasonic receivers installed at precisely measured locations in the ceiling of the laboratory and powered tags (“Bats”) which act as ultrasound transmitters. It is an example of a centralised sensor network with the sole purpose of accurately locating Bats and, by extension, the people and objects attached to them. The system is capable of positioning to within 3cm of the true position 95% of the time using iterative multilateration of ranging data (the INLR technique). The Bat system provides a testbed with which to evaluate positioning algorithms: it has a dense distribution of ceiling sensors (as might be expected in more generic sensor node deployment), is an established and well-tested platform, and offloads the calculation of position to surrounding infrastructure, allowing close analysis of computational demands. A four month study using the Bat system was conducted to collect data in an office environment. In excess of two million sightings were collected for a total of ten Bats, eight of which were fixed to office walls and two to the centre of offices (Figures 2 and 3). The Bats were thus in a static configuration: this allowed determination of their true position using laser-surveying equipment. Given that the error associated with the Bat system is at least one decimal order of magnitude greater than this, the laser survey results are treated here as absolute. The choice to place the majority of Bats on walls decreased the likelihood of accidental movement by the room’s users without affecting the room’s normal usage patterns. The few Bats placed in the centre of offices permit significant differences in behaviour between central and perimeter Bats to be detected. We also note that in our Sentient Environment many of the interaction zones requiring location of Bats are placed on the perimeter of offices. For each sighting of a Bat, the raw positioning data was logged. This consisted of a series of timing pulses and measurements of
Figure 3: The location of each of the deployed survey Bats.
the local environment details at the time (temperature, etc.). The logs were then used to post-process the data using the various algorithms. This permitted fair comparison of the candidate algorithms on using the same real-world dataset. The computation cost was be estimated, to some extent, by monitoring the computation time required by each algorithm. The actual error was derived by comparing the returned positions with the corresponding laser-measured true positions.
4. RESULTS Examination of the raw sighting data has shown that multipathed outliers occupy between 5% and 20% of the sighting information. There seems to be little correlation between the rate of outlier occurrence when the Bat is fixed to a wall or when it is affixed to the centre of an office, consistent with the expected behaviour of inwardly-facing Bats All algorithms show, to a varying extent, decreased precision near the room boundaries. We attribute this to Dilution of Precision (DOP) due to the fact that the walls physically partition the ultrasonic system. Bats fixed to the edge of the room will see only ceiling receivers in front of them rather than behind. Thus each incoming measurement data set contains a reduced volume of data and the degree of redundancy present is similarly reduced, adversely affecting the position estimate. Table 1 shows the averaged actual error for each algorithm tested. Table 2 shows the percentage of sightings that lay within the predicted error of the true position (the dependability). On the basis of actual error alone, it is clear that ILNR is an attractive solution. This is attributable to its iterative nature which completely discards inconsistent data and proves very powerful in eliminating multipathed signals. However, Table 2 shows a low density of positions within its predicted error, relative to the other
4e+07
3.5e+07
Frequency
3e+07
2.5e+07
2e+07
1.5e+07
1e+07
5e+06
0 0
0.02
0.04 0.06 Error (metres)
0.08
0.1
0.08
0.1
(a) INLR algorithm
1.4e+07
1.2e+07
Frequency
1e+07
8e+06
6e+06
4e+06
2e+06
0 0
0.02
0.04 0.06 Error (metres)
(b) RANSAC algorithm Figure 4: Histograms of actual error distributions for Bat 1. Bat INLR RANSAC NLR LLS ToM
1 0.027 0.048 0.418 15.392 0.899
2 0.023 0.048 0.058 3.742 0.36
3 0.019 0.149 0.074 6.135 0.636
4 0.045 0.07 1.058 26.24 0.984
5 0.047 0.09 0.54 9.849 0.468
6 0.03 0.09 0.21 15.01 1.16
7 0.06 0.11 0.12 6.26 0.62
8 0.06 0.1 0.37 3.36 0.27
9 0.06 0.09 0.42 111.7 0.63
Table 1: Actual error (metres) for the positioning algorithms.
10 0.06 0.07 0.48 18.94 0.3
Average 0.04 0.09 0.38 21.66 0.63
1.6e+07
1.4e+07
Frequency
1.2e+07
1e+07
8e+06
6e+06
4e+06
2e+06
0 0
0.05
0.1 Error (metres)
0.15
0.2
(a) INLR algorithm 1.8e+07
Bat 1 Bat 8
1.6e+07
1.4e+07
Frequency
1.2e+07
1e+07
8e+06
6e+06
4e+06
2e+06
0 0
0.05
0.1 Error (metres)
0.15
(b) RANSAC algorithm Figure 5: Histograms showing the absolute positioning error for Bat 8.
0.2
Bat INLR RANSAC NLR LLSA LLSB
1 99.443 99.967 99.95 5.456 5.458
2 99.988 99.979 99.963 79.122 79.143
3 99.838 99.983 99.996 27.081 27.095
4 95.556 99.964 100 2.038 4.474
5 79.017 99.969 100 12.567 12.577
6 99.52 99.56 100 0.89 6.19
7 76.44 99.33 100 16.81 28.15
8 95.71 96.45 100 45.52 45.53
9 81.97 99.75 100 0.03 0.03
10 92.47 99.4 100 33.6 33.63
Average 91.99 99.44 99.99 22.31 24.23
Table 2: Dependability (%). Bat INLR RANSAC NLR LLSA LLSB
1 0.026 2.513 6.642 0.994 0.995
2 0.046 0.946 3.079 1.178 1.179
3 0.09 2.305 4.569 1.185 1.186
4 0.032 2.024 7.315 0.303 1.21
5 0.065 0.799 3.609 0.887 0.887
6 0.067 1.161 6.156 0.295 0.592
7 0.044 0.815 3.005 0.175 0.58
8 0.049 0.252 1.661 1.38 1.382
9 0.017 0.459 2.032 1.045 1.046
10 0.025 0.288 2.531 0.442 0.443
Average 0.046 1.156 4.06 0.788 0.95
Table 3: Dependability strength (metres). algorithms. This can be attributed to the threshold σ value used, which defines how accurate a model must be (and hence how much data is to be discarded) before a success is declared. For the results as presented, σ was set to 3cm. The result of the threshold is that it may be possible for only three noisy measurements to remain and for them to be consistent with a single (noisy) position which is duly returned alongside the fit error, failing to represent the true noise. i.e. A particular sighting may have a set of measurements only affected by random noise. Use of INLR runs the rick of reducing that set since each reduction produces a new set of measurements that are more consistent (suggesting a lower predicted error). Thus the final predicted error does not faithfully represent the noise encountered in the entire data. Over time we have become aware of a further subtle issue with with the standard INLR algorithm. To summarise, the algorithm iteratively discards the data that disagrees with the majority of the input data set. This should produce a more accurate position estimate with a correspondingly better predicted error. Unfortunately, this can be misleading in certain extreme cases. Consider the majority of signals reflecting specularly from the same object and the remaining measures being direct measures. The majority of the data set then agrees with a position that is a reflection of the true position through the reflecting surface. Thus INLR will discard the correct measurements and converge on the reflection. Since the remaining (reflected) signals are in close agreement, it will associate a small predicted error with the position estimate, despite being wildly incorrect. Such cases arise in the Bat system, where application of physical principles to the ordering of residuals has drastically reduced the issue [7]. The NLR algorithm produces a degraded position and predicted error relative to INLR. From the standpoint of accurate positioning, then, the iterative element is clearly desirable. However, it is clear that the dependability of the result is much better since the evaluation of fit uses all available data. The LLS algorithm might be expected to show similar results to the NLR algorithm, since it is effectively a linearised version of it. It is clear from Table 1, however, that LLS performed very badly in our tests. Closer inspection revealed that the linearisation process (which considers intersecting planes) results in a very poor constraint in the vertical dimension — a by-product of the fact Bat system receivers are each installed at an approximately equivalent height, giving planes with near horizontal normal vectors. Thus LLS tended to provide accurate estimates of the x- and y- coordinates, but poor estimates of the z. Figure 6 shows that LLS and NL
produce similar results in the x-y plane but the z axis of the LLS shows enormous errors. RANSAC shows a more significant change in actual error when the Bats are fixed to a room boundary. This is because the RANSAC algorithm starts by randomly selecting a candidate triplet for trilateration. If this tuple should happen to have weak geometry then a poor estimate of position will be used to initialise the search for a supporting set. The possibility of RANSAC selecting an initial choice with poor geometry is exemplified by looking at the distribution of errors produced by the algorithm. When locating a Bat in the centre of a room (Figure 4) the distribution displays an evident, strong peak. However, when considering a Bat fixed to a wall the distribution becomes markedly heavy tailed (Figure 4). We note that the performance of the LS algorithm shows little variation between Bats fixed to the wall or in the office centre. This is due to the fact that the rate of outliers is largely unaffected by the Bat’s position. The ToM algorithm shows actual error similar to the RANSAC algorithm. However, it is evident for Bat 5 that the selection heuristic breaks down and produces answers with an average 1 metre of error. This is due to the weak geometric arrangement of the closest receivers to this Bat. We can expect that performance of the RANSAC and ToM algorithms to vary depending on the geometry of the ceiling receivers contributing to sighting information. Table 3 shows the strength for each algorithm, calculated as the average discrepancy between the error estimate and the actual error for those sightings where the algorithm gave a dependable result. This metric is designed to identify algorithms that achieve dependability through overly large error estimates. An algorithm with a low strength distance is one that produces error estimates that bound tightly the actual error. As is shown in the table the high dependability of the NLR algorithm comes at the price of a poor value for strength. The INLR algorithm produces better strength readings but this reduces its dependability because of the increased likelihood of a reading falling outside the error bound. The computation times for RANSAC and INLR were approximately 0.1ms for each sighting on our test platform whereas the computation times for the ToM and LS algorithms were approximately 0.02ms per sighting. The LLS algorithm performed best, completing each calculation in an average of 0.01ms. This suggests that the LLS algorithm is a good candidate for low resource location systems if there is rarely a planar arrangement of sensors.
(a) Top Down View
(b) Side View Figure 6: The resolved position for Bat 9 using the NL and LLS algorithms.
5.
CONCLUSIONS
We have evaluated five popular positioning algorithms using experimental data collected over a four month period. Of these algorithms, iterative non-linear regression (INLR) offers the best accuracy but is an order of magnitude slower in execution than the other simpler algorithms, and the associated predicted error may not be truly reliable. Comparison with the NLR algorithm shows the results of rejecting rather than tolerating multipathed measurements, but the latter algorithm is undeniably faster since it is a subset of the operations required for INLR. LLS is popular for ease of implementation but these tests have highlighted an inherent weakness that favours the use of NLR. We have introduced two metrics: dependability and dependability strength which can be used to assess the performance of dependable algorithms. The optimal algorithm for a given purpose depends upon the constraints in the system. Whilst INLR offers higher precision, it has a more computation-demanding nature, which means the simpler algorithms may be favourable for small embedded platform (assuming the drop in precision is acceptable to the intended applications). It is important to realise, however, that the output from any positioning algorithm can only ever be as good as its inputs. If an algorithm receives purely multipathed signals, for example, it cannot hope to recognise the erroneous signals since all may agree on a reflected position. Within the Bat system, we have observed this ambiguity when users sit close to a vertical screen, encouraging all signals to specularly reflect from the screen before reception. In future work we hope to extend the simpler algorithms to make more intelligent groupings of data. For example, RANSAC starts by forming three randomly chosen inputs. An improvement may be to select the inputs based on their geometry (GDOP) about a low granularity estimate of the position of the locatable. Such approaches promise to increase the efficiency of algorithms. We plan to expand the error estimation techniques for each algorithm (perhaps by including sensor GDOP) in order to improve their dependability and strength. Code for the algorithms discussed here are available within the open source C++ software library named NLMaP, available from http://www.cl.cam.ac.uk/Research/DTG/.
6.
ACKNOWLEDGEMENTS
This work was supported by the EPSRC. Grateful thanks are due to Professor Andy Hopper for his support and guidance, and to Alistair Tse for his help with the laser survey equipment. Thanks also to the referees for their useful comments.
7.
REFERENCES
[1] P. Bahl and V. N. Padmanabhan. RADAR: An in-building RF-based user location and tracking system. In INFOCOM 2, pages 775–774, 2000.
[2] M. Billinghurst and H. Kato. Collaborative mixed reality. In Proceedings of the First International Symposium on Mixed Reality, pages 261–284, 1999. [3] D. L. de Ipiña, P. R. S. Mendona¸, and A. Hopper. TRIP: a low-cost vision-based location system for ubiquitous computing. Personal and Ubiquitous Computing, 6(3):206–219, May 2002. [4] M. A. Fischler and R. C. Bolles. Random sample consensus: A paradigm for model fitting with applications to image analysis and automated cartography. Communications of the ACM, 24(6):381–395, June 1981. [5] K. P. Fishkin, B. Jiang, M. Philipose, and S. Roy. I sense a disturbance in the force: Unobstrusive detection of interactions with rfid-tagged objects. In UbiComp 2004: Ubiquitous Computing, pages 268–282, 2004. [6] D. Fox, S. Thrun, W. Burgard, and F. Dellaert. Particle Filters for Mobile Robot Localization. In A. Doucet, N. de Freitas, and N. Gordon, editors, Sequential Monte Carlo Methods in Practice, New York, 2001. Springer. [7] R. K. Harle. Maintaining World Models in Context-Aware Systems. PhD thesis, University of Cambridge, 2004. [8] J. Hightower and G. Borriello. A survey and taxonomy of location systems for ubiquitous computing. Technical Report UW CSE 01-08-03, University of Washington, Aug 2001. [9] Y.-B. Ko and N. H. Vaidya. Location-Aided Routing (LAR) in mobile ad hoc networks. Wireless Networks, 6(4):307–321, 2000. [10] J. Krumm, S. Harris, B. Meyers, B. Brumitt, M. Hale, and S. Shafer. Multi-Camera Multi-Person Tracking for EasyLiving. In Proceedings of the Third International Workshop on Visual Surveillance, July 2000. [11] D. E. Manolakis. Efficient solution and performance analysis of 3-D position estimation by trilateration. IEEE Transactions on Aerospace and Electronic Systems, 32(4):1239–1248, Oct. 1996. [12] Y. Nishida, K. Kitamura, T. Hori, A. Nishitani, T. Kanade, and H. Mizoguchi. Quick realization of function for detecting human activity events by ultrasonic 3d tag and stereo vision. In Second IEEE International Conference on Pervasive Computing and Communications, pages 43–54, Mar. 2004. [13] N. B. Priyantha, A. Chakraborty, and H. Balakrishnan. The Cricket location-support system. In Mobile Computing and Networking, pages 32–43, 2000. [14] R. Want, A. Hopper, V. Falcão, and J. Gibbons. The Active Badge location system. ACM Transactions on Information Systems (TOIS), 10(1):91–102, January 1992. [15] A. Ward. Sensor-driven Computing. PhD thesis, University of Cambridge, 1998. [16] A. Ward, A. Jones, and A. Hopper. A new location technique for the active office. IEEE Personal Communications, 4(5):42–47, Oct. 1997.