Int. J. Arts and Technology, Vol. X, No. X, xxxx
Evaluating motion: spatial user behaviour in virtual environments Anders Drachen* Institute for Informatics, Copenhagen Business School/Game Analytics Technologies, Howitzvej 60, 2200 Frederiksberg, Denmark Fax: +45 3815 2401 E-mail:
[email protected] *Corresponding author
Alessandro Canossa IO Interactive/IT University of Copenhagen, Kalvebod Brygge 4, 1354 Copenhagen K, Denmark Fax: +45 72185001 E-mail:
[email protected] Abstract: User-behaviour analysis has only recently been adapted to the context of the virtual world domain and remains limited in its application. Behaviour analysis is based on instrumentation data, automated, detailed, quantitative information about user behaviour within the virtual environment (VE) of digital games. A key advantage of the method in comparison with existing user-research methods, such as usability- and playability-testing is that it permits very large sample sizes. Furthermore, games are in the vast majority of cases based on spatial, VEs within which the players operate and through which they experience the games. Therefore, spatial behaviour analyses are useful to game research and design. In this paper, spatial analysis methods are introduced and arguments posed for their use in user-behaviour analysis. Case studies involving data from thousands of players are used to exemplify the application of instrumentation data to the analysis of spatial patterns of user behaviour. Keywords: game design; instrumentation; game development; user behaviour; metric; gameplay metric; GIS; geographic information system; user experience; player experience; spatial user behaviour; virtual environment. Reference to this paper should be made as follows: Drachen, A. and Canossa, A. (xxxx) ‘Evaluating motion: spatial user behaviour in virtual environments’, Int. J. Arts and Technology, Vol. x, No. x, pp.xx–xx. Biographical notes: Anders Drachen is a Visiting Researcher with the Institute for Informatics, Copenhagen Business School and a Developer at Game Analytics Technologies, Denmark. His work focuses on user research in game development and game research, including game testing, user testing, user experience analysis, psychophysiological measurements, heuristic analysis, behavioural analysis and data visualisation. He collaborates with a range of game development companies to improve user-oriented testing in game development. Copyright © 20xx Inderscience Enterprises Ltd.
1
2
A. Drachen and A. Canossa Alessandro Canossa works from IO Interactive and the IT University of Copenhagen. His work focuses on developing methods for locating, evaluating and designing for, patterns of behaviour in computer game players. He is working with a range of game development companies to improve useroriented design methods in the industry.
1
Introduction
User-behaviour analysis is a common method for evaluating patterns in the behaviour of software users and customers of websites (Brainard and Becker, 2001; Hurst et al., 2007; Kort et al., 2005; Mellon, 2009; Renaud and Gray, 2004; Whiteside et al., 1982). The approach has been adapted only in the last decade to the context of digital games and only in recent years applied beyond top–down, single-variable analyses (e.g. Coulton et al., 2008; DeRosa, 2007; Drachen et al., 2009; Hoobler et al., 2004; Kim et al., 2008; Mellon, 2004, 2009; Swain, 2008; Thompson, 2007; Tychsen and Canossa, 2008). Quantitative behaviour analysis is generally based on user instrumentation data, essentially information about user behaviour within the virtual environment (VE) of digital games, logged from the game software itself (e.g. Isbister and Schaffer, 2008; Kim et al., 2008; Lazzaro and Mellon, 2005). Instrumentation data can be used to elicit highly detailed, quantitative information about the behaviour of millions of players. It, therefore, forms a perfect companion method to the qualitative and semi-quantitative user-research methods currently employed in game evaluation, such as usability- and playabilitytesting. Behaviour analysis is also well-suited to handle the high complexity of user– game interaction in contemporary commercial digital games. Because players operate in spatial, VEs, and experience games via these, analyses that operate using the spatial domain of the logged data would appear to be useful in analysing player behaviour. This is, however, a venue of research and development that has received limited attention in academia as well as the game industry, mainly due to the relative recent adaptation of instrumentation data analysis in game research and development (DeRosa, 2007; Kim et al., 2008; Mellon, 2009; Swain, 2008). In this paper, existing work on behaviour analysis via instrumentation solutions in digital games is briefly reviewed and summarised. Spatial analysis of gameplay metrics is introduced as a novel approach in the toolbox of user-experience testing and research. Spatial analysis of player behaviour using gameplay metrics is hitherto an approach that has received virtually zero attention by the academia and games industry, with current work using spatial gameplay metrics focusing solely on visualising data and with two exceptions (Drachen and Canossa, 2009a; Hoobler et al., 2004) using single variables at a time (e.g. Thompson, 2007). In this paper, the state of the art of gameplay metrics methodology is advanced by introducing methods for performing spatial analysis, including multi-variate operations, with case studies presented to evaluate and evidence the usefulness of these approaches and provide guidelines for how to utilise spatial gameplay metrics. This paper is breaking new ground in moving the analysis and use of game metrics from the non-spatial domain, e.g. looking at playtime graphs, levelling time diagrams and player placement in revenue streams, to the spatial domain in which players actually experience 3D games.
Evaluating motion
3
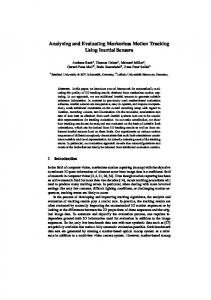
Furthermore, geographic information systems (GISs) are introduced as a tool for performing spatial analysis (Figure 1). A GIS is a computerised data management system used to capture, store, manage, retrieve, analyse, query, interpret and display spatial information in the form of, e.g. maps, reports and charts (DeMers, 2008; Drachen and Canossa, 2009a; Longley et al., 2005). GISs have, to the best knowledge of the authors, not previously been applied within the digital games domain, and the adoption of these comprehensive geographical analysis packages represent a step forward in the research and applied work with gameplay metrics. It should be noted that the current paper is in part based on Drachen and Canossa (2009a), where case study 3 was originally presented. In this paper, additional detail and depth have been added to this case study, and two new case studies are presented, as well as additional material on metrics analysis. Emphasis is placed on the case studies as these provide novel methods and tangible evidence for the usefulness of adopting a spatial view on gameplay metrics. The case studies stem from actual game productions and research done in collaboration between academia and industry. The case studies are drawn from the development of two different major commercial game titles, Tomb Raider: Underworld (TRU) (Crystal Dynamics, 2008) and Kane & Lynch: Dog Days (KL2) (IO Interactive, to be released 2010). The case studies provide practical examples of the application of instrumentation data to the analysis of spatial patterns in user behaviour, in the context of game research and design. Additionally, for each case study, considerations are presented about the benefits obtained from running the analyses outlined. Figure 1
The working environment of ArcMap, the component of ArcGIS used for visualising and analysing spatial data (see online version for colours)
Note: The left window contains information about data layers and sources. The middle window contains a list of toolboxes, the rightmost shows the current working environment, here a section of a level map from the computer game KL2.
4
A. Drachen and A. Canossa
The case studies focus on how player behaviour analysis can assist with game research and development and be integrated in a practical work context. While the case studies presented here are specific to TRU and KL2, they are focused on generic in game events, such as player death and weapon use, gameplay features are common in many games, and the approach is directly applicable to any game or VE, where players control a single character, i.e. the majority of current major commercial game titles (‘AAA-titles’). Additionally, they showcase behaviour analysis in mid-production phases as well as following game launch and lastly cover examples of analysis involving from one to thousands of players. The case studies expand the field by focusing on analysis rather than simply visualisation of spatial data. It is shown how multiple variables can be mapped spatially and forms the basis for performing analyses, thus advancing current methodology beyond the current state of the art.
2
State of the art
The space given to the case studies means that the state-of-the-art review section is necessarily brief; however, the most relevant publications are included. Readers are referred to the recent and more thorough reviews of Drachen and Canossa (2009a,b), Kim et al. (2008) and Mellon (2009) of previous research on using instrumentation data to analyse user behaviour in digital games. In brief, the use of automated collection and analysis of instrumentation data in game development and research has emerged during the last decade (DeRosa, 2007; Drachen and Canossa, 2009a,b; Kim et al., 2008; Mellon, 2009; Swain, 2008; Thawonmas and Iizuka, 2008), with a notable exception in the monitoring of economies, player behaviour and game balancing of massively multiplayer online games (MMOGs), such as Age of Conan and Dungeons & Dragons Online (e.g. Mellon, 2009). There are, therefore, relative few methods developed for integrating them in game testing and game design/development, and little knowledge as to what data that should be tracked, when and how this varies across games, despite efforts within the industry to increase awareness of the potential in metrics-driven development, notably for multi-user online, persistent environments (e.g. Lazzaro and Mellon, 2005). The analysis of gameplay metrics in relation to the spatial behaviour of the player within the actual gaming environment remains largely unexplored, providing the underlying motivation for the work presented in this paper. Of particular interest, here is the form of instrumentation data that pertain to the behaviour of the players themselves. These are normally referred to as gameplay metrics. Gameplay metrics form objective data on the interaction between players and games and potentially any action the player takes while playing can be measured, including which buttons that are pressed, the movement of player-characters within the game world or which weapons that are used to eliminate opponents. Gameplay metrics are comparable to user-initiated events (Kim et al., 2008), although these also cover low-level data, such as keystrokes, whereas gameplay metrics are normally referred to when discussing higher-level user input, i.e. in game behaviours and menu navigation. On a side note, given the action–reaction relationship between the player and game software, the operations initiated by a game engine or game server (game-initiated events), are sometimes necessary to integrate in behaviour analyses as well.
Evaluating motion
5
Gameplay metrics analysis allows user-research professionals to examine player behaviour at multiple levels of resolution. Furthermore, via such analysis, it is possible to recreate the playing experience of the player in detail. Being able to model the navigation of players through a game environment is of interest to game development for a number of reasons, not the least because it allows designers to observe how their games are being played. Traditional methods of user-testing computer games can locate problems with, e.g. gameplay, a fair degree of precision (e.g. Isbister and Schaffer, 2008; Pagulayan et al., 2003). However, integrating gameplay metrics permit the second-by-second behaviour of the players to be modelled, enabling more detailed explanations for the observed behaviours. A distinct advantage of gameplay metrics is that these can be collected from the natural habitats of the users, i.e. from client installs players who have installed the game on their PC/console. Behaviour data collected remotely are unbiased by environmental effects of laboratory-based research (Dumas, 2003; Hilbert and Redish, 1999; Kuniavsky, 2003) and permit long-term monitoring of player behaviour. Instrumentation data are more precise and detailed than other methods used in the natural habitats of players, e.g. personal logging, however, cannot provide information about the psychology of the player during play. Given the detailed behavioural analysis that can be performed via gameplay metrics, they are ideally suited as companion data to measures of user experience, permitting the linking of detailed measures of user behaviour with the perceived user experience from playing particular segments of a digital game. This is not an area in which there exists substantial published knowledge (Canossa and Drachen, 2009; Kim et al., 2008; Lazzaro and Mellon, 2005).
2.1 Spatial gameplay metrics Spatial gameplay metrics are gameplay metrics with associated navigational data, e.g. locations, lines or areas. Given that the way players experience games is via navigating through and interacting with game worlds, analysing spatial behaviour is of key interest to evaluating user experience (Blythe et al., 2004) of computer games. Gameplay metrics operating in the spatial environment of games can provide detailed information about the behaviour of the person playing the game, which are more accurate than that obtained using other user-research methods. As tool for analysing player behaviour, gameplay metrics supplement existing methods of games-based user research, e.g. usability testing (measuring ease of operation of the game) and playability testing (exploring whether players have a good experience in playing the game) (Dumas, 2003; Hilbert and Redish, 1999; Isbister and Schaffer, 2008; Jørgensen, 2004; Kuniavsky, 2003; Medlock et al., 2002; Pagulayan et al., 2003; Pagulayan and Keeker, 2007; Schultz et al., 2005) by offering insights into how people are actually playing the games under examination. In all of these tests, game heuristics (Desurvire et al., 2004; Federoff, 2002; Korhonen and Kovisto, 2007) can be utilised as underlying design principles to guide analysis. Previous work on spatial behavioural metrics is limited, even when moving outside the games domain to consider virtual world environments in general. Spatial gameplay metrics are mainly applied in visualisations and usually of single variables. Such visualisations represent the first step in spatial behaviour analysis. One of the few published examples of actual analysis of spatial gameplay metrics is Hoobler et al. (2004) who developed Lithium, an application designed to visualise basic information from the game Return to Castle Wolfenstein: Enemy Territory. The application is however
6
A. Drachen and A. Canossa
restricted to the game it was built for and can only visualise variables that have been coded into the application. It is, therefore, not flexible across games or in terms of adding new variables and cannot adapt to changing demands without the addition of additional code and specialised knowledge. Additionally, it does not permit analysis across layers of variables. Börner and Penumarthy (2003) utilised the education-oriented ActiveWorlds platform to design an application aimed at visualising the evolution of virtual communities in multi-user online VE. Their system is capable of recording spatial and temporally referenced user interactions, e.g. navigation, object manipulation as well as chatting between users. Data are visualised in different ways. For example, navigation data are mapped on top of 2D maps of the environment, while chat data are visualised as 3D data hills, with peaks indicating locations with a high density chatting. Outside of the games domain, Chittaro and Ieronutti (2004) and Chittaro et al. (2006) developed an application termed VU-flow, engineered towards tracking the movement and orientation of agents operating in VE. The data logged by the system can be visualised in different ways, and some analysis is also permitted, e.g. locating most visited areas, however, the system only operates with the movement-related aspect of user behaviour. Within location-aware games, e.g. those using mobile phones as the hardware platform, some work has been carried out tracking user location (e.g. Coulton et al., 2008), which in principle can be applied to VE. Additionally, Thawonmas and Iizuka (2008) worked with visualisation of player behaviour in MMOGs. Finally, there is a wealth of publications on visualising web navigation and interaction between users and productivity software (e.g. Brainard and Becker, 2001; Cadez et al., 2000). The most advanced work in spatial behaviour analysis in computer games stems from Microsoft Game User Research Group, who have developed a setup titled TRUE (Kim et al., 2008). The system permits the mapping of basic point-based information and linking this to attitudinal data collected from surveys during gameplay. The system is interactive and permits deep probing of the contained data, which can include screen capture of video recordings of play-testers. The specific abilities of the system’s capacity for spatial analysis remain largely unpublished. GISs, introduced above, offer a unified framework for spatial analysis, whether in 2D or 3D (Longley et al., 2005). In a GIS, a map links map features with attribute information, permitting user-behaviour data to be plotted on, e.g. level maps, and the data analysed and visualised. Since GIS software is specifically engineered towards analysis of data and their underlying attributes in a spatial environment, it is capable of encompassing virtually any spatial analysis. In practice, gameplay metrics are added in the form of layers on top of a level or zone map (Figure 1). Unlike most academiadeveloped systems for visualising/analysing instrumentation data logged from player behaviour, which are too inflexible for general analytic/testing work in the industry (or academia), GISs have been developed within a range of industries and is therefore engineered towards being flexible for different uses. This makes these systems highly useful in games research and production. In summary, the amount of development of gameplay metrics-based methods applied to the games domain and the applicability to research and industrial development is limited, and generally, focused on character-based games (games where the player controls a single avatar or character). Additionally, applications such as those developed by Börner and Penumarthy (2003), Chittaro et al. (2006), Fua et al. (1999), Hoobler et al. (2004) and Thawonmas and Iizuka (2008) focus on visualising rather than analysing behaviour, and are game/VE platform-specific. The systems are inflexible and not easily
Evaluating motion
7
portable across environments. In comparison, contemporary GIS software is designed to be flexible, capable of meeting the varied demands of spatial behaviour analysis in digital games.
3
Case study 1: weapon usage in KL2
In the first case study, the focus will be on spatial analysis of the behaviour of one or a few players. These, generally, permit more in-depth understanding of the experience of the player compared to analyses, involving large samples of players (Drachen and Canossa, 2009b). The case study has been selected to show how player behaviour data can be utilised during mid-development and joined with other sources of user-research data. KL2 is a shooter-type game currently in development at IO Interactive, a subsidiary of Square Enix Europe. It is the second game in the series, following KL2. In the game, the player takes control of the criminal Lynch. In the game, the player needs to navigate a series of missions in order to complete the game storyline. The game is brutal and the language is harsh, depicting the more hard-core element of the criminal world with abandon. In terms of gameplay, the game follows previous shooters in that the player controls a single character and mainly has to worry about staying alive, eliminate enemies and solve specific tasks. The case study focuses on showing how instrumentation data can be applied to examine player behaviour as they navigate through the game environment. One of the primary purposes of these types of behaviour analyses is to locate ‘trouble spots’ where the gameplay is too difficult or challenging, or where there is a technical bug operating. Different variables associated with movement are used simultaneously; thus the approach expands and improves on basic navigation mapping (e.g. Chittaro and Ieronutti, 2004; Chittaro et al., 2006). The case studies, therefore, hold direct relevance to all behaviour studies in virtual world environments, where navigation forms a part of the gameplay, and the player controls a single/small group of avatars. In shooter games, such as KL2, using and managing the weapon inventory of the player character is one of the primary game mechanics. From this follows that controlling the weapon range and ammunition supply of the players, via game design, form a means for controlling their behaviour and thus their playing experience. For example, if the player has access to short-range weapons and is up against faraway enemies, the player will be driven forward into a roaming style of behaviour (similar to solitary predators such as leopards). The player experience will, in this case, be intense, up-close and personal. Conversely, providing the player long-range weapons afford the player the opportunity to engage in more static behaviour, using the weapon’s range, to make contact with the enemy from a safe distance and/or position (comparable behaviour to a sniper). In this case, the experience is focused more on skill rather than visceral experience but can nonetheless be equally gratifying. In terms of game design, the challenge is to provide the player the right experience in the right situations or allowing players to choose their own experience whilst still providing interesting choices. Balancing weapon design (and ammunition supply) in this regard is a challenging aspect of designing shooter-type games. Additionally, it is a feature that is hard to usertest using traditional approaches, such as usability- or playability-testing (Davis et al., 2005; Kim et al., 2008; Pagulayan and Keeker, 2007; Pagulayan et al., 2003), e.g.
8
A. Drachen and A. Canossa
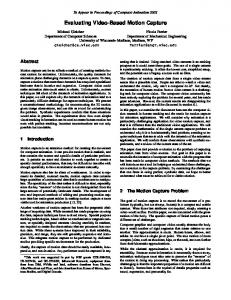
because players can have a hard time, describing ‘weapon behaviour’ in concise detail or remembering the details of their weapon usage. This is, however, possible via visualising weapon usage metrics. To examine weapon usage in KL2, instrumentation data from three play sessions were loaded into the native metrics visualisation system developed at IO Interactive called QuickMetrics. QuickMetrics is a custom-made tool for visualising specific forms of instrumentation data, drawing inspiration from the TRUE system of Microsoft game user-research labs (Kim et al., 2008). Unlike ArcGIS, it does not permit spatial analysis of data, only visualisation. However, the system is faster to work with, designed to permit visualisation of basic behaviour data immediately following a playtest session, which permits the visualisations to be used in conjunction with post-session interviews with the testers. It also permits user-research experts at IO Interactive to modify on-the-fly user tests if they can see there are technical bugs in the game, e.g. preventing player progress. The visualisation of the weapon using data shows two different patterns of behaviour in the beginning of the level (Figure 2, Section 1) and in the end (Figure 2, Section 2). In Section 1, the players kill at much shorter ranges, using a variety of weapons. They also move around, making the killing shots from a variety of locations (orange lines). The exception is the bottom–middle of Section 1, from where all players make several kills with the same weapon (turquoise lines). In Section 2, the kills are made almost exclusively using the same weapon (red lines) and from long distances. Furthermore, players do not move around a lot, using relatively few areas as the places to shoot from, across the three testers. In summary, the two sections show behaviour that vary on weapons used, weapon ranges and movement pattern. Figure 2
Enemy kills on a KL2 level in development (see online version for colours)
Sector 2
Sector 1
Source: Image © IO Interactive. Note: Data from three play-troughs by three different players are included. The green dots are the positions of the players when they make a killing shot, eliminating an AI-controlled enemy. Coloured lines represent the lines of fire (different colours represent different weapons used), and the red dots indicate the locations of enemies who are killed by the players.
Evaluating motion
9
Adding additional variables to the analysis provides additional information about the player’s behaviour in Sectors 1 and 2 (Figures 3 and 4). The movement paths of the players show how they are under much more pressure in Sector 1 as compared to Sector 2. This is also reflected in the higher number of player deaths in Sector 1 as compared to Sector 2. The erratic roaming spatial behaviours in Sector 1 also serve to indicate high-intensity gameplay. Finally, the player is shooting enemies at short distances, using a variety of weapons. Sector 2 is characterised by more ordered progress, less stress and measured elimination of enemies at long ranges. Interviews of the players support this impression, indicating that they felt a high-stress and high-challenge situation in Sector 1, whereas in Sector 2, the gameplay was less stressful, eliciting feelings of competence. The players chose to consciously stay in the same spot to de-stress (the specific questions asked to the players and their exact responses cannot be described because KL2 is still a game in development, and therefore some user-research data remain confidential). In the current case, the player behaviour was as intended by level designers; however, as noted by Thompson (2007) and Kim et al. (2008), players often do not behave as intended in the game design. This type of analysis is useful in catching situations where player behaviour deviate from that intended in the design, with potential negative effect on the player experience. Using machine learning or neural networks (Drachen et al., 2009), it is possible to generate tools to auto-detect different types of player experiences, as in here ‘under pressure’ vs. ‘sniper’experiences. Figure 3
Sector 1: (Left) Sector 1 extracted from Figure 2, showing locations of players (green dots) and enemies (red dots) at the time the latter are killed, as well as weapon type used (colour of line). (Middle) Player movement path through the sector, displaying a virtually random pattern (See online version for colours)
Source: Images © IO Interactive. Note: The health of the player is indicated via the colour of the line: if the line is green, player character health is from 100% to 20% of the maximal; yellow signifies health at 5–15% of the maximal and red signifies health between 0% and 5%. (Right) locations of player death in the sector.
10
A. Drachen and A. Canossa
Figure 4
Sector 2: (Left) Sector 2 extracted from Figure 2, showing locations of players (green dots) and enemies (red dots) at the time the latter are killed, as well as weapon type used (colour of line). (Middle) Player movement path through the sector, displaying consistent and non-random movement behaviour across the three players (see online version for colours)
Source: Images © IO Interactive. Note: The health of the player is indicated via the colour of the line: if the line is green, player character health is from 100% to 20% of the maximal; yellow signifies health at 5–15% of the maximal and red signifies health between 0% and 5%. (Right) locations of player death in the sector.
Irrespective of whether a manual or automated approach is used, the goal is to analyse the player experience and therefore metrics-based analyses should be combined with userexperience data, to confirm the hypothesis that are built using the player behaviour data.
4
Case studies 2 and 3: TRU
In the next two case studies, metrics data were derived from players of TRU (Figure 8). Tomb Raider forms one of the oldest surviving franchises in game development, and TRU is the eighth instalment in the series (not counting versions developed for handheld devices). The game is played from a third-person perspective and centres on the main player character, Lara Croft, an internationally recognised character that can be described as a mixture between an action heroine and Indiana Jones. TRU is like its predecessors a 3D platform game, where the player needs to navigate in three dimensions, controlling the movements and behaviours of Lara Croft. The game involves large amounts of jumping and solving spatial puzzles, as well as navigating exotic environments such as the Arctic and Mexico while avoiding hostile creatures. TRU consists of seven main levels (and a prologue). Via the Square Enix Europe Metrics Suite, data can be tracked from each of these levels or segment of a level. One of these segments is Valaskjalf, one of the most complex puzzle/trap areas of the game and an area that Crystal Dynamics used to market the game before it was launched in the fall 2008. The level segment is part of the Jan Van Mayan Island-level and is shaped as a huge hall with narrow pathways leading to and from a series of side rooms. Three of these contain machinery that the player needs to activate/deactivate; four contains traps and toxic water the player risks falling into. As a further challenge factor, massive stone hammers or rams swing across the room, and the player needs to ride on top of these in order to access the machine rooms. Finally, the level contains abundant enemies in the
Evaluating motion
11
form of giant albino tarantulas, flocks of bats and Viking/yeti thralls, a form of undead which spit a poisonous goo. The data used for the case studies of TRU were logged using the Square Enix Europe Metrics Suite, developed by the Online Development Team. Due to the confidential nature of metrics data from commercial game titles, some facts about the underlying dataset cannot be revealed. For example, the precise dates that the data were generated, except noting that it was during November 2008. The data are streamed directly from the user’s Xbox 360 to the Square Enix Europe servers, at the times of actual playing. A random sample of approximately 28,000 players were selected, all of whom had played the game in the period the data were selected from. Due to ethical concerns, no personal information was recorded about the players. The raw data included information about completion times for each level of the game, the number of times each player died in each level and where, the causes of death, weapon usage, as well as the locations and frequencies where players requested help from the native help-on-demand (HoD) system. This is a resource built in to the game that provides hints to the players if they have problems solving one of the games of 200+ puzzles and navigational challenges. The case studies focus on two different approaches towards evaluating the level of challenge in TRU. This is a key question in user-behaviour testing in digital games, e.g. answering questions such as whether there are areas where the level of challenge is too high or low. Instrumentation data provide an opportunity to address this kind of question by analysing where players die, and from what causes, or how they use the game to help system (if present), or even their spatial navigation patterns. Any areas are found where players die consistently and repeatedly, or where players ask for a lot of help, or run around randomly, could indicate sections of the game that are too challenging. Contrarily, if segments of the game that are designed to be hard to play show very few deaths, or deaths caused by the wrong reason, minimal help to requests or movement in straight lines that bar any exploration, can also be indicative of design problems. Evaluating challenge in game design can be approached from a spatial or a nonspatial angle. For example, if non-spatial metrics are used, analyses can be performed on the relative frequencies of certain causes of death or help-requests (Figure 6). Using spatial analysis, it is however possible to map where these events occur, and thereby make stronger inferences about why they occur.
4.1 Case study 3: HoP in TRU One of the major game mechanics of TRU is puzzle-solving. The game series is especially famous for navigational puzzles in 3D, e.g. a door that requires specific switches to be pressed in order to open. There are more than 200 of these puzzles in the game, which the players have to solve in order to progress through the game story. To accommodate the varied interests of players (some may not care for puzzle solving) and to avoid player frustration, TRU features a HoD system which players can consult in order to obtain help with solving puzzles. The player can either request a hint about how to solve the puzzle or a straight answer. Information about which puzzles that players asked for help with and where they were standing at the time of interacting with the HoD system were extracted from the Square Enix Europe Metrics Suite, for the sample of TRU players described above. Drachen et al. (2009) reported from a sample of 1,365 players that players generally either request both hints and answers from the HoD system or no help at all, for specific puzzles. It was, therefore, decided to combine the
12
A. Drachen and A. Canossa
hint and answer requests for each puzzle. Drachen et al. (2009) further reported that the average number of HoD requests per player in TRU was 4.2 per game level, 29.4 for the entire game. As mentioned above, Valaskjalf is one of the more uncompromising segments of TRU, featuring a massive hall with gigantic stone hammers, moving like pendulums across the hall. From the sample of ca. 28,000 players, 2,782 HoD requests were logged (3,801 including non-English players), distributed among 11 puzzles that the players asked for help with. Seven of these focuses on the hammers, with six of these centring on the fact that the player actually needs to get on top of the hammers, riding one or more to get to a specific destination. For example, jumping on top of a hammer and riding it to one of the machine rooms in the level (the three side rooms with dark grey colour in Figure 5). This puzzle alone accounted for 1,029 HoD requests, or 37% (Hammer 6 in Figure 6). The remaining four puzzle players requested help which are focused on puzzles that relate to a counterweight puzzle (counterweight 1 and 2 in Figure 6), as well as two related to level exploration (Bike and Passages in Figure 6). The frequencies indicate that the players have the most problem with figuring out how to use the hammers, and the analysis can be used as a basis for evaluating the puzzle challenge level. Figure 5
A screenshot from the Valaskjalf section of the Jan Van Mayan Island level of TRU (see online version for colours)
Source: image © Crystal Dynamics. Note: The narrow passages, and the giant hammer swinging back and forth across the room. The player needs to navigate from one end of the room to the other, in the process using seven side rooms.
Evaluating motion Figure 6
13
Pie chart of the distribution of HoD requests for the Valaskjalf map in TRU (see online version for colours)
The problem can also be viewed spatially, e.g. via creating a heatmap of HoD requests, or mapping the locations players are standing when asking for help with specific puzzles (Figure 10 (right)). Heatmaps are known from a variety of games, e.g. Halo 3, Half-Life 2, Team Fortress 2, and are the most popular example of spatial visualisation in digital games today. In this case, a grid-based heatmap was designed. Categories were defined using natural breaks in the input data. ArcGIS uses a frequency diagram of the grid cell values to place the breaks in the categories. This is useful in ensuring a heatmap that highlights the data pattern rather than arbitrarily defined categories. If, e.g. the distribution is positively skewed, the breaks between categories and thus cell colours will be closer towards the lower values of the data, with more distance between the higher counts. These analyses reveal several areas with very high densities of HoD requests, indicative of areas where players are in doubt about how to proceed. Looking at where players ask for help with specific puzzles (Figure 10 (left)), can assist in evaluating which puzzles that are causing the players trouble and where in the level segment. It is also apparent that some puzzle HoD requests are highly localised. This is typical in situations where the player is facing a blockade of some kind, e.g. a door, or the road ahead is not obvious. Alternatively, HoD requests for a specific puzzle can be distributed, as is the case with the need to ride the hammers in the Valaskjalf level segment. This is needed three times to access each hammers machine room (the rooms without toxic blue water). The distribution of location data shows a pattern of three lines, each coinciding with the path of one of the hammers (Figure 7 (left)). This could be indicative of a problem with the players in figuring out how to navigate between these rooms using the hammers.
14 Figure 7
A. Drachen and A. Canossa (Left) Locations players are standing in when asking for help with two different navigational puzzles in Valaskjalf (see online version for colours)
Note: Light green indicators: Hammer 1 in Figure 6 (469 counts, 17% of the total HoD requests). Brown indicators: Hammer 6 in Figure 6 (1,029 counts, 37% of the total HoD requests). (Right) A heatmap of all HoD requests for Valaskjalf puzzles (2,781 events). Scale from light green (few requests) to dark red (high number of requests).
4.2 Case study 3: causes of death in TRU This case study was originally described in Drachen and Canossa (2009a); however, additional detail has been included. The case study focuses on the dangers Lara Croft faces when navigating the environment of TRU – notably, the ever-present risk of falling from the precarious heights that she needs to navigate in order to progress through the game. Other sources of death include different kinds of mobile enemies, including animals, monsters and mercenaries. Importantly, the environment itself can be hazardous, and the player regularly needs to navigate over, under or across, e.g. fires, electrical hazards, toxic water or just swim through an ocean filled with sharks. The Jan Van Mayan level of TRU, of which Valaskjalf forms a part, is characterised by a large number of navigational hazards: falling constitutes the major threat in the level, with 53% of the 50,060 death events recorded occurring for this reason (Figure 8). In comparison, only 1,789 deaths were caused by enemies (3.6% of the total deaths). Grenades launched by human mercenaries and Viking/yeti thralls were the most effective enemies (1,594 deaths combined), with bats and giant albino tarantulas, despite being fairly numerous in the level, constitutes only 195 deaths combined. About 32.15% of the deaths were caused by traps (16,091 death events).
Evaluating motion Figure 8
15
A pie chart showing the distribution of causes of death in the form of specific damage types in the Jan Van Mayan Island level of TRU (based on 5,060 death events) (see online version for colours)
Source: Drachen and Canossa (2009a). Note: The three major causes of death are falling, damage from electricity and heavy refers to damage from the machinery in the level (grinders).
These data indicate that navigating the environment and avoiding traps form the major challenge of the level. This summary provides information about the overall pattern of death in the level and can already at this level inform design. However, it does not address the question whether there are any problematic hotspots in the spatial pattern of the death events, or whether there are sections of the level where players die for the same reason over and over, or alternatively are overwhelmed with numerous different hazards, potentially causing frustration (Drachen and Canossa, 2009a,b). In approaching these questions, the first step is to produce a heatmap based on the locations of the death events. In the current case, a heatmap was produced for Valaskjalf by dividing the level segment into grid cells, using ArcGIS to sum the number of death events occurring in each grid cell and applying a graded colour scale to the result (Figure 9). The heatmap indicates four areas of the level segment where the death count in a cell reaches the maximum of 3,050 (Figure 9). The heatmap is as a visualisation useful to evaluate the lethality of different areas in game worlds. However, it does not inform about the cause of death. To evaluate where different causes of death, such as falling, environmental dangers and computer-controlled enemies occur (and whether they occurred as intended by the game’s design), visualisations need to be produced for each of these. These visualisations can be subjected to overlay analysis, in order to discover where death events occur primarily due to one type of danger, or many. Such areas represent sites of high challenge to the players and therefore form targets for evaluation about whether their challenge level is too high. In the current case, several layers each containing the distribution of one cause of death, created using the same cell grid, were overlain, and ArcGIS instructed to perform a count across these layers. A total of eight causes of death were included (including death by falling, via contact with enemies and environment causes, such as traps). The result of the overlay analysis shows that most areas of the map unit have one cause of death. With one exception (area 3 in Figure 9 (left)), the areas with one-two causes of death cover the most dangerous areas of the level segment.
16 Figure 9
A. Drachen and A. Canossa (Left): Grid-based heatmap created using ArcGIS, showing the hotspots of player death in the level segment Valaskjalf (see online version for colours)
Source: Drachen and Canossa (2009a). Note: Scale ranges from light green (low numbers of death) to red (high numbers of death). Locations with no colour have zero deaths. Four of the most lethal areas are marked with red circles. (Right) The Valaskjalf level segment with an overlay analysis superimposed. The analysis shows the sections of the level segment where the highest number of different causes of death occur, on a scale from light green (one cause of death) to red (six causes of death).
Looking closer at the four areas of extremely high death counts yields more specific information (Figure 10): Area 1: the death events are caused by two causes only, the attack of a Yeti Thrall and a tricky jump leading to some deaths by falling. If the number of deaths occurring in this area is deemed to high (i.e. prevents or diminishes player enjoyment), the analysis suggests two ways of solving the problem, e.g. making the jump easier or eliminating the Yeti Thrall enemy. Area 2: here there are also two causes of death, tarantulas and – the vast majority – by traps. This could suggest that the traps should be more lenient (recall that traps constitute 32% of the total deaths in the Arctic level of TRU). Area 3: here there is a variety of causes of death: enemies, environment effects and falling. As with Area 1, a revision of the challenge level might be useful here, and it could be worth investigating whether players feel overwhelmed in this area of Valaskjalf. This area is also the part of the level segment that has the highest amount of HoD requests (Figure 6), further indicating that this is an area that might be too challenging. Area 4: this area displays very similar characteristics to Area 2 with similar implications in terms of the play experience.
Evaluating motion
17
Figure 10 Detail of the overlay analysis with a breakdown of the four targeted areas with high death counts (see online version for colours)
Source: Drachen and Canossa (2009a). Note: Four layers are included in the overlay analysis (top–bottom rows): (1) death count; (2) number of causes of death; (3) deaths by enemies and (4) death by environment effects.
In this case study, a spatial analysis has identified potential trouble spots in the Valaskjalf level segment. These areas can be investigated in further detail, e.g. by comparing with user-satisfaction feedback from the level to evaluate whether there is a problem or not (Kim et al., 2008). Finally, layering the spatial distribution of individual HoD requests could form the basis for a similar analysis, providing insights into whether players are confused about one or many things/puzzles/progress.
5
Significance and discussion
In this paper, a current state-of-the-art review of quantitative player behaviour analysis in digital games is presented, pointing at the there is a need for new tools and strategies to analyse and make sense of player behaviour in digital games, and with the steadily increasing complexity of digital games, instrumentation data, such as gameplay metrics form an increasingly important tool in user research (Kim et al., 2008). The benefit of implementing gameplay metrics has been evidenced to be substantial from the inception of a game development project (Tychsen and Canossa, 2008), through the user-testing during production (Kim et al., 2008; see also chapters in Isbister and Schaffer, 2008) as well as post-launch (Drachen et al., 2009; Mellon, 2009). Current user-oriented research highlight that instrumentation-based approaches carry a range of advantages: they provide detailed, quantitative data and can be used to monitor player behaviour over extended periods of time and in the natural habitat of players (Drachen and Canossa, 2009b; Kim et al., 2008; Mellon, 2009; Thawonmas and Iizuka, 2008). However, the current use of instrumentation data – specifically gameplay metrics – for games research and development is limited, and generally focuses on aggregated counts of individual
18
A. Drachen and A. Canossa
metrics, with a few examples of machine learning approaches in the domain of MMOGs (e.g. Drachen et al., 2009), neither of which considers the spatial nature of player behaviour in 2D or 3D digital games. There has been limited effort directed towards more complex analyses of user behaviour, although this is a field that is rapidly gaining momentum as the game industry is realising that metrics-based anlaysis of player behaviour assists management of the revenue stream of online games (Mellon, 2009). Furthermore, few approaches consider the spatial dimension (e.g. Börner and Penumarthy, 2003; Chittaro et al., 2006; Drachen and Canossa, 2009a), and these are with two exceptions (Hoobler et al., 2004, visualises several spatial metrics at once but offers no analysis; Drachen and Canossa, 2009a, the pre-cursor paper to this one where GISs are introduced for spatial metrics work) aimed at visualising single variables rather than using the spatial variables for behavioural analysis. This is mainly due to the relative newness of the field – coherent user-oriented research in game development and game research is roughly five years old – and the lack of specialised tools. The spatial dimension of user behaviour is however important to consider because most contemporary digital games are based on the user navigating VEs (3D or 2D). It therefore is imperative to be able to analyse and visualise gameplay metrics spatially. It is, for example, not enough to know that the players spent too much time, completing a level considering the design. To find out why, spatial analysis provides a venue for pinpointing exactly where players experience problems with progression and what the factors causing the delay were. This dimension of play has, however, not been addressed in detail previously in either industry conferences or academic publications. In this paper, the idea of spatial gameplay metrics analysis as a means for advancing gameplay metrics-based behaviour analysis into the spatial domain of user behaviour is introduced, and concrete case examples presented evidencing the usefulness of the approach, thereby advancing the current state of the art beyond single-variable visualisations typified by heatmaps (generally density maps of locations where kill events occur. Such heatmaps have been published, e.g. Half-Life 2 level maps). The case studies presented also advances current methods for performing spatial analysis by introducing multi-variate operations, drawn from real-world game development or post-mortem situations, outlining how these are useful in game design evaluation and player behaviour analysis, whether in an academic or industry context. For example, by pointing out trouble spots, areas where players have difficulty in processing, or where players behave in a different manner as was intended by the game design. Alternatively, by leading to design principles, e.g. placing many different types of threats in the same area increases player death rates as compared to areas with fewer threats (e.g. traps and three different types of artificial intelligence-controlled opponents vs. only traps and one type of opponent), even if e.g. the relative number of opponents is the same. Furthermore, visualising and analysing data in a GIS (DeMers, 2008; Longley et al., 2005) and the custom-made QuickMetrics tool from IO Interactive is introduced as a powerful new tool for studying user behaviour in VEs. GISs have not previously been utilised in a gameplay metrics context, traditionally finding use in e.g. the geosciences and urban planning. These tools are however highly useful in a context, where behaviour analysis is carried out in games with 2D or 3D environment, due to the capacity of GIS to cater to a variety of needs due to their inherent flexibility, as opposed to existing systems for visualising behaviour in VEs (e.g. Chittaro et al., 2006; Hoobler et al., 2004), which are focused on specific types of data. A GIS is perfectly capable of visualising data in the
Evaluating motion
19
same manner as these systems, however, their strength lies in the capacity to perform analysis involving single to multiple variables. Gameplay metrics are, generally, used for behaviour analysis, action analysis, interface navigation evaluation and gameplay analysis, which means that this form of data supplement and extend the range of the typical methods for user-oriented research in the game industry and associated academia, e.g. playability-, usability- and userexperience-testing (e.g. Davis et al., 2005; Pagulayan and Keeker, 2007; Williams et al., 2008) by providing quantitative and highly detailed data about player–game interaction. The traditional methods typically yield qualitative or survey-based information, with more quantitative detail possible via e.g. video-capture analysis; however, these are cumbersome processes compared to the direct tracking and recording of gameplay metrics (Kim et al., 2008). Metrics also allow sample sizes to be very large with e.g. postlaunch metrics captured TRU encompassing over 1.5 million players, something that is not possible in a laboratory-based environment (Drachen et al., 2009). There is as yet almost no research published on best practices for combining these methods (the exception being Kim et al., 2008), mainly due metrics data being considered proprietary by the game industry and therefore rarely available for academic research. With respect to subjective user experience specifically, it is useful to point out that a key limitation of the instrumentation approach is that only inferences can be made about the user experience from game metrics data. Therefore, user research through gameplay metrics can benefit from being supplemented with attitudinal data and data from other qualitative methods (qualitative methods covered in, e.g. Davis et al. (2005), Pagulayan and Keeker (2007) and Williams et al. (2008)) when the goal is to draw conclusions about the subjective user experience, in combination with objective records of user behaviour that can show exactly what the players were doing when experiences, e.g. different types of emotional responses. This is a subject that has, as yet, received limited attention and therefore remains largely unexplored outside of a few major game publishers, such as Microsoft and Square Enix, with the only research publication to date, addressing this topic directly in terms of methodology being Kim et al. (2008) (operating solely in the non-spatial domain) with discussion/mention also in Drachen and Canossa (2009b) and DeRosa (2007). A discussion of how gameplay metrics, and spatial gameplay metrics, can and potentially could be combined with qualitative/semiquantitative sources of data on user experience specifically is a subject that is out-ofscope of the current paper; however, it is likely an area that will see attention from userresearch experts in the game industry in the next few years due to the potential benefits to game development of being able to link specific gameplay situations with subjective user responses.
Acknowledgements This work is based on an earlier work: ‘Analysing spatial user behaviour in computer games using geographic information systems’, in the Proceedings of the 13th International MindTrek Conference: Everyday Life in the Ubiquitous Era. Tampere, Finland (September/October 2009). © ACM, 2009.
20
A. Drachen and A. Canossa
References Blythe, M.A., Overbeeke, K., Monk, A.F. and Wright, P.C. (2004) Funology – From Usability to Enjoyment. Dordrecht: Kluwer Academic Publishers. Börner, K. and Penumarthy, S. (2003) ‘Social diffusion patterns in three-dimensional virtual worlds’, Information Visualization, Vol. 2, pp.182–198. Brainard, J. and Becker, B. (2001) ‘Case study: e-commerce clickstream visualization’, IEEE Symposium on Information Visualization. Cadez, I., Heckerman, D., Meek, C., Smyth, P. and White, S. (2000) ‘Visualization of navigation patterns on a website using model-based clustering’, ACM SIGKDD International Conference on Knowledge Discovery and Data Mining. Canossa, A. and Drachen, A. (2009) Patterns of Play: Play-Personas in User-Centered Game Development. DIGRA, London, UK: DIGRA Publishers. Chittaro, L. and Ieronutti, L. (2004) ‘A visual tool for tracing users’ behavior in virtual environments’, Working Conference on Advanced Visual Interfaces. Chittaro, L., Ranon, R. and Ieronutti, L. (2006) ‘VU-flow: a visualization tool for analyzing navigation in virtual environments’, IEEE Transactions on Visualization and Computer Graphics, Vol. 12, pp.1475–1485. Coulton, P., Bamford, W., Cheverst, K. and Rashid, O. (2008) ‘3D space-time visualization of player behavior in pervasive location-based games’. Int. J. Computer Games Technology, Vol. 2008, p.5, Article ID 192153. Davis, J., Steury, K. and Pagulayan, R. (2005) ‘A survey method for assessing perceptions of a game: the consumer playtest in game design’, Game Studies: The Int. J. Computer Game Research, Vol. 5. Demers, M.N. (2008) Fundamentals of Geographical Information Systems. New York, USA: Wiley & Sons. Derosa, P. (2007) ‘Tracking player feedback to improve game design’, Gamasutra. Available at: http://www.gamasutra.com/view/feature/1546/tracking_player_feedback_to_.php. Desurvire, H., Caplan, M. and Toth, J.A. (2004) ‘Using heuristics to evaluate the playability of games’, Computer-Human Interaction (CHI) Extended Abstracts. Drachen, A. and Canossa, A. (2009a) ‘Analyzing spatial user behavior in computer games using geographic information systems’, 13th MindTrek, Tampere, Finland: ACM-SIGCHI Publishers. Drachen, A. and Canossa, A. (2009b) ‘Towards gameplay analysis via gameplay metrics’, 13th MindTrek, Tampere, Finland: ACM-SIGCHI Publishers. Drachen, A., Canossa, A. and Yannakakis, G. (2009) ‘Player modeling using self-organization in tomb raider: underworld’, IEEE Computational Intelligence in Games. Milan, Italy: IEEE Publishers. Dumas, J.S. (2003) ‘User-based evaluations’, The HCI Handbook. New Jersey, USA: Lawrence Erlbaum Associates. Federoff, M.A. (2002) Heuristics and Usability Guidelines for the Creation and Evaluation of Fun in Video Games. Indiana, USA: Indiana University. Fua, Y., Ward, M.O. and Rundensteiner, E.A. (1999) ‘Hierarchical parallel coordinates for visualizing large multi-variate data Sets’, IEEE Visualization. Hilbert, D.M. and Redish, J.C. (1999) A Practical Guide to Usability Testing. Exeter, UK: Intellect Books. Hoobler, N., Humphreys, G. and Agrawala, M. (2004) ‘Visualizing competitive behaviors in multiuser virtual environments’, IEEE Visualization Conference. Hurst, A., Hudson, S.E. and Mankoff, J. (2007) ‘Dynamic detection of novice vs. skilled use without a task model’, Computer–Human Interaction (CHI).
Evaluating motion
21
Isbister, K. and Schaffer, N. (2008) Game Usability: Advancing the Player Experience. Massachusetts, USA: Morgan Kaufman Publishers. Jørgensen, A.H. (2004) ‘Marrying HCI/Usability and computer games: a preliminary look’, NordiCHI, Tampere, Finland. Kim, J.H., Gunn, D.V., Suhuh, E., Phillips, B.C., Pagulayan, R.J. and Wixon, D. (2008) ‘Tracking real-time user experience (TRUE): a comprehensive instrumentation solution for complex systems’, Computer–Human Interaction (CHI), Florence, Italy. Korhonen, H. and Kovisto, E.M.I. (2007) ‘Playability heuristics for mobile multi-player games’, DIMEA. Kort, J., Steen, M.G.D., de Poot, H., ter Hofte, H. and Mulder, I. (2005) ‘Studying usage of complex applications’, in L.P.J.J. Noldus, F. Grieco, L.W.S. Loijens and P.H. Zimmerman (Eds.), Measuring Behavior. Wageningen, The Netherlands. Kuniavsky, M. (2003) Observing the User Experience: A Practitioner’s Guide to User Research. San Francisco, USA: Morgan Kaufman Publishers. Lazzaro, N. and Mellon, L. (2005) ‘Fun meters for games’, Austin Game Developers Conference. Longley, P., Goodchild, M.F., Macquire, D. and Rhind, D. (2005) Geographic Information Systems and Science. London, UK: John Wiley & Sons Publishers. Medlock, M.C., Wixon, D., Terrano, M., Romero, R.L. and Fulton, B. (2002) ‘Using the RITE method to improve products: a definition and a case study’, Usability Professionals Association, Orlando, FL. Mellon, L. (2004) ‘Metrics in MMP development and operations’, Game Developers Conference. Mellon, L. (2009) Applying Metrics Driven Development to MMO Costs and Risks. Versant Corporation. Pagulayan, R.J. and Keeker, K. (2007) ‘Measuring pleasure and fun: playtesting’, in C. Wilson (Ed.), Handbook of Formal and Informal Interaction Design Methods. Massachusetts, USA: Morgan Kaufmann Publishers. Pagulayan, R.J., Keeker, K., Wixon, D., Romero, R.L. and Fuller, T. (2003) ‘User-centered design in games’, The HCI Handbook. New Jersey, USA: Lawrence Erlbaum Associates. Renaud, K. and Gray, P. (2004) ‘Making sense of low-level usage data to understand user activities’, SAICSIT. Schultz, C.P., Bryant, R. and Langdell, T. (2005) Game Testing All in One, Florence, KY, USA: Course Technology PTR. Swain, C. (2008) ‘Master metrics: the science behind the art of game design’, NLGD Conference, Utrecht, The Netherlands. Thawonmas, R. and Iizuka, K. (2008) ‘Visualization of online-game players based on their action behaviors’, Int. J. Computer Games Technology, Vol. 2008, No. 5, Available at: http://portal. acm.org/citation.cfm?id=1463038. Thompson, C. (2007) ‘Halo 3: How microsoft labs invented a new science of play’, Wired Magazine. No. 15.09, Available at: http://www.wired.com/gaming/virtualworlds/magazine/1509/ff_halo. Tychsen, A. and Canossa, A. (2008) ‘Defining personas in games using metrics’, Future Play, Toronto, Canada. Whiteside, J., Archer, N.P. and Wixon, D. (1982) ‘How do people really use text editors?’, SIGOA. Williams, D., Yee, N., Caplan, S.E. (2008) ‘Who plays, how much, and why? Debunking the stereotypical gamer profile’, Journal of Computer-Mediated Communication, Vol. 13, pp.993–1018.