node. The destination of the extra link is chosen from all other nodes with .... in [1] that the SPA model produces graphs with a power law degree distribution,.
Spatial models for virtual networks Jeannette Janssen Dalhousie University, Halifax, NS, B3H 3J5, Canada
Abstract. This paper discusses the use of spatial graph models for the analysis of networks that do not have a direct spatial reality, such as web graphs, on-line social networks, or citation graphs. In a spatial graph model, nodes are embedded in a metric space, and link formation depends on the relative position of nodes in the space. It is argued that spatial models form a good basis for link mining: assuming a spatial model, the link information can be used to infer the spatial position of the nodes, and this information can then be used for clustering and recognition of node similarity. This paper gives a survey of spatial graph models, and discusses their suitability for link mining.
1
Introduction
Through the advent of the Internet and especially the World Wide Web, huge repositories of data have become available in a naturally linked form. Examples are: on-line social networks, thematically coherent or domain-restricted segments of the World Wide Web, and electronic libraries of scientific papers. The links connecting entities in such data collections form a virtual network. The link structure of this network encodes information about the data represented by the nodes. Link mining is the process of extracting that information. Link mining can give information about the data collection when node-specific data is unavailable or private, as in on-line social networks, or can be combined with text mining in web graphs or citation networks to gain a better understanding of the data. In order to interpret the structure of the network it helps to model the process that led to the formation of the network. The virtual networks that are the subject of this paper are self-organizing: they are not governed by central control or design, but formed by individual actions of autonomous agents: Facebook users, Web page designers, authors of scientific papers. Moreover, since the networks are virtual and link creation is free, there are no physical constraints that limit the link structure. The first studies of the link structure of the Web revealed that virtual selforganizing networks exhibit a characteristic structure. Initially, models for such networks mainly aimed to generate graphs with a similar substructure. For a survey of such models, see [4, 3]. The principal properties observed were: 1. A heavy tail degree distribution. A characteristic of almost all virtual networks is that high degree nodes are relatively common. That is, the degree distribution P (k), where P (k) is the proportion of nodes of degree k, does
not fall off exponentially as k grows large. Often, the tail of the distribution follows a power law: P (k) ∼ k −γ for some exponent γ which is usually between 2 and 3. 2. The graphs are globally sparse, but locally dense. The average degree is O(log n), where n is the size of the network, or can even be constant. On the other hand, locally the graph is denser than one would expect if the links were distributed randomly. This can be measured by the value of the clustering coefficient, which is the average density of the subgraphs induced by the neighbourhood of a node. 3. Small distances between nodes. The local density might lead one to expect that it can take a large number of hops to go from one node to the other, since many links remain local. However, this is not the case: the average distance between nodes is O(log n) or smaller. While many of the graph models were succesful in reproducing some or all of the observed graph properties, they are based on an assumption that is incompatable with the concept of link mining. Generally, nodes in such models are indistinguishable. That is, the stochastic process that determines the link neighbourhood of a node is only based on the existing network, not on any individual property of the node. Link mining is based on the premise that nodes are not equal. The premise that it is possible to extract information about the nodes from the link structure implies that this information is present but hidden, and further, that this information influences the formation of the link structure. Thus, the link structure is a visible manifestation of an underlying, hidden reality. Two principal tasks of link mining are those of detecting similarity between nodes, and of identifying communities of related nodes. Thus, the hidden reality should give information about node similarity. A natural way to model similarity is to assume that the nodes are embedded in a metric space, where the metric distance between nodes is a measure of the similarity between nodes. If two nodes are similar the metric distance between them will be small, and communities will correspond to spatial clusters. Graph models where the nodes are embedded in a metric space and link formation is influenced by the metric distance between nodes are called spatial models. The main principle of spatial models is that nodes that are metrically close are more likely to link to each other. This is a formal expression of the intuitive notion we hold about virtual networks: Web links are likely to point to similar pages, people that share similar interests are more likely to become friends on Facebook, and a scientific paper mostly refers to papers on a similar topic. This paper gives an overview of spatial models and their suitability for link mining.
2
Spatial models with network-based link formation
In this section we review models where the link formation is directly influenced by the distance between the nodes. Precisely, let d be the metric of the space in
which the nodes are located. The probability that node vi links to node vj is a decreasing function of d(vi , vj ). A review of these models can also be found in Section 2.5 of [3]. The models have in common that link formation is network based, which means that the stochastic process according to which the links attaching to a node are generated depends on the entire network, and the node can potentially link to any node in the network, albeit with increasingly smaller probability as the distance increases. Most of the models presented in this Section were proposed as models for spatial networks, characterized in [3] as “networks whose nodes occupy a precise position in two- or three-dimensional Euclidean space, and whose edges are physical connections”. Examples of such networks are: the Internet (where the nodes are the routers) and other physical communication networks, railway and road networks, electric power grids, and neural networks in the brain. In spatial networks, there are limitations on the network posed by the physical reality; in virtual networks such limitations are largely absent. Still, the principle that nodes that are close in space are more likely to link to each other holds for both types. We will argue that some of these spatial models fit the reality of virtual models. Unless otherwise mentioned, we consider the space S in which the nodes are embedded to be the hypercube [0, 1]D , where D is the dimension. In order to eliminate boundary effects, we use the torus metric derived from any of the Lp norms. Formally, this means that for any two points x and y in S, d(x, y) = min{||x − y + u||p : u ∈ {−1, 0, 1}D }. The torus metric thus “wraps around” the boundaries of the unit cube, so every point in S is equivalent. In the models of spatial networks, the dimension D must equal 2 or 3, and the metric is the Euclidean metric (derived from the L2 norm). For a realistic model of virtual networks we expect D to be higher, while the metrics derived from the L∞ norm (determined by the largest coordinate) and the L1 norm (determined by the sum of the coordinates) can be reasonable alternatives. The nodes are embedded in S according to a given probability distribution. For ease of analysis, this distribution is often assumed to be uniform. However, a distribution that aims to model real data should contain clusters of closely spaced points. The most straightforward spatial models are those where links between nodes are formed independently, and a link between two nodes that have distance r to each other is formed with probability p(r). An early model for the Internet by Waxman [27] takes p(r) = β exp(−r/αc), where α, β ∈ (0, 1) are parameters, and c is the maximum distance between any pair of points. A similar model in studied in [17]. The exponential decay in p(r) implies that links substantially longer than αc are highly unlikely to occur. The graph distance between two nodes that are far apart in S depends on the maximum metric distance that can be spanned by a link. A good model for virtual networks will need to include long links, i.e. links between nodes that are far apart in the space, in order to achieve the property of small average distance between nodes.
In order to generate networks that have the desired properties, especially a suitable degree distribution, the link neighbourhood should also depend on the link structure of the network. This can be done if the graph is generated node by node. Formally, starting from a small initial graph, at each time step t a new node vt is generated and embedded in S according to the predetermined probability distribution. The new node is given a fixed number m of initial links. For each of the links, the probability p(i, t) that an existing node vi is chosen as the other endpoint is a function of the metric distance between vi and vt , and graph properties of vi in the existing network; usually the node degree. The probability p(i, t) is called the link probability. In [20, 23, 30], the link probability is given as: p(i, t) =
deg(vi ) , c(t) d(vi , vt )α
where α > 0 is a parameter, and c(t) is a normalizing constant. In [30], this model is studied in one dimension (D = 1). Since we use the torus metric, we can imagine the nodes as being located in a circle. Thus, the model is a natural extension of the “small-world” network of Watts and Strogatz [26]. For this model, it as been determined from simulations that, for α < 1 the degree distribution follows a power law, P (k) ∼ k −3 , and for α > 1 it is a stretched exponential, P (k) ∼ exp(−bk γ ), where γ depends on α. For all values of α, the average distance between nodes is of order log n. In [20], the model is studied numerically in all dimensions, and a critical value αc is determined so that for all α < αc , the degree distribution follows a power law, while for α > αc , it is a stretched exponential. It is also shown that the link length distribution `(k), where `(k)dk is the proportion of links that have length between k and k + dk, follows a power law. The papers discussed above derive their results from a uniform distribution of points in space; in [23], a non-uniform distribution is studied. Here D = 2. Any new node is embedded randomly in S at distance r from the barycenter of the existing set of nodes, where r is chosen probabilistically according to a probability distribution P (r) ∼ r−(2+β) , where β > 0 is a parameter. Using methods from statistical mechanics, the authors numerically determine the values of the parameters for which the graph has a power law degree distribution. In [2], the case where p(i, t) ∼ deg(vi ) exp(−d(vi , vj )/rc ) is studied for D = 2. In this case, links significantly longer than rc will be rare. In [28], a model for the Internet is proposed where D = 2, and p(i, t) =
deg(vi )σ , c(t) d(vi , vt )α
where both σ and α are parameters. Moreover, a non-uniform distribution of nodes in space is used which mimicks actual human population densities. In [18], nodes are placed on a grid pattern in a 2-dimensional space. Each node is connected to its four nearest neighbours in the grid, and to one other node. The destination of the extra link is chosen from all other nodes with
probability r−α , where r is the distance between the origin and the destination node. Thus, this model can be considered as a grid graph superimposed on a spatial graph model with p(i, t) = d(vi , vj )−α , D = 2 and m = 1. A spatial model developed with the explicit aim to make inferences about the underlying latent metric space was proposed for the modelling of social networks by Hoff, Raftery and Handcock [14]. Here, nodes represent individuals in a social network, and these nodes are assumed to embedded in a latent space representing simularities between nodes. The dimension is assumed to be low: in the examples given in the paper the dimension does not exceed 3. In the model, the relation between link probability p and metric distance d between nodes is given as: p = log a + bd, 1−p where a and b are parameters of the model. Note that this link probability function can be seen as a smoothing of a threshold function. If a threshold function is used instead, the graph model corresponds to the random geometric graph model discussed in the next section. Extensions of this model can be found in [11, 15, 24]. Finally, we mention three spatial models that are based on different principles. In [29], nodes are linked independently with probability proportional to the dot product of the vectors reprenting the nodes. In [21], and later also [7], nodes are assigned random weights wi , and two nodes vi and vj are linked precisely when a function of the weights and the distance, for example (wi + wj )/d(vi , vj ), exceeds a given threshold θ. In [8], each new node vt links to the node vi that minimizes a function which is the convex combination of the graph distance of vi to the center of the graph, and the metric distance between vi and vt .
3
Spatial models with node-based link formation
Virtual networks can be very large, so it is reasonable to assume that any user is only familiar with a small fraction of the network, and that this fraction consists of the nodes that are similar to the node associated with the user. In the context of spatial models, this implies that a new node can only see the part of the network that corresponds to nodes that are metrically close. The second class of models we survey are based on this principle. The simplest model is the random geometric graph [22]. In this model, nodes are embedded in a metric space according to a given probability distribution, and two nodes are linked precisely when their distance is smaller than a given threshold value θ. The random geometric graph was proposed as a model for spatial networks, wireless multi-hop networks, and for biological networks, see for example [12, 13, 25]. In [19], a variant of the model is presented, where the metric space is the hyperbolic space. In random geometric graphs, a link between two nodes gives exact binary information about whether the nodes are within distance θ of each other or not. Thus the graph distance should be highly correlated with the metric distance, up to multiples of θ. In [5], this relationship is
confirmed for infinite random geometric graphs. In the same paper, a variation of the random geometric graph model is proposed, where nodes that are within distance θ of each other are linked independently with probability p. A variation of the random geometric graph model where the link probability is partially determined by the network was proposed by Flaxman et al. in [9]. Here, nodes join the network one by one, and each new node receives m links, and chooses its neighbours from among the nodes that are within distance θ of it. The probability that a node vi , which is within distance θ of the new node, receives a link, is proportional to its degree. As in the previous model, the threshold θ limits the length of a link, so that long links become impossible. In [10], the same authors extend the model, so that the hard threshold θ is replaced by a link probability function which makes it less likely that a node receives a link if it is far removed from the new node. The random geometric graph can also be represented as follows: each node is the centre of an associated sphere of radius θ. A new node can link to an existing node only when it falls within its associated sphere. The SPA model, proposed in [1], is based on the same principle, except that the radii of the spheres are not uniform, but depend on the in-degree of the node (the SPA model generates directed graphs). Precisely, each node vi is the center of a sphere whose radius is chosen so that its volume equals
A(vi , t) = min{
A1 deg− (vi , t) + A2 , 1}, t + A3
where A1 , A2 and A3 are parameters of the model. At each time step t, a new node vt is created and embedded in S uniformly at random. For each node vi so that vt falls inside the sphere of vi , independently, a link from vt to vi is created with probability p. Thus, a node with high degree is “visible” over a larger area of S than a node with small degree. It was shown in [1] that the SPA model produces graphs with a power law degree distribution, with exponent 1 + 1/pA1 . Moreover, because of the unequal size of the spheres, long links can occur, but only to nodes of high degree. It is shown in the next section that the SPA model can be used to retrieve the metric distances between nodes from the network with high precision. A related model, the geo-protean model, was proposed in [6]. Here, the size of the network is constant, but at each step a node is deleted and a new node is added. Nodes are ranked from 1 to n, and the sphere around a node is such that its volume is proportional to its rank raised to the power −α. The link neighbourhood of the new nodes is determined in a similar way as in the SPA model. It is shown that the degree distribution, link density, average distance between nodes, and clustering behaviour are consistent with those observed in social networks.
4
Estimating distance from the number of common neighbours
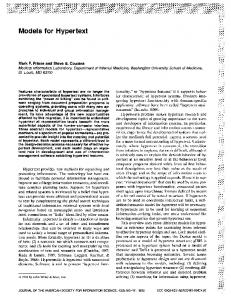
In this section, we show how the metric distances between nodes can be estimated from their number of common neighbours. The model we use is the SPA model, described in the previous section. The work presented here can be found in more detail in [16]. In this section, the dimension of S is assumed to be 2, and the parameters of the SPA model are A1 = A2 = A3 = 1. The SPA model produces directed graphs. The term “common neighbour” here refers to common in-neighbours. Precisely, a node w is a common neighbour of nodes u and v if there exist directed links from w to u and from w to v. In the SPA model, this can only occur if w is younger than u and v, and, at its birth, w lies in the intersection of the spheres of influence of u and v. We use cn(u, v, t) to denote the number of common in-neighbours of u and v at time t. First of all, we show that a blind approach to using the co-citation measure does not work. From the description of the SPA model it is clear that there exists a correlation between the spatial distance and number of common in-neighbours of a given pair of nodes. However, as shown in Figure 1, when we plot spatial distance versus number of common neighbours without further processing, no relation between the two is apparent. The data presented in Figure 1 was obtained from a graph with 100K nodes. The graph was generated from points randomly distributed in the unit square in R2 according to the SPA model, with n = 100, 000 and p = 0.95.
Fig. 1. Actual distance vs. number of common neighbours.
By analyzing the model, we can extract the relationship between the number of common neighbours and the metric distance. First, we make a simplifying assumption. In [1], it was shown that the expected degree, at time t, of node vi born at time i is proportional to (t/i)p . In the following, assuming that the degree of each node is close to its expected degree, we will set the the volume of the sphere of a node equal to its expected value: � t p A(vi , t) =
i
t
.
(1)
Before we continue, it is important to note that the simulation data was generated using the original SPA model as described in the previous section, and not using the simplifying assumption given above. The simplified model, where the volume of the sphere of influence is deterministic instead of a random variable, is only used for the analysis. The simulation results given later will show that this simplification is justified. The radius r(vi , t) of the sphere of influence of node vi at time t can now be derived from its volume. Note that, under the simplifying assumption, the spheres of influence shrink in every time step. Consider the relationship between the number of common neighbours and the metric distance of two nodes vi and vj at distance d(vi , vj ) = d, where i < j, so vi is older than vj . Three distinct cases can be distinguished: 1. If d > r(vi , j + 1) + r(vj , j + 1), then the spheres of influence of vi and vj are disjoint at the time of vj ’s birth. Since spheres of influence shrink over time, this means that these spheres remain disjoint, so vi and vj can have no common neighbours. 2. If d ≤ r(vi , n) − r(vj , n), then the sphere of influence of vj is contained in the sphere of vi at the end of the process (time n). Thus, at any time during its existence, the sphere of vj was completely contained in the sphere of vi , and thus any neighbour of vj has a probability p of also becoming a neighbour of vi . Thus, the expected number of common neighbours is asymptotically equal to p times the degree of vj , which is p(n/j)p . 3. If r(vi , n) − r(vj , n) < d ≤ r(vi , j + 1) + r(vj , j + 1), then the sphere of vj is initially contained inside the sphere of vi , but as the spheres shrink, eventually the spheres will become disjoint. The time at which this happens depends on the distance d between vi and vj , and this time, in turn, will determine the number of common neighbours. Ignoring a lower order error term, the expected number of common neighbours is given by: � � � �� p2 2p p − 1−p − 1−p j −p d− 1−p i (2) E cn(vi , vj , n) = pπ These formulas lead to an estimate dˆ of the metric distance between two nodes, based on the number of common neighbours of the pair. Note that from case 1 and 2, we can only obtain a lower and upper bound on the distance, respectively. Only in case 3 we obtain a formula which explicitly links the number of common neighbours with the distance d. In our simulation, in order to eliminate case 1, we consider only pairs that have at least 20 common neighbours (19.2K pairs). To eliminate case 2, we require that the number of common neighbours should be less than p/2 times the lowest degree of the pair. This reduces the data set to 2.4K pairs. When we are likely in case 3, we can derive a precise estimate of the distance. We base our estimate on Equation (2). The estimated distance between nodes vi and vj , given that their number of common neighbours equals k, is then given by �� � � 1−p � � 1−p � � 1−p i−p/2 j − 2 k − 2p . dˆ = π −1/2 p 2p
Note that i and j appear in the formula above, so the estimated distance depends not only on the number of common neighbours of the two nodes, but also on their age. In our simulation data, the age of the nodes is known, and ˆ Figure 2 shows estimated distance vs. real distance used in the estimate of d. between all pairs of nodes that are likely to be in case 3.
Fig. 2. Actual distance vs. estimated distance for eligible pairs from simulated data, calculated using the age (left) and estimated age from degree (right) of both nodes.
While there is clearly some agreement between estimated and real distance, the results can be improved if we use the estimated age, instead of the real age. The estimated time of birth a ˆ(v) of a node v which has in-degree k at time n will be: a ˆ(v) = nk −1/p . Thus, we can compute dˆ again, but this time based on the estimated birth times. This method has the added advantage that it can be more conveniently applied to real-life data, where the degree of a node is much easier to obtain than its age. Figure 2 again shows estimated vs. real distance for the exact same data set, but now estimated age is used in its calculation. This time, we see almost perfect agreement between estimate and reality.
References 1. W. Aiello, A. Bonato, C. Cooper, J. Janssen, P. Pralat. A spatial web graph model with local influence regions. Internet Mathematics, 5(1–2):175–196, 2009. 2. M. Barthelemy. Crossover from scale-free to spatial networks. Europhys. Lett. 63(6):915–921, 2003. 3. S. Boccaletti et al.: Complex networks: Structure and dynamics. Physics Reports 424:175–308, 2006. 4. A. Bonato: A Course on the Web Graph. American Mathematical Society, Providence, Rhode Island, 2008. 5. A. Bonato and J. Janssen. Infinite random geometric graphs. Preprint (2010). 6. A. Bonato, J. Janssen and P. Pralat. A geometric model for on-line social networks. Preprint (2010).
7. M. Bradonjic, A. Hagberg, A.G. Percus. The structure of geographical threshold graphs. Internet Mathematics 4(1–2):113–139, 2009. 8. A. Fabrikant, E. Koutsoupias and C.H. Papadimitriou. Heuristically Optimized Trade-offs: a new paradigm for power laws in the Internet. In Proceedings of ICALP’02, Springer LNCS 2380:110–122, 2002. 9. A. Flaxman, A.M. Frieze, J. Vera. A geometric preferential attachment model of networks. Internet Mathematics, 3(2):187–206, 2006. 10. A. Flaxman, A.M. Frieze, J. Vera. A geometric preferential attachment model of networks II. Internet Mathematics, 4(1):87–111, 2008. 11. M.S. Handcock, A.E. Raftery, J.M. Tantrum. Model-based clustering for social networks. J.R. Statist. Soc. A, 170(2):301–354, 2007. 12. C. Herrmann, M. Barth´elemy and P. Provero. Connectivity distribution of spatial networks. Phys. Rev.E 68:026128, 2003. 13. D.J. Higham, M. Rasajski, N. Przulj. Fitting a geometric graph to a protein-protein interaction network. Bioinformatics, 24(8):1093–1099, 2008. 14. P.D. Hoff, A.E. Raftery, M.S. Handcock. Latent space approaches to social network analysis. J. Am. Stat. Assoc. 97:1090–1098, 2002. 15. P.D. Hoff. Bilinear mixed-effects models for dyadic data. J. Am. Stat. Assoc. 100:286–295, 2005. 16. J. Janssen, P. Pralat, R. Wilson. Estimating node similarity from co-citation in a spatial graph model. In: Proceedings of 2010 ACM Symposium on Applied Computing–Special Track on Self-organizing Complex Systems, 5pp. 17. M. Kaiser and C.C. Hilgetag. Spatial growth of real-world networks. Phys. Rev. E 69, 036103, 2004. 18. J. Kleinberg. Navigation in a small world. Nature 406:845, 2000. 19. D. Krioukov, F. Papadopoulos, A. Vahdat, M. Bogu˜ na. Curvature and Temperature of Complex Networks. arXiv0903.2584v2, 2009. 20. S.S. Manna and P. Sen. Modulated scale-free network in Euclidean space. Phys. Rev. E 66:066114, 2002. 21. N. Masuda, M. Miwa, N. Konno. Geographical threshold graphs with small-world and scale-free properties. Phys. Rev. E, 71(3):036108, 2005. 22. M. Penrose. Random Geometric Graphs. Oxford University Press, Oxford, 2003. 23. D.J.B. Soares, C. Tsallis, A.M. Mariz and L.R. da Silva. Preferential attachment growth model and nonextensive statistical mechanics. Europhys. Lett. 70(1), pp. 70–76, 2005. 24. M. Schweinberger, T.A.B. Snijders. Settings in social networks: a measurement model. Sociol. Methodol. 33:307–341, 2003. 25. X. Ta, G. Mao and B.D.O. Anderson. On the Properties of Giant Component in Wireless Multi-hop Networks. In: 28th IEEE INFOCOM proceedings, 2009. 26. D.J. Watts and S.H. Strogatz. Collective dynamics of “small-world” networks. Nature 393(6684):409–410, 1998. 27. B.M. Waxman. Routing of multipoint connections. IEEE J.Sel. Areas in Comm., 6(9):1617–1622, 1988. 28. S.-H. Yook, H. Jeong, and A.-L. Barab´ asi. Modeling the Internet’s large-scale topology. Proc. Natl. Acad. Sci. USA 99 (2002) 13382. 29. S.J. Young and E.R. Scheinerman. Random dot product graph models for social networks. In: Proceedings of WAW 2007, A. Bonato and F.R.K. Chung (Eds.). Springer LNCS 4863:138–149, 2007. 30. R. Xulvi-Brunet and I.M. Sokolov. Evolving networks with disadvantaged longrange connections. Phys. Rev. E 66:026118, 2002.