CUN.
CHEM.
40/3,
Evaluating Vernon
464-471
(1994)
#{149} Laboratory
Test Methods
M. Chinchilhi”2
Management
by Estimating
and W. Greg
and Utilization
Total Error
Miller3
A common procedure for evaluating a test method by comparison with another, well-accepted method has been to use a repeated measurements design, in which several indMdual subjects’ specimens are assayed with both methods. We propose the use of the intrasubject relative mean square error, which is a of the intrasubject relative bias and the coefficient of variation of the test method, as a measure of total error. We construct for each individual subject a score that is based on how well an individual’s estimate of total error compares with a maximum allowable value. If the individual’s score is >100%, then that individual’s estimate of total error exceeds the maximum allowable value. We present a distribution-free statistical methodology for evaluating the sample of scores. This involves the construction of an upper tolerance limit to determine whether the test method yields values of the total error that are acceptable for most of the population with some level of confidence. Our definition of total error is very different from that defined in the National Cholesterol Education Program (NCEP) guidelines. The NCEP bound for total error has
function
three
main
problems:
(a)
it incorrectly
assumes
that the
standard error of the estimated relative bias is the test coefficient of variation; (b) it incorrectly assumes that the indMdual estimated relative biases follow gaussian distributions; (C) it is based on requiring the relative bias of the average individual in the population to lie within prescribed limits, whereas we believe it is more important to require the total error for most of the individuals in the population, say 95%, to lie within prescribed limits. Indexing Terms: statistics/relative
bias/precision/accuracy
Comparison of the accuracy of one method with that of another is a common requirement in the clinical laboratory. Typical applications include development and evaluation of a new method, validation of a current method, and periodic evaluations of methods in proficiency testing schemes. The National Reference System for the Clinical Laboratory (1) has credentialed Definitive and Reference Methods for several analytes to provide an accuracy base for testing routine laboratory methods. In the case where no credentialed Reference Method exists, the most reliable comparison method available is used for accuracy evaluation. 1Center Pennsylvania 2Author
for Biostatistics
and Epidemiology,
State University, for correspondence.
Hershey, Fax
College PA 17033. 717.531-5779;
of Medicine, Internet
[email protected]. 3Section of Clinical Chemistry, Department of Pathology, Medical College of Virginia, Virginia Commonwealth University, Richmond, VA 23298-0597. Received May 24, 1993; accepted November 11, 1993.
464
CLINICAL
CHEMISTRY,
Vol. 40, No. 3, 1994
A common evaluation procedure for a test method vs a comparison method has been to use a repeated measurements design with several individual subjects’ specimens assayed with both methods. Evaluation of performance has been based on the test method’s mean accuracy and precision, as calculated from the sample of specimens. Sometimes precision is estimated independently, based on replicate assay of aliquots of pooled specimens. However, sample means for accuracy and precision do not necessarily reflect how the test method will perform for most of the individuals in the population. Therefore, we prefer to estimate the total error for each individual subject in the sample and infer method performance by using reliable clinical information for most individuals in the population, say 95%, rather than that for the average individual in the population. If one assumes that the comparison method is unbiased, then the total error for an individual result includes contributions from the evaluated method’s inaccuracy and imprecision and the comparison method’s imprecision. The concept of total error assessment in clinical chemistry is not new. Total analytical error has been defined as the sum of random analytical error (imprecision) plus systematic analytical error (inaccuracy or bias), and regression methods have been applied to allow inference of the total analytical error at specific concentrations (2); typically, the systematic analytical error is the larger source of error in clinical chemistry. Regression methods have been extended to account for effects related to the individual subject because the bias may not be constant across subjects (3). Other researchers have disapproved of correlation and regression methods and recommended a two-step process for investigating inaccuracy and imprecision (4, 5). A quality improvement approach has been proposed to identify and reduce the various components of total analytical error (6). We previously reported an evaluation scheme for cholesterol analyzers that was based on the tolerance interval for the sample of intrasubject ratios of test and comparison methods means (7). We assumed a gaussian distribution in constructing the tolerance interval and formulated acceptable bounds for the tolerance interval based on a permissible value of the total error. However, the ratio of test and reference means for a particular subject, which is that subject’8 relative bias plus 100%, does not necessarily follow a gaussian distribution. Although the difference of two gaussian random variables itself is gaussian, this is not necessarily true for the ratio. If two gaussian variables are independent, then their ratio has a Cauchy distribution (Student’s t distribution with 1 dl). If the gaussian variables are correlated, then the distribution of their ratio cannot be expressed in any convenient form. The robustness of our
procedure (7) to violations of the gaussian assumption for the ratios has not been explored, so any results based on this procedure should be interpreted carefully. Here we propose an alternative approach based on the intrasubject relative mean square error, which is a func-
i
tion of the intrasubject relative bias and the coefficient of variation (CV) of the test method. The intrasubject relative mean square error is a reasonable measure of intrasubject total error, and we construct a score for each individual subject based on how well that individual’s estimate of total error compares with a maximum allowable value. An individual’s score can incorporate an adjustment factor if that individual’s intrasubject CV in the comparison method exceeds some standard, if an individual’s score is >100%, then that individual’s estimate of total error is not acceptable. The statistical methodology we present for evaluating the sample of scores is distribution-free. We construct an upper tolerance limit for the sample of scores to determine with some level of confidence whether the test method satisfies the total allowable error criteria for most of the population.
Materials
and Methods
Specimen testing was performed on residual sera submitted to the clinical laboratory for routine testing. All procedures were in accordance with the Medical College of Virginia Hospitals ethical standards. The example data set consisted of 10 replicate measurements of total cholesterol in each of 100 subjects with a routine laboratory analyzer test method and an enzymatic comparison method. The enzymatic method had its accuracy verified by participation in the Lipid Standardization Program of the Centers for Disease Control and Prevention (CDC). Because our objective here is to demonstrate the statistical methodology and not focus on the performance of the particular test method in our study, we have not identified the test method or provided details on the comparison method. The Laboratory Standardization Panel of the National Cholesterol Education Program (NCEP) has recommended that a test method for measuring serum cholesterol have a CV 100% indicates otherwise. The total error estimate is intuitively appealing as a basis for determining whether the test method is performing satisfactorily because c, can exceed CT0, pro-
5 of
Table 1. Values of the approximate standard errors (SE, %) in Eqs. 5 of the estimates of the relative bias, test CV, and comparison CV defined in Eq. 4, under the assumptions that , = = 3%, , = 2%, and mn = m 2
3
4
5
6
7
8
9
10
20
SE(bT,)
2.5
2.1
1.9
1.6
1.5
1.4
1.3
1.2
1.2
0.8
SE(c.
2.1
1.5
1.2
1.1
1.0
0.9
0.8
0.7
0.7
0.5
SE(c,
1.4
1.0
0.8
0.7
0.6
0.6
0.5
0.5
0.5
0.3
466
CLINICAL CHEMISTRY,
Vol. 40, No. 3, 1994
vided error
that does
b.I is small not exceed
that the estimate of total or similarly, Ib,I can ex-
enough TE,,;
ceed o’ estimate
provided that c, is small enough that the of total error does not exceed TE,,. For a particular subject it is possible for the maximum allowable total error not to be exceeded, even though the maximum allowable relative bias (or test CV) is exceeded. Thus, total error assessment is more flexible than evaluating accuracy and precision separately. Note that our definition of total error in Eq. 7a and our maximum allowable value TE,,, in Eq. Th are very different from those defined in the NCEP guidelines (8), which state that the total error should be , then we replace c,, with cTO/cR1 in the above scheme to calculate P, (i = 1,2,. . .,n). The rationale behind this adjustment is to shrink c’r,, the estimate of the test CV, according to the rate by which ca,, the estimate of the comparison method CV, exceeds its allowable value. In other words, if a subject exhibits an unacceptable amount of imprecision in the comparison method, it is not fair to expect acceptable precision on the test method; thus, this subject’s estimate of the test CV is adjusted accordingly. Our approach to statistical inference is to construct an upper tolerance limit from the independent sample P1,P2,. . .,P,. The upper tolerance limit is defined to be that value such that 100(1 y)% of the population is below this limit with 100(1 a)% confidence. If one is concerned about most of the individuals in the population meeting the NCEP standards, then typical choices
1000, with n observations each are generated with replacement from the original sample (P1,P2,.. .,P). Within each of the L data sets, the 100(1 y)th percentile is calculated and this set of estimates of the 100(1 y)th percentile is ordered from smallest to largest and denoted as U(j) U(2) ... U. The upper tolerance limit is
-
-
size. limit of data
via bootstrapsets, say L
=
-
-
U(8), where s is the closest integer to (1 a)L. We have written a program in Version 6.07 of PROC IML of SAS (11) that computes the upper tolerance limits; the program is available upon request. -
Results In our study, with 10 measurements each cholesterol from test and comparison methods of 100 subjects, the P, scores were calculated
I.%o
= 3% and CTO = Cao = 2% (the CV Table 2 contains the jects in our study. subjects had a score ceeded the maximum trates the range of
CLINICAL
of serum for each by using
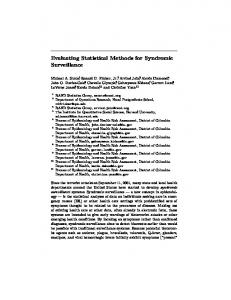
3% (based on the NCEP goals), and limit for the comparison method). ordered P, scores for the 100 subWe discovered that 37 of the 100 >100%, indicating that they exallowable total error. Fig. 1 ifiusindividual subjects’ mean relative CHEMISTRY,
Vol. 40, No. 3, 1994
467
Table 2. LIsting Mean_g/L Subject
Comparison
Comparison CV
statistics
for all 100 subjects.
____________ Mean, 9/La
Relative bias
Test CV
Score
Subject
-0.08
0.81
0.96
18.8
48
1.579
1.532
0.99
21.8
40
2.926
2.417
2.419
28
1.963
1.958
0.25
0.90
14
0.736 2.047
0.736 2.045
0.00
0.95
1.31
22.1
63
11
0.10
0.95
0.58
22.2
16
17
2.307
2.316
0.96
0.94
54
89 57
3.662 2.191
3.651 2.202
-0.39 0.30 -0.50
61 97
1.459 2.567
1.450 2.560
59
2.619
2.605
86
2.353 2.191
2.341 2.173
83 52 93
1.364 1.259 1.954
1.370 1.248 1.938
-0.44
39
1.774
1.799
-1.39
66
1.221
1.211
Test
Comparison
Relative bias
Test
Comparison Score
CV
CV
1.32
0.80
2.830
3.07 3.39
0.69
0.85
77.9 80.5
2.654
2.572
3.19
1.41
0.82
81.4
1.805
1.748
3.26
1.26
0.80
81.5
1.653
3.44
0.58 0.61
84.2
3.45
1.11 1.28
3.40
1.66
0.50
88.5
1.48
0.79
90.6
1.04
1.45
24.1 25.1
55
1.621
1.598 1.567
1.02
0.56
26.5
60
2.613
2.527
0.62
1.04
1.45
1.19
1.10
34 44
0.591 1.289
0.613 1.241
-3.59
0.27
28.3 28.4
3.87
0.93
1.29
92.6
0.54
1.10
0.94
28.6
1.12
0.62
28.6
2.025 2.103
1.952 2.020
0.83
0.97
1.42
29.8
96
2.037
2.117
3.74 4.11 -3.78
1.40 0.93 1.87
1.15
0.51
90 1
0.86
93.2 98.0 98.6
1.30
1.19
32.0
30
2.436
2.340
4.10
1.10
1.41
98.9
0.88
1.09
0.63
32.7
1.37 0.76
33.8
4.19 4.27
1.19
1.19 0.61
2.385 2.782
2.289
0.83
2 47
1.12 1.10
101.5 102.6
35.3
43
2.184
2.092
1.17
1.31
1.72
36.1
98
2.858
2.985
4.40 -4.25
0.86
0.87 0.98 0.74
105.9 107.7 109.5
0.83
2.668
1.08 1.77
1.09
85.7
5
2.144
2.160
1.36
0.69
36.1
2.682
2.680
0.07
1.59
1.13
37.0
88 49
1.198 1.359
1.145 1.295
4.63
94
4.94
1.12
1.22
118.0
56
1.892
1.874
0.96
1.36
0.45
121.1
1.48
0.80
1.24
1.232 2.155
0.64
2.777 2.146 2.581
1.295 2.266
0.98
2.818 2.114 2.620
99 37
5.11
87 70 19 18
38.9 39.1
5.15
1.77
0.50
127.1
0.90
1.43
40.6
5.35 5.47
1.11 0.89
1.05
41.0 41.2
1.458 1.061
2.536
0.59 0.79
1.536 1.119
0.63
0.90
62 91
2.500
-1.49 1.51 -1.42
82
1.04
0.64
2.042
2.024
5.66
132.8
44.0
2.509
2.368
5.95
0.48
140.7
69 95
2.242 1.921
2.267 1.899
-1.10 1.16
1.53 1.50
0.91 0.80
44.1
2.147 3.089
2.027 2.914
5.92
1.44
0.41
141.8
44.4
38 85 4
0.78 1.07
2.01
1.776
0.85 0.76
75
1.745
1.53 0.73
41.3
58
0.89 -1.74
1.778 2.615
5.46
26
1.875 2.763
127.2 128.8 129.2
6.00
1.16
0.69
142.3
84
1.839
1.814
1.38
1.41
1.25
1.134 1.868
-1.76
1.35
1.04
2.486
2.191 2.339
6.02 6.28
1.07 0.74
0.69
1.114 1.908
50 78
2.323
64 67
46.2 51.9
1.04
142.4 147.1
0.749
0.87 0.42
53.5
27 9
0.793 1.567
0.746 1.473
6.38
0.85 1.28
1.29 1.01
147.8 151.5
51 53
0.740 1.405
0.752 1.375
0.81 1.32 1.69
6.30
0.735
2.14 -1.87
53.3
12
0.84
54.3
77
2.201
2.065
6.59
0.66
1.63
153.8
0.84
54.4
45
1.972
1.852
6.48
1.30
42 31 23
1.988 0.782 1.738
1.961 0.766 1.761
1.89
1.10 0.74
54.9
2.084 3.477
1.939 3.226
7.48
1.34
1.22 0.71
153.9 176.8
1.01
1.47 0.29
182.4 184.4
-0.74
-1.60
2.18 1.38
0.70
1.18
0.91
55.9
3 74
-1.31 1.82
2.01
1.12 0.93
56.1
10
2.480
2.303
7.78 7.69
56.2
0.874
7.89
1.33
1.23
186.3
0.90
3.629
3.358
1.402 1.911 1.666 0.473
1.291 1.756 1.526 0.523
8.07 8.60 8.83
0.99 1.38 1.24
0.61
0.98
56.6 58.5
24 79
0.943
1.41 1.52
0.67
189.0 202.6 207.4
9.17
1.39
0.34
215.9
-9.56
2.01
1.29
227.8 240.0
2.09
1.85
92
1.562
1.534
20 25
2.640 1.387
2.589 1.360
1.97 1.98
68 33
2.009
1.962 1.150
2.40 2.17
0.98 1.62
0.86
60.3
1.175
0.82
63.4
65
1.720
1.679
2.44
1.19
1.55
63.4
35 36 6 41
22
1.855
1.815
2.20
1.65
1.17
64.5
73
1.626
1.474
10.31
0.66
0.80
8
2.832
2.894
-2.14
1.94
0.85
67.8
76
1.607
1.419
13.25
0.72
1.07
308.2
46 29
1.521 2.058
1.566 2.007
-2.87
0.65
1.05
1.17
0.54
321.8
1.48
0.73
323.0
1.30
363.8
2.063
71.1 72.3
0.86
2.113
1.38 1.91
15.63
13
2.72 2.42
0.814 1.457 2.022
1.19
1.177
0.74 1.06 1.07
13.85
1.209
0.870 0.715 1.260 1.724
13.79
15
32 7 72 80
0.990
2.54
68.5 68.7
17.28
1.09
1.07
402.4
81
1.278
1.241
2.98
1.21
0.80
75.1
71
0.946
0.758
24.80
0.74
1.04
576.3
Multiply by 0.002588
1.56
observed in this data set. As is obvious from 2 and Fig. 1, the main reason why so many scores are >100% is that the test method has a large bias. Although 50 subjects exceeded 3% absolute relative bias, 13 of these did so only slightly and exhibited such CLINICAL
0.77
for mol/L
biases Table
468
and scores
21
100
a
Test
of the descriptive
CHEMISTRY,
Vol. 40, No. 3, 1994
a small test CV that their estimated total errors were within desirable limits. As discussed below, this might be considered an advantage of the total error assessment over individual assessments of accuracy and precision.
The upper
tolerance
limit
(upper
95% confidence
limit
for the 95th percentile) was calculated as 402.4% from the order statistics and 363.8% from the bootstrapping scheme. Because both of these are much greater than 100%, the test method does not meet the total error standard for most (95%) of the population. Because excessive total error was observed for 37 of the 100 subjects in the study and was due to excessive relative bias, we thought to determine what value of the relative bias standard (), with the CV standard set at 3%, would allow the upper tolerance limit for 95% of the population with 95% confidence to equal 100%. Based on the order statistics, the bias standard would need to be 16.9%; based on the bootstrap, it would need to be 15.4%. Regardless of which tolerance limit construction is chosen, these are unacceptably high standards for the relative bias.
(eTO)
Our
proposed
correction
factor
for an individual
sub-
ject’s score, whereby the score is adjusted if that subject’s estimate of the comparison method’s intrasubject CV exceeds a preassigned allowable value, may not be optimal in some statistical sense, and other types of correction require exploration. For example, an alternative way to adjust for an observed comparison method CV that exceeds its allowable value is to modify the expression for total error in Eq. 6 to
E1(YTVYRik’I
[\
P’Ri
100%
/
2
+ TiTi/100%)2
(Ti
Thus, a modified version of the the ith subject and the maximum would be
+ total error allowable
+ j3
(10)
estimate total
for error
Discussion An important feature of our proposed statistical methodology is that we evaluate whether the test method performs well for most of the individuals (95%) in the population. This leads to the use of tolerance limits, namely, confidence limits on percentiles, rather than confidence limits for the mean or median performance in the population. This approach evaluates the total error for each individual subject’s results, which provides a practical assessment of a test method’s ability to yield useful information. An evaluation methodology that determines whether average results are acceptable can have a large proportion of individual subjects whose results differ substantially from their true values. The reliability on individual subjects’ results is most important, especially if the response that the methods are measuring determines whether to initiate an invasive therapy for the patient. To reach this goal, we have proposed the distributionfree construction of tolerance limits. Some scientists view distribution-free statistical procedures as too conservative because they must allow for all types of distributions of the data. However, given the difficulty in assessing the true distribution of the ratios of nongaussian random variables, we are not aware of any viable parametric alternative.
C
#{163}
U
20 U
15
U
#{149}
U.
10
#{149}i,
#{149}
#{149}#{149}U.
:
p
-5
U
-10
#{149}
U
S
-it,
.
0
1
Fig. 1. Estimates
of relative
4
3
2
CHOLESTEROL
(gIL)
bias for individual subjects (n
=
100).
TE,
[(cq’, +
=
+ c
cTJbT,I/100%)2
(ha)
+
and
TEmax A modified
=
[(
+ ToPTGI100%)2
score
for the
ith
subject
+
& (i
(lib)
+
=
1,2,..
.,n) would
be P,
=
(TEJTE,,)100%
(12)
However, this scheme might provide an unfair advantage for the test method. If the ith subject has 4, < i.e., an estimated comparison method CV less than its allowable value, then c, and b in the numerator of P. in Eq. 12 both could be larger than their preassigned standards, and stifi P, might be