Evaluating the Effectiveness of Visualization Techniques for Schematic Diagrams in Maintenance Tasks Sungye Kim? and Insoo Woo? and Ross Maciejewski? and David S. Ebert? and Timothy D. Ropp† and Krystal Thomas‡ ? Purdue University Rendering and Perceptualization Laboratory † Aviation Technology, Purdue University ‡ Air Force Research Laboratory
Abstract
technicians often print many diagrams and highlight and annotate them as they perform their analysis. Many of these diagrams contain multi-page spreads of complex wiring diagrams. As such, tracing paths from page-to-page and in-and-out of components can be tedious. Furthermore, the number of diagrams needed can be cumbersome and maintaining contextual information when switching between related diagrams is difficult.
In order to perform daily maintenance and repair tasks in complex electrical and mechanical systems, technicians commonly utilize a large number of diagrams and documents detailing system properties in both electronic and print formats. In electronic document views, users typically are only provided with traditional pan and zoom features; however, recent advances in information visualization and illustrative rendering styles should allow users to analyze documents in a more timely and accurate fashion. In this paper, we evaluate the effectiveness of rendering techniques focusing on methods of document/diagram highlighting, distortion, and navigation while preserving contextual information between related diagrams. We utilize our previously developed interactive visualization system (SDViz) for technical diagrams for a series of quantitative studies and an in-field evaluation of the system in terms of usability and usefulness. In the quantitative studies, subjects perform small tasks that are similar to actual maintenance work while using tools provided by our system. First, the effects of highlighting within a diagram and between multiple diagrams are evaluated. Second, we analyze the value of preserving highlighting as well as spatial information when switching between related diagrams, and then we present the effectiveness of distortion within a diagram. Finally, we discuss a field study of the system and report the results of our findings.
Meanwhile, over the last decade, as technical documents have grown in size, manufacturers have begun transferring them from the printed page to electronic files (e.g., cgm, pdf, and raster image). Unfortunately, given that many of these manuals consist of multipage fold-out diagrams, scrolling through pdfs and trying to maintain context amongst various components is cumbersome, leading many technicians to still print documents. As such, the development of effective visualization techniques and systems for technical diagrams is critical for improving daily maintenance tasks. Previous work has analyzed how technicians interact with technical diagrams, providing insight into necessary design parameters needed in the creation of such systems. Of key importance, Barnard et al. [2006] and Barnard and Reiss [2006] noted that technicians utilize technical documents in different manners, developing their own mental models while interacting with systems. Thus, in a visualization system for technical documents, the system design needs to be based on human perception and cognition in order to enhance the system’s effectiveness and practical relevance. Ware et al. [2004] mentioned the pivotal role of human perception in the determination of what visualization techniques (e.g., color, texture, and moving pattern) should be utilized to maximize the user performance of tasks when interacting with a system. Moreover, there have been studies [Reuter et al. 1990; Healey 2001] to answer the question about what makes an effective visualization in terms of human perception.
CR Categories: I.3.6 [Computer Graphics]: Methodology and Techniques—Interaction techniques; Keywords: Effectiveness in interactive diagram visualization, context preservation, human factors in maintenance work
1
Introduction
In light of these issues, our previous work [Woo et al. 2009] presented an interactive visualization system for technical diagrams (SDViz). SDViz was designed to help users explore technical diagrams interactively and incorporated many traditional diagram visualization techniques (e.g., highlighting, animation, context views). In this work, we utilize the SDViz system to quantitatively evaluate the effectiveness of a set of visualization techniques for technical diagrams in the maintenance domain. For this evaluation, we first developed a troubleshooting scenario based on cognitive analysis of a routine tabletop maintenance exercise conducted by experienced technicians to simulate a real world problem. This troubleshooting scenario was broken into several key tasks primarily focusing on component identification. A quantitative evaluation was performed utilizing a specific visualization tool for each task. Subjects performed these given tasks after training with SDViz and we recorded their interaction (mouse movements, clicks and task completion time). Analysis of variance testing was performed on data collected from each task to determine the significance in terms of mean time and accuracy of task completion. Additionally, a field evaluation was performed using senior students in Aviation Technology at Purdue University. They evaluated various tools provided by our system in terms of usability and usefulness.
Effective visualization, regardless of the domain, is required to provide users with a better understanding of their data [Ware 2004; Johnson and Hansen 2004]. In particular, visualization modalities for 2D technical documents, such as schematic and wiring diagrams, need to be carefully designed as they can significantly affect maintenance tasks in terms of troubleshooting time and accuracy. Typical tasks in maintenance work include finding components and tracing circuit paths. Technicians begin with a broken component and hypothesize which connections may be contributing to the fault. Next, technicians often need to find a component in a schematic diagram, search through the manual for the related wiring diagram, and then trace paths through the wiring diagram, while maintaining contextual information. To facilitate these tasks, Copyright © 2010 by the Association for Computing Machinery, Inc. Permission to make digital or hard copies of part or all of this work for personal or classroom use is granted without fee provided that copies are not made or distributed for commercial advantage and that copies bear this notice and the full citation on the first page. Copyrights for components of this work owned by others than ACM must be honored. Abstracting with credit is permitted. To copy otherwise, to republish, to post on servers, or to redistribute to lists, requires prior specific permission and/or a fee. Request permissions from Permissions Dept, ACM Inc., fax +1 (212) 869-0481 or e-mail
[email protected]. APGV 2010, Los Angeles, California, July 23 – 24, 2010. © 2010 ACM 978-1-4503-0248-7/10/0007 $10.00
33
In this article, we describe the effectiveness of context-preserving visualization for technical diagrams while analyzing and presenting the results from our evaluation study. Lessons learned from our study are summarized as follows:
potential candidates that should be checked, while still maintaining these annotations during diagram switching.
2.2
• Lesson 1: Highlighting preservation among related diagrams enhances the contextual information resulting in a significant performance increase in both task completion time and accuracy.
Distortion viewing is one of the most common methods for focus+context visualization. Carpendale et al. [2004] introduced distortion methods based on a fisheye lens to achieve higher magnification without eliminating any of context. However, distortion viewing for technical diagram visualization is one of the least preferred techniques by maintenance personnel because it changes the structural view of components within technical diagrams. Distorted diagrams can hinder a technician’s ability to seamlessly transition between printed and visualized diagrams. Despite this limitation, a few distortion techniques that maintain the structural view of diagrams, such as magic lens and rectangular fisheye lens, can be effective for the visualization of relatively large diagrams and can enhance a user’s area of interest within the context of a diagram.
• Lesson 2: Preserving spatial information when switching between diagrams enables users to quickly find the same component in the diagrams while achieving significant improvement in performance time. • Lesson 3: Context-preserving visualization shows a significant difference in terms of time and accuracy. This paper is organized as follows: first, we overview our system (SDViz) briefly. Then, we introduce our user study design explaining the data we used, the subjects who participated in our evaluation study, and the overall procedure of our evaluation study. Next, we examine how highlighting and spatial information as contextual information are able to help users perform tasks when they work with one or more technical diagrams. Then, we investigate the value of contextual information preserved during distortion of a diagram and transition between diagrams. Finally, we present an additional field study conducted by senior students in the school of Aviation Technology who have experience in simulated and/or real troubleshooting using technical diagrams.
2
In our system, the magic lens [Bier et al. 1993] uses a fixedsize magnifying area occluding neighboring regions, whereas the rectangular fisheye lens [Rauschenbach 1999; Rauschenbach et al. 2001] contracts the neighboring regions around a user-defined area. This lens allows large diagrams to be displayed while providing unoccluded, adjacent, contextual information.
2.3
Navigation
For navigating diagrams, we provide both single diagram navigation and inter-diagram navigation methods for exploring technical diagrams. In single diagram navigation, our system uses the component-to-component or component-to-connection relationships to navigate within a single diagram. Our system also allows users to center any of the connected components by selecting the component’s name. The quick identification of special components, such as circuit breakers, is done through an interactive search feature. In inter-diagram navigation, our system allows users to navigate to related diagrams, without explicitly searching for these relationships, while preserving the contextual information and maintaining user focus while switching between diagrams. Our system also provides transition by blending two diagrams such that it shows the part of a related diagram within the view of the current diagram. While diagrams are blended, the highlighting as well as spatial context of a focused component are preserved to provide a user with consistent contextual information.
SDViz: A Context-preserving interactive visualization system for Technical diagrams
In our previous work [Woo et al. 2009], we developed a technical diagram visualization system, which provides maintenance personnel with tools to explore technical diagrams and aid in diagnosing faults while traversing multiple diagrams. Moreover, contextual information such as highlighting, working status, switch status, and spatial information is preserved between related diagrams. In addition, our system provides various visualization techniques, such as component searching within and across diagrams, connection tracing, distortion viewing, and flow animation. In this section, we briefly explain the main functionalities of SDViz used for our evaluation study. For further details, please see [Woo et al. 2009].
2.1
Distortion Viewing
Highlighting
3
Highlighting immediately draws users’ attention by using visual effects resulting in emphasizing the information relevant to the users’ task. In our system, highlighting using color and marks is preserved in all related diagrams as contextual information. We highlight a focused component, neighbor components directly connected to the focused component, and connections between highlighted components in various colors indicating the status of a component. For all highlighting, the relationship between components is generated from the connection information. The highlighting of each component is blended with that of a parent component. Unlike components, we interpolate colors of the end points of each connection to present a directional cue, such as a source or a sink. Our system also uses special marks to denote whether a switch is on/off and whether a component is working/not-working in order to provide a symbolic abstraction when performing maintenance tasks across multiple diagrams. One mark presents the working status of a component together with highlighting by color. The other shows the on/off status of a switch component. The purpose of this highlighting is to provide tools to annotate users’ analysis, as well as to show
Evaluation Study Design
Using the previously described SDViz system, the goal of this work is to evaluate the effectiveness of various visualization techniques in terms of their ability to enhance user tasks in searching and analyzing technical diagrams. In this section, we describe the design of our experiments in order to evaluate the effectiveness of our context-preserving methods for technical diagrams using SDViz.
3.1
Background
There has been much research (e.g., [Laskowski and Plaisant 2005; Scholtz 2006; Plaisant et al. 2008a; Plaisant et al. 2008b; Greenberg and Buxton 2008]) into the proper methods of evaluating the efficiency, effectiveness and user satisfaction of visualization systems. Ferwerda et al. [2002] suggested that visualization can be evaluated based on the following criteria: i) the degree of simplicity that the visualization can provide to the users to understand and complete their tasks; ii) whether the visualization follows simple rules
34
of perception and design; iii) how realistic the visualization resembles the real-world objects; and iv) whether the visualization allows users to uncover something new in a dataset. Lakowski and Plaissant [2005] split the evaluation of visualization systems into three levels: the component, system, and work levels. The evaluation of the effectiveness of visualization is difficult due to the complex multi-disciplinary nature of visualization. However, recent discussion in the HCI community [Greenberg and Buxton 2008] suggests the removal of benchmark tasks in favor of qualitative insight tasks. Moreover, controlled experiments on benchmark tasks have fundamental problems as described in North [2006]. One of the major problems is that the benchmark questions must have definitive answers, leaving little room for deep insight, and answer correctness is treated as Boolean leaving little room for qualitative insight. Based on previous research into visualization system analysis, our work presents a set of quantitative tasks and a field study scenario.
3.2
Along with our quantitative benchmark tasks, we also worked with faculty within Purdue University’s School of Aviation Technology to develop an advanced troubleshooting scenario in which maintenance students would utilize conventional manuals alongside our SDViz tool in a field study for evaluation. Our study here is based upon the concept of using expert reviews (e.g., [Gabbard et al. 1999; Jackson et al. 2003; Tory and M¨oller 2005]) for system evaluation.
3.3
Data
We used schematic and wiring diagrams for the Window Heat System from a Boeing 737 aircraft in our evaluation study. For training within our system we used the Warning Electronics Unit Power Supply diagrams from the Boeing 757 aircraft, which have similar complexity to that of the diagrams used in the actual evaluation in terms of the structure of components and links.
Task Design 3.4
For our empirical user study, the effectiveness is defined as the measure of a technique’s ability to enhance the user’s understanding of technical data and to reduce task completion time by maintaining and enhancing contextual information between related schematic and wiring diagrams. At the work environment level, evaluation includes issues on how our system influences productivity, encourages collaborations amongst users, and promotes excitement in data exploration. Scholtz et al. [2006] presented evaluation aspects that should be considered as metrics and methodologies to assess visual analytics environment developed. Plaisant et al. [2008a] introduced the results from information visualization contests for 2003 through 2005, where a variety of visualization methods were used to analyze a given task, in order to propose methodologies to evaluate the effectiveness of various visualization techniques. Greenberg and Buxton [2008] described the importance of the choice of appropriate evaluation methodology in terms of usability evaluation while mentioning how harmful if it is applied incorrectly.
Subjects
Fifty nine subjects (fifty two males and seven females) participated in our user study. Among them, forty nine subjects who participated in our quantitative studies were familiar with using wiring diagrams from introductory circuit courses taken previously, but they had no experience using schematic or wiring diagrams of aircraft. These subjects were used in the quantitative task analysis. The others (ten males) who participated in a field study were senior students in the school of Aviation Technology at Purdue University. All of them were experienced in the simulated troubleshooting of aircrafts using schematic and wiring diagrams. All subjects are classified into separate groups for each task (except for Task 2 in the quantitative study which had four groups): Group 1 (experimental group) and 2 (control group). For our field study, the students in Group 1 (experimental group) used the SDViz tool, and the other in Group 2 (control group) utilized only a PDF viewer.
As our system is designed for users who already have technical diagram analysis skills, we limit our subject pool to only users who had taken undergraduate level circuit courses for the quantitative study, and users within Purdue University’s Aviation Technology courses for the field study. Finding a component in a diagram, as well as identifying the relationship of components between related diagrams, is fundamental to mechanical training and maintenance tasks. We ask subjects to find a specific component in a schematic or wiring diagram, and they perform repeated trials for each task. Task-oriented performance metrics such as the speed, accuracy and completeness with which users perform assigned tasks are some of the adopted measurements. Psychophysical measures, such as speed, accuracy and preference, are recorded to allow investigations on perceptual importance and meaning of these input conditions. Quantitative measurements in our experiments include both user’s response time and the number of operations (e.g., mouse clicks). Analysis of variance is used to test whether differences between conditions are significant. Task designs were developed using information from the cognitive design principles identified by Heiser et al. [2003; 2004] and Agrawala et al. [2003].
3.5
Procedure
Prior to the actual experiment, subjects completed a training session to familiarize themselves with the system’s functionality. Subjects who did not possess rudimentary efficiency in using schematics could not participate in the full experiment. During the training, subjects asked questions and received guidance in the use of the system. Once the training was completed, subjects were given a pre-test to determine their ability to use the SDViz system. Subjects who did not pass the pre-test had time for re-training until they were satisfied with their training and were given the pre-test again. No subjects failed after the re-training exercise was completed. Subjects who passed the pre-test performed the actual experiments through repeated trials and tasks randomized using a magic square method [Farrar 1996]. Time measurements were also recorded for a quantitative metric in this evaluation, and data collected from each task was subjected to an analysis of variance testing to determine if the mean time and accuracy of task completion were significantly different between the groups. Finally, a series of exit questions were given to participants using the SDViz tool as post-questionnaires for feedback.
Our quantitative evaluation study is comprised of three task simulations in order to evaluate the effectiveness of the following visualization methods:
4
Case Studies
Task 1 Highlighting components and links in schematic diagrams. In Tasks 1 and 2, we evaluated how highlighting and spatial information for technical diagrams can help users find information. In Task 3, we evaluated distortion methods for technical diagram navigation. Each task includes several repeated subtask trials.
Task 2 Maintaining contextual information through highlighting and spatial information. Task 3 Distortion viewing providing contextual information.
35
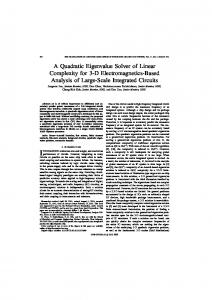
Figure 1: Task 1: finding a power source connected to a specific component (with a label highlighted in red) for Group 1 (left) and 2 (right). Subjects in Group 1 see highlighted components and links connected from the specific component with an initial highlighted label. As a result, they easily perceive that the leftmost component on the link is a power source. Subjects in Group 2 need to read a diagram or follow links to find a power source connected to an initial highlighted component.
4.1
Task 1
Task 1 focused on the effectiveness of highlighting within a diagram. The scenario and groups of subjects were as follows. Scenario: This task begins with a circuit component highlighted and requires subjects to locate the 115V AC power source connected to the component initially highlighted. When the subjects find the power source, they need to double click the power source component indicating that the subtask trial is completed. Subjects perform three trials in which the power source is located in different portions of the diagram. The time to find the component, as well as the number of mouse clicks for each trial are recorded and used for analysis. Our hypothesis for Task 1 is that highlighting will improve a user’s ability to find a component within a diagram. Note that all interconnected components are highlighted for the subjects and they are still then required to trace the path and determine which component is the power source. Our highlighting method does not simply provide users with the answer. See Figure 1 (left) to see the highlighted example and Figure 1 (right) to see the control example.
Figure 2: Task 1 Completion time (left) and accuracy (right). Error bars represent standard error on each side of the mean.
at identifying components. Scenario: This task starts with a circuit component highlighted in the schematic diagram and asks subjects to open the related wiring diagram to find a specified pin connection. When the subjects find the pin, they need to double click it denoting that this trial is completed. During three trials, timing and subjects’ mouse clicks are recorded and used for analysis.
Groups: Subjects in Group 1 (experimental group) see the path to power sources through the connected components highlighted automatically, while subjects in Group 2 (control group) physically trace the connections from the component to the power sources. Figure 1 shows screen shots for each group in Task 1.
Groups: For Task 2, we classify subjects into Groups 1, 2, 3 and 4 because we are evaluating the combination of two techniques (i.e., preservation of highlighting and spatial information) simultaneously. Subjects in Group 1 use highlighting preserved between related diagrams, subjects in Group 2 use highlighting and spatial information, subjects in Group 3 use no contextual information, and subjects in Group 4 use spatial information maintained. Figure 3 shows screen shots for each group in Task 2.
Results and Discussion: Figure 2 shows the results for Task 1. We find that subjects using the highlighting technique were significantly faster (p-value = 0.0118) and more accurate (p-value = 0.0335) than subjects who did not. The mean time for subjects using our highlighting techniques was 41.0 seconds and the mean time for subjects who had no highlighting options available was 78.8 seconds. In terms of accuracy, only one subject in Group 1 had a wrong answer for one trial amongst the three subtask trials (96.6% mean accuracy), whereas five subjects in Group 2 answered incorrectly for two subtask trials (81.4% mean accuracy).
4.2
Results and Discussion: The results for Task 2 are shown in Figure 4 in terms of mean time and accuracy to complete subtasks respectively. Figure 4 shows that there is significant difference among the four groups in terms of speed of task completion. The ANOVA tables show p-value = 0.0448 and p-value = 0.2611 for time and accuracy respectively.
Task 2
Here, we can see that Groups 3 and 4 are significantly slower (mean time = 54.3 seconds) at task completion than Group 1 and 2 (mean time = 23.3 seconds). Further, the statistical significance between Group 1 and 2, and Groups 3 and 4 is near the 5% level. This indi-
Task 2 evaluated the value of using highlighting to maintain spatial information between related diagrams. Our hypothesis is that by maintaining both highlighting and spatial information when navigating between diagrams, subjects will be faster and more accurate
36
Figure 3: Task 2: finding a pin number on a specific wire for Group 1 (top-left), 2 (top-right), 3 (bottom-left) and 4 (bottom-right). Images show initial views of a wiring diagram after moving from a schematic diagram for each group. In each image, a dotted red box indicates the position of a circuit component initially highlighted in a schematic diagram. Hence, two images in the right column provide spatial information preserved. While finding an answer, Group 1 uses a highlighted component in a wiring diagram as contextual information maintained, Group 2 uses highlighting as well as position maintained between schematic and wiring diagrams, subjects in Group 3 do not have any contextual information when they move to wiring diagram, and finally Group 4 uses only spatially maintained position information.
cates that the use of highlighting actually plays the primary role in guiding a user’s focus, and the enhanced spatial relationships built into the diagram transition appears to go unnoticed by the users when a target component (in this case, a component with a specific pin connection) is displayed within the current view. As such, we can infer that spatial cues may be very dependent on whether the information that users want to find is displayed within an initial view when users switch from a schematic diagram to related wiring diagram and vice versa. From Figure 4, we see there is no difference between Group 1 (highlighting) and 2 (highlighting + spatial information) because subjects in Group 2 preferred to use the highlighting before perceiving maintained spatial information. For Group 3 (nothing) and 4 (spatial information), subjects in Group 4 preferred to search the entire diagram using mouse interactions and often failed to notice the spatial cue. It is possible that the resolution of the diagrams used for Task 2 was too small to determine the usefulness of maintained spatial information between related diagrams. To summarize, we conclude that when navigating between related diagrams, highlighting related components provides users with a significant cue.
4.3
Figure 4: Task 2 Completion time (left) and accuracy (right). Error bars represent standard error on each side of the mean.
the magic lens method. Scenario: Task 3 begins with a large wiring diagram opened and zoomed out such that subjects cannot read the words on the diagram. The component of interest is highlighted. Subjects are asked to find a specific pin number connected to the highlighted component in the given diagram without using a zoom-in method. Subjects use either a rectangular fisheye lens or a magic lens view. When subjects find the pin, they double click it indicating that a trial is completed. During three trials, timing and subjects’ mouse clicks are recorded and used for analysis.
Task 3
Groups: Subjects in Group 1 (experimental group) begin the task with a wiring diagram and are asked to use rectangular fisheye lens in the diagram to find the desired information. The rectangular
Task 3 focused on evaluating the effects of distortion within technical diagrams when using the rectangular fisheye lens compared to
37
Figure 5: Task 3: finding a pin by using the rectangular fisheye lens (left) and the magic lens (right). Subjects in Group 1 using fisheye lens (red rectangle in the left image) see contents magnified within the lens without occluding adjacent regions while maintaining overall context of a diagram, whereas subjects in Group 2 using magic lens (red rectangle in the right image) lose context occluded by the lens.
fisheye lens provides subjects with a magnified area of interest together with unoccluded neighbor context. While, subjects in Group 2 (control group) use the magic lens with occlusion of adjacent areas. Figure 5 shows screen shots for each group in Task 3. Results and Discussion: The results for Task 3 show that the performance between a rectangular fisheye lens and a magic lens is not significantly different in terms of mean time to complete subtasks (p-value = 0.3166). However, there is significance in terms of accuracy (p-value = 0.013). Figure 6 shows that mean time and accuracy for two groups. Two subjects in Group 1 answered wrong for one or two trials amongst three trials resulting in 80% mean accuracy, whereas all subjects in Group 2 answered incorrectly for one to three subtask trials resulting in 20% mean accuracy.
Figure 6: Task 3 Completion time (left) and accuracy (right). Error bars represent standard error on each side of the mean.
Our hypothesis for Task 3 is that distortion viewing of a large diagram on a small screen (such that the entire diagram is displayed but only a region of interest is viewed in a readable resolution) helps users navigate the diagram. In particular, unlike a magic lens, a fisheye lens enables users to see more contextual information while preserving the views of adjacent regions. The results from this quantitative study show that our method using the fisheye lens is significantly different in terms of task correctness. Accordingly, we conclude the following from our analysis: To find a component in a diagram, distortion viewing preserving adjacent regions such as rectangular fisheye lens can provide significant cues and enable more accurate component identification.
5
Groups: Subjects were classified into two groups; Group 1 (7 subjects) used the full functionalities of our system to perform the diagnosis after watching tutorial videos as well as self-training with the use of our system, whereas Group 2 (3 subjects) used a PDF viewer to see the diagrams related to the diagnosis. After completion of the task, subjects in Group 1 were given a post-questionnaire to collect feedback on the usability (i.e., the characteristic of being easy to use) and usefulness (i.e., the extent to which the software actually helps to solve user’s real, practical problems) of each functionality of our system. Usability and usefulness were measured using a Likert scale [Likert 1932]. Usability was ranked from “Very easy” to “Difficult”, and usefulness was ranked from “Very useful” to “Not useful”. Figure 7 shows the results. The horizontal axis lists each function of our system, and the vertical axis represents the number of subjects who answered each question in a post-questionnaire.
Field Evaluation
Additionally, a field study was conducted with 10 senior students from the school of Aviation Technology at Purdue University to evaluate the value of our visualization techniques in diagnosing a problem with a Boeing 737 aircraft. We reused the scenario performed in the tabletop exercise. No students in the field study participated in the tabletop exercise phase, nor had they previously performed this task in their class.
Usability: Figure 7 (left) shows the usability result for key functions of our system. Over 5 out of 7 subjects who used our system for the troubleshooting answered that our tools were “Very easy” or “Easy” to use (bluish bars in the graphs of Figure 7). Positively, the component highlighting, working status, magic lens, and flow animation were seen as “Very easy” or “Easy” to use for all subjects. For the transition by blending, two subjects answered it was “Not easy” and another two subjects answered “No opinion” because they were not familiar with such an interface in their field (Aviation Technology). However, they also agreed that it was certainly efficient to keep their focus by preserving contextual infor-
Scenario: This study supposes the malfunctioning of a window heater in a Boeing 737 aircraft. Voltage is not indicated when the left side window control switch has been turned on. The subjects were asked to troubleshoot this problem using relevant maintenance, schematic, and wiring diagram manuals. When measurements were needed, they were provided with appropriate guidance.
38
Figure 7: Usability (left) and usefulness (right) for each function as evaluated 7 aviation technology students.
mation in their feedback.
Table 1: Summary of the results for our quantitative study Task Time Accuracy 1 significant (p = 0.0118) significant (p = 0.0335) 2 significant (p = 0.0448) not significant 3 not significant significant (p-value = 0.013)
Usefulness: Figure 7 (right) shows the usefulness result for each feature of our system. All subjects who used our system for the troubleshooting agreed that the highlighting of related features was very useful (i.e., highlighting component and highlighting links), ranking the tools as “Very useful” or “Useful”. Additionally, 6 out of 7 subjects answered “Very useful” or “Useful” for the working status and maintaining the highlighting between related diagrams. Furthermore, some of them proposed that it would be more effective to highlight more than one component or one link at a time as well as to turn it off. As we mentioned in Section 2.2, using the magic lens and the fisheye lens were not preferred by subjects as shown in Figure 7 (reddish bars in a graph).
Table 2: Summary of the results for our field study Tool Usability Usefulness Highlighting 100% 100% Switch on/off 85% 71% Working status 100% 85% Magic lens 100% 71% Fisheye lens 85% 57% Finding power sources 71% 71% Moving to the related diagram 71% 100% Transition by blending 42% 57% Flow animation 100% 100% Maintaining the highlighting 85% Maintaining the spatial information 71%
Although the purpose of the field evaluation was to collect feedback, we also observed the troubleshooting time to complete the scenario for both groups. Subjects in Group 1 using our system took 9∼15 minutes to troubleshoot, whereas subjects in Group 2 who used a pdf viewer took 17∼32 minutes to troubleshoot the component, spending most of their time in finding related diagrams between various manuals. Our system contributed to decreasing the task time by 46∼52%.
6
General Results and Conclusion
clude that maintaining such spatial cues will play an important role in cases when users need to switch diagrams and then scroll and pan a large diagram in order to search for components they want to find. For the distortion viewing (Task 3), we find that it is significant for both quantitative analysis and field study questionnaires. In this case, distortion viewing provides both a readable resolution for the area of interest and an overview for adjacent regions. Table 1 summarizes the results of our quantitative study.
In this work, to evaluate the effectiveness of our visualization techniques for technical diagrams, we applied various visualization techniques (e.g., highlighting, spatial information by locating of a 2D viewpoint, and distortion viewing) while preserving contextual information for navigation of technical diagrams. Our evaluation consisted of the quantitative and field studies containing several scenarios, which can be occurred in real troubleshooting procedures. Further, it was focusing on assessing how the techniques help technicians understand the diagrams as well as find the desired information from them effectively and economically.
The results from the field evaluation performed by aviation technology students showed that the functionalities of our system are very useful during the troubleshooting phase of aircraft maintenance. Tool features were easy for subjects to use after watching a short tutorial video (10 minutes) and practicing with the system (about 15 minutes), and subjects answered that our tools were very helpful for maintenance work and asked us to provide our system as a training tool for their class. Table 2 summarizes the results of our field study. Additional tasks were also conducted to evaluate the effectiveness of other techniques from SDViz as shown in Table 2.
Based on the quantitative data recorded during the evaluation studies by 49 subjects, their feedback and additional 10 aviation technology students’ field study (total 59 subjects), we analyzed our visualization techniques’ effectiveness. From both quantitative analysis and field study questionnaires, we believe that highlighting components and wire connections within a diagram (Task 1) provides users with significant cues aiding in information retrieval. Maintaining contextual information such as highlighting (Task 2) between related diagrams shows a considerable difference although it is not significant. For maintaining spatial information such as the location on the screen of a selected component, we do not see a significant difference in the analysis results. However, we can con-
Based on the analysis from the evaluation study and field study, highlighting components and connections and preserving them between related technical diagrams are regarded as the most important techniques among the methods we evaluated. Distortion viewing of the diagrams was seen as less useful for users to explore techni-
39
cal diagrams and was less preferred by the maintenance personnel, as noted during the knowledge acquisition phase and final evaluation. In conclusion, we believe that various visualization techniques based on contextual preservation can help maintenance personnel progress their tasks in which technical data such as schematic and wiring diagrams are dealt with. Furthermore, we are also convinced that such techniques will significantly affect the performance of users in terms of either time or accuracy.
7
H EISER , J., P HAN , D., AGRAWALA , M., T VERSKY, B., AND H ANRAHAN , P. 2004. Identification and validation of cognitive design principles for automated generation of assembly instructions. In AVI ’04: Proceedings of the working conference on Advanced visual interfaces, ACM, 311–319. JACKSON , C. D., ACEVEDO , D., L AIDLAW, D. H., D RURY, F., VOTE , E., AND K EEFE , D. 2003. Designer-critiqued comparison of 2d vector visualization methods: a pilot study. In SIGGRAPH ’03: ACM SIGGRAPH 2003 Sketches & Applications, ACM, New York, NY, USA, 1–1.
Acknowledgements
J OHNSON , C., AND H ANSEN , C. 2004. Visualization Handbook. Academic Press, Inc., Orlando, FL, USA.
This work has been funded by the U.S. Air Force Research Laboratory Human Effectiveness Directorate under Contract FA8560-04D-6546 and by the U.S. Department of Homeland Security’s VACCINE Center under Award Number 2009-ST-061-CI0001.
L ASKOWSKI , S., AND P LAISANT, C. 2005. Evaluation methodologies for visual analytics. In Illuminating the Path: The Research and Development Agenda for Visual Analytics, J. J. Thomas and K. A. Cook, Eds. IEEE Computer Society, Los Alamitos, CA, 150–157.
References AGRAWALA , M., P HAN , D., H EISER , J., H AYMAKER , J., K LINGNER , J., H ANRAHAN , P., AND T VERSKY, B. 2003. Designing effective step-by-step assembly instructions. ACM Trans. Graph. 22, 3, 828–837.
L IKERT, R. 1932. A technique for the measurement of attitudes. Archives of Psychology 22, 140, 1–55. N ORTH , C. 2006. Toward measuring insight. IEEE Computer Graphics and Applications 26, 3, 6–9.
BARNARD , Y., AND R EISS , M. 2006. User-centred innovation of electronic documentation for maintenance. In Developments in Human Factors in Transportation, Design and Evaluation, 129– 142.
P LAISANT, C., F EKETE , J. D., AND G RINSTEIN , G. 2008. Promoting insight-based evaluation of visualizations: From contest to benchmark repository. IEEE Transactions on Visualization and Computer Graphics 14, 1 (January), 120–134.
BARNARD , Y., R EISS , M., AND M AZOYER , P. 2006. Mental models of users of aircraft maintenance documentation. In Proceedings of the International Conference on Human-Computer Interaction in Aeronautics, 232–239.
P LAISANT, C., G RINSTEIN , G., S CHOLTZ , J., W HITING , M., O’C ONNELL , T., L ASKOWSKI , S., C HIEN , L., TAT, A., ¨ , C., L IU , Z., PAREKH , N., S INGHAL , W RIGHT, W., G ORG K., AND S TASKO , J. 2008. Evaluating visual analytics at the 2007 vast symposium contest. IEEE Computer Graphics and Applications 28, 2 (March), 12–21.
B IER , E. A., S TONE , M. C., P IER , K., B UXTON , W., AND D E ROSE , T. D. 1993. Toolglass and magic lenses: the seethrough interface. In SIGGRAPH ’93: Proceedings of the 20th annual conference on Computer graphics and interactive techniques, ACM, New York, NY, USA, 73–80.
R AUSCHENBACH , U., J ESCHKE , S., AND S CHUMANN , H. 2001. General rectangular fisheye views for 2d graphics. Elsevier Science, vol. 24, 609–617.
C ARPENDALE , S., L IGH , J., AND PATTISON , E. 2004. Achieving higher magnification in context. In UIST ’04: Proceedings of the 17th annual ACM symposium on User interface software and technology, 71–80.
R AUSCHENBACH , U. 1999. The rectangular fish eye view as an efficient method for the transmission and display of large images. In ICIP ’99: Proceedings of IEEE International Conference on Image Processing, 115–119.
FARRAR , M. S. 1996. Magic Squares. BookSurge Publishing.
R EUTER , L. H., T UKEY, P., M ALONEY, L. T., PANI , J. R., AND S MITH , S. 1990. Human perception and visualization. In VIS ’90: Proceedings of the 1st conference on Visualization ’90, 401–406.
F ERWERDA , J., RUSHMEIER , H., AND WATSON , B., 2002. Visualization 2002 tutorial: Pschychometrics 101: How to design, conduct, and analyze perceptual studies of computer graphics visualization techniques.
S CHOLTZ , J. 2006. Beyond usability: Evaluation aspects of visual analytic environments. In IEEE Symposium onf Visual Analytics Science And Technology, 145–150.
G ABBARD , J. L., H IX , D., AND S WAN , J. E. 1999. User-centered design and evaluation of virtual environments. IEEE Computer Graphics and Applications 19, 6, 51–59.
¨ T ORY, M., AND M OLLER , T. 2005. Evaluating visualizations: Do expert reviews work? IEEE Computer Graphics and Applications 25, 5, 8–11.
G REENBERG , S., AND B UXTON , B. 2008. Usability evaluation considered harmful (some of the time). In Proceedings of the twenty-sixth annual SIGCHI conference on Human factors in computing systems, ACM, 111–120.
WARE , C. 2004. Information Visualization: Perception for Design, vol. 2nd edition. Morgan Kaufmann.
H EALEY, C. G. 2001. Combining Perception and Impressionist Techniques for Nonphotorealistic Visualization of Multidimensional Data. In Non-Photorelistic Rendering in Scientific Visualization, C. G. Healey, Ed., SIGGRAPH 2001 Course Notes.
W OO , I., K IM , S., M ACIEJEWSKI , R., E BERT, D. S., ROPP, T. D., AND T HOMAS , K. 2009. Sdviz: A context-preserving interactive visualization system for technical diagrams. Computer Graphics Forum 28, 943–950.
H EISER , J., T VERSKY, B., AGRAWALA , M., AND H ANRAHAN , P. 2003. Cognitive design principles for visualizations: Revealing and instantiating. In CogSci ’03: Proceedings of 25th annual meeting of the cognitive science society, 545–550.
40