EVALUATING THE IMPACT OF THE TRAFFIC RECONFIGURATION OF A COMPLEX URBAN INTERSECTION Adriana Simona Mihaita, Mauricio Camargo, Pascal Lhoste
To cite this version: Adriana Simona Mihaita, Mauricio Camargo, Pascal Lhoste. EVALUATING THE IMPACT OF THE TRAFFIC RECONFIGURATION OF A COMPLEX URBAN INTERSECTION . MOSIM 2014, 10`eme Conf´erence Francophone de Mod´elisation, Optimisation et Simulation, Nov 2014, Nancy, France.
HAL Id: hal-01166679 https://hal.archives-ouvertes.fr/hal-01166679 Submitted on 23 Jun 2015
HAL is a multi-disciplinary open access archive for the deposit and dissemination of scientific research documents, whether they are published or not. The documents may come from teaching and research institutions in France or abroad, or from public or private research centers.
L’archive ouverte pluridisciplinaire HAL, est destin´ee au d´epˆot et `a la diffusion de documents scientifiques de niveau recherche, publi´es ou non, ´emanant des ´etablissements d’enseignement et de recherche fran¸cais ou ´etrangers, des laboratoires publics ou priv´es.
10th International Conference on Modeling, Optimization and Simulation - MOSIM14 - November 5-7-2014Nancy - France “Toward circular Economy”
Evaluating the impact of the traffic reconfiguration of a complex urban intersection ˘ T ˘ Mauricio CAMARGO, Pascal LHOSTE Adriana Simona MIHAI ¸ A, ERPI laboratory EA6737, Universit´e de Lorraine 8 rue Bastien Lepage, 54010 Nancy, France
[email protected],
[email protected],
[email protected]
ABSTRACT: Traffic management problems are very challenging, especially in large and complex intersections which are under reconstruction. In this paper we evaluate the impact of the traffic reconfiguration for a complex urban intersection from Nancy France. We begin by constructing a mesoscopic simulation model using a discrete event simulation tool, FlexSim, followed by an optimization method based on evolutionary algorithms. The modeling goal is to eliminate traffic congestion caused by the undergoing modifications of the intersection, and propose an appropriate fire plan, which would adapt to a future reconfiguration. Our modeling and optimization methods which were tested in 2013 over four different configurations of the input data flow, are now being compared to recent results, in terms of blocking and average stay-times inside the modified intersection. KEYWORDS: mesoscopic simulation of transportation systems, evolutionary algorithms, optimization
1
INTRODUCTION
With the rapid growth of urban agglomerations, some of the most significant problems in transportation systems arise: congestion, pollution, rapidity to reach central locations (train stations, hospitals), fluidity during rush hours, etc. This modifications require new infrastructure, a rigorous urban reconfiguration and rethinking of the transportation systems, which may imply higher costs, mainly caused by the lack of space or other urban constraints (access facility, position, noise). Often, studies show that an extension of the city’s infrastructure doesn’t actually solve the congestion problem, but simply induces a bigger demand for traveling. These problems have lead to the development of optimization methods to improve mobility and safety, and most of all, to decrease the average time spent in traffic. Efforts have been concentrated on the implementation of Intelligent Traffic Systems (ITS), meant to provide the users with the latest traffic information by using panels, radios, internet applications (Hafstein et al., 2004). As well, studies are also concerned by the impact of the travel time feedback strategies: in (Wahle et al., 2000) the new entering vehicles in the intersection have the possibility of choosing the route with less passing time. Other examples are the vacancy length feedback strategies (the traffic control displays as each time step the distance from the last vehicle to the entrance of each road, leading the drivers to choose the road with longer vacant distance). Some recent simulation re-
sults and comparison of the above methods can be found in (Chen et al., 2012). For this wide variety of problems which appear in transportation system, the simulation of the traffic flow represents a flexible and powerful tool to analyze and test different traffic scenarios. Together with the simulation tools, a challenging aspect are the optimization methods one applies in order to choose an appropriate traffic light plan (Brockfeld et al., 2001). As this problem is usually difficult to solve by deterministic methods, we turn to bio-inspired optimization methods, such as evolutionary algorithms, together with a new traffic simulation tool, FlexSim. This method has been tested on a complex road intersection from downtown Nancy France, containing three main junctions, some of them connecting the train station to the city center, which implies a high number of buses crossing the intersection every day. The studied intersection is a part of the new ecological quarter Nancy Grand Cœur, which is currently under reconfiguration. The work presented in this paper, continues our previous studies (Mih˘ai¸ta˘ et al., 2014), by simulating and analyzing the impact of the previous chosen optimal fire plan to the actual configuration of the intersection. The paper is organized as follows. In section 2 we present the state of the art concerning different traffic simulation tools, followed by the introduction of a new simulation tool, FlexSim. Section 3 discusses different optimization approaches in traffic control, followed by the presentation of our evolutionary al-
MOSIM14 - November 5-7-2014 - Nancy - France
gorithm. In section 4 we present the comparison study between the C129 intersection from 2013 and the actual configuration, in terms of simulation requirements (subsection 4.1), statistics and tested scenarios (subsection 4.2), optimization results (subsection 4.2.2), and comparing analysis in terms of mean blocking times and average stay-times (subsection 4.2.3). Last section presents the conclusions and future perspectives of this work. 2
TRAFFIC SIMULATION TOOLS
Nowadays traffic flow and congestion are widespread time-consuming problems in urban areas, especially in industrialized countries. Hence, managing traffic with congestion problems needs an understanding of the flow operations, needing dedicated simulation tools for testing various scenarios and modifications inside a transportation system. In the literature there is a large variety of traffic simulation tools and modeling approaches, which have been conceived to respond either to the scale of the application (networks, highways, intersections), to the nature of the process (deterministic, stochastic) or to the level of details (microscopic, macroscopic), according to (Hoogendoorn and Bovy, 2001). In this section we give a brief summary of some of the existing simulation tools, according to the level of details. 2.1
Classification
The microscopic traffic models have been conceived to simulate at a high level of precision the behavior of the traffic entities inside the transportation system, such as drivers or vehicles. They are most suited for small urban areas as they calculate at each time step the speed, the position and acceleration of each entity, needing powerful computing resources. Some of the most popular microsimulation tools nowadays are: Corsim (Fellendorf and Vortisch, 2010), Vissim (Hidas, 2005), DynaSim (Nishimoto et al., 2002). If Corsim and Vissim are widely used in China, DynaSim is more popular in Europe. However this great diversity of microsimulation models raises difficulty when choosing an appropriate simulation platform. A more recent and technical comparative analysis between some of the above mentioned microsimulators can be found in (Sun et al., 2013). In comparison to the above simulation tools, the need to represent the traffic at a higher level of aggregation, as a flow, has generated the apparition of macroscopic simulation tools, such as the METACOR (Salem and Papageorgiou, 1998), which represents the traffic network as a graph. The nodes of the graph are the entrances (or the exits) in the network, while the flow of the vehicles is characterized
by various properties such as: density, velocity or flow-rate. For other macroscopic simulation tools, the reader is redirected to the works of (Zegeye et al., 2013; Li et al., 2011). At an intermediate level between the microscopic and the macroscopic level of simulation, a special interest is given to the mesoscopic flow simulators. At the mesoscopic level, the individual behavior of each entity inside the simulation is less important than the behavior of small groups of entities moving together in a probabilistic manner. The average passage time in a specific segment of the transportation model is influenced by the flow, the occupation of the segment or by its capacity. We remind some of the mesoscopic simulators such as: Metropolis (Palma and Marchal, 2002), TransModeler1 or DynaSmart2 . Recently, another efficient and flexible discrete event simulator has gained in popularity, FlexSim, which we use for the mesoscopic simulation of the modifications inside the C129 intersection. 2.2
FlexSim Simulation Tool
FlexSim is a powerful analysis and 3D simulation tool which allows to model, visualize and optimize real-life process, from manufacturing to supply chains3 . In FlexSim the user can interact with external imported data, build 3D simulation models using predefined or imported objects, construct model charts and graphs which display dynamical results during the simulation, as well as computing statistic measures once the simulation has finished. Other important assets are: the integrated built-in experimenter which allows the user to test various scenarios over a chosen number of replications per scenario, the integrated optimization tool (OptQuest) for single or multi-objective optimization, or the possibility to export the simulated results into global tables or external files for late use. Due to its improved 3D visualization and testing possibilities, FlexSim is currently being used for solving optimization problems in distribution centers (Hou, 2013), and for simulating roll-on/roll-off terminals, offshore windmills production, logistics warehouses and maritime transportation4. A detailed comparison between FlexSim and other popular discrete event simulation tools such as Arena, Witness, Promodel, can be found in (Cimino et al., 2010). In addition to the presented simulation software, FlexSim allows to create its own libraries and classes of objects, graphical user interfaces or various test applications. All the above features have led us to test and use FlexSim for the mesoscopic traffic simulation models 1 www.caliper.com/transmodeler/ 2 www.its.uci.edu/
paramics/Models.html
3 www.flexsim.com/ 4 tinyurl.com/FlexSim-maritime
MOSIM14 - November 5-7-2014 - Nancy - France
Figure 1: Block diagram of the traffic simulation and optimization that we use in this paper. Although Arena can be as well used for the traffic flow simulation as shown in (Wen, 2008), the flowchart for a simple crossroads becomes complex and difficult to follow, especially when congestion problems occur. A 3D graphical representation of the crossroads increases the problem detection and resolution. As well, an important aspect for the transportation system simulation in FlexSim, is the flexibility of controlling and implementing various triggers associated to each object inside the model, upon the specific behavior we want to induce to the simulation: lane switching probabilities, random variation of the speed of vehicles within the intersection. The results of the simulation helped us to conclude upon certain aspects of the current reconfigurations of C129, which we will present in section 4.2.3. 3
TRAFFIC OPTIMIZATION ANALYSIS
The simulation of a real-life transportation systems offers a good representation of the system’s behavior, and allows testing various scenarios in order to take the best decision when it comes to adjusting certain traffic parameters such as the traffic light plans. Traffic optimization has therefore become a necessity, especially in transportation systems which are under reconfiguration for congestion problems. When the complexity of the system grows, a decentralization of the traffic control becomes inherent. In the literature there exists several optimization methods which are based, for example, on multi-agent systems, Fuzzy logic, artificial neural networks or Petri nets (Voinescu et al., 2009). A recent comparative analysis can be found in the works of (Qureshi and Abdullah, 2013; Liu, 2007). The optimization of traffic light remains a very important problem in traffic control, and although this can be seen as a non-convex nonlinear programming problem, global optimal solutions are hard to find by traditional mathematical methods. The evolutionary
algorithms (EA) have become popular for traffic optimization problems, as they can be applied to solve single or multi-objective optimization problems, using stochastic operators without gradient information in the search process. The EAs can yield a whole set of potential solutions, unlike most classical optimization algorithms which update one solution at each iteration (Deb and Kalyanmoy, 2001). In the literature we can find interesting combinations of evolutionary or genetic algorithms with traffic simulations, such as the works of (Anfilets and Shuts, 2012; Zhiyong, 2006), and Sanchez Medina et al. (2008) which applies a genetic algorithm optimization in the microsimulation of traffic junctions from Santa Cruz de Tenerife. All these results encouraged us to apply an evolutionary algorithm in the analysis of the traffic model from 2013, for the optimization of various traffic light plans as explained in the following section. 3.1
Optimization schema
In Figure 1 we present the logical schema of the traffic simulation models we analyze in this paper, together with the optimization method using evolutionary algorithms. Based on the information we have received in 2013 for the real-world traffic intersection C129: the available fire plans for testing (which will be detailed in Section 4), and the number of cars entering the intersection during rush hours (morning and afternoon), we have built the traffic simulation model in Flexsim, which we note STM2013 and which is presented in (Mih˘ai¸ta˘ et al., 2014). The FlexSim simulation model offers the possibility to determine the mean number of cars, the mean average stay-time inside the intersection, as well as the mean blocking times in which the vehicles could not advance due to congestion (when switching lanes for example). The statistics we obtained at the end of the simulation gave us the optimization criteria for the evolutionary algorithm, which is based on the general approach
MOSIM14 - November 5-7-2014 - Nancy - France
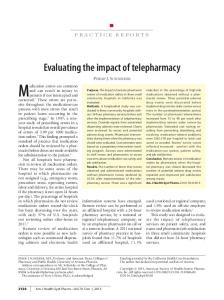
Figure 2: Aerial view of the C129 intersection (Google Maps), in 2013 (left) and 2014 (right). presented in (Perrin et al., 1997). The complete outline of the algorithm is given in Annexe A. The proposed EA allowed us to determine the optimal fire plan which was best adapted for the STM2013 model, and which was chosen from the available fire plans we have received from the local community of Grand Nancy: CUGN5 (P55 , P70 , P90 , P80 ). As the C129 intersection is currently under reconfiguration, our main objective in this paper is to analyze the impact of the current modifications inside the intersection, while using the optimal fire plan, previously proposed for STM2013. Based on the realdata we receive from CUGN in 2014, and by considering the undergoing modifications (new bus line, lanes changing) in this article we built a new traffic simulation model which we denote STM2014. The optimal fire plan is applied to the current simulation model, and gives us the possibility to conduct a comparing analysis using the mean blocking times and mean average stay-times, according to certain lane crossings which we will discuss in detail in section 4.2.3.
intersection: (a) either from the bridge Pont des Fusill´es (PF) which is the main artery (passing over the railway tracks), (b) the Joffre Boulevard coming from the train station, which also receives the vehicles from Boulevard Ghetto Varsovie (passing under the bridge), (c) the Grand Rabin Haguenaeur (GRH) street or from (d) the Cyffl´e road. The main roads to exit the C129 junction were Abb´e Didelot, Cyffl´e and Joffre Boulevard as well. In 2014, the bus line passing on the Pont des Fusill´es has been removed, and a new bus line has been attached to the intersection, as seen in Figure 2 (right). The buses can now enter the intersection near the Pont des Fusill´es, and exit towards the train station (Joffre Boulevard). The new line receives as well the buses returning from the train station, cross the Joffre Boulevard and exit the C129 near the Pont des Fusill´es. If the STM2013 had 4 vehicle entrances and 3 exits, the STM2014 model has 5 entrances and 4 exits. 4.1
4
Simulation Models
CASE STUDY
As stated in the introduction, the center of our studies is a real-life complex intersection (C129) from downtown Nancy France, for which we build the simulation models according to the data received from CUGN. This intersection is a part of a reorganization plan, aiming at re-configuring the traffic inside the city center, in order to avoid congestion and improve mobility. The main interest is to know which area of the intersection is more crowded, and which traffic plan can reduce the mean waiting time during the rush hours. An aerial view of the intersection from 2013 is shown in Figure 2 (left), when the vehicles could enter the 5 www.grand-nancy.org/
In order to build the 3D FlexSim simulation models, various elements need to be considered, such as: the fixed structure and configuration of the intersection received from the urban planners at CUGN (AutoCad sources), the numbers of cars entering the intersection during rush hours (07:30 - 08:30) and (16:30 - 18:00), as well as the traffic light plans currently in use in the intersection. The snapshots of the two FlexSim models we have conceived can be seen in Figure 3. In order to build the mesoscopic simulation models, we consider that once the vehicles randomly enter the C129 intersection, they switch lanes based on probabilistic measures that we build by using the metered data we have received. For example, in Figure 4, from
MOSIM14 - November 5-7-2014 - Nancy - France
Figure 3: Simulation of the C129 intersection in FlexSim, in 2013 (left) and 2014 (right). the 755 vehicles entering the Pont des Fusill´es in the morning, 18.68% will take left (Q direction), but the rest of the vehicles (81.32%) will turn right and exit the intersection through the Abb´e Didelot street (P direction).
in the following) and fixed number of vehicles entering the simulation (real data provided by CUGN). We can observe that Tc is proportional to Np , as shown in Figure 5 (due to different scales, the graphics are normalized : each data point is divided by the maximum term of each parameter that has been tested). Np Tc [sec]
1 Plan 89
2 Plan 185
3 Plans 298
4 Plans 397
Table 1: Tc versus Np . Ns D1 D2 D3 D4 Tc [sec] 172 353 375 575
Nr Tc [sec]
Table 2: Tc versus Ns . 1 5 10 15 25 126 271 397
20 544
Table 3: Tc versus Nr . Figure 4: Switching probabilities for STM2014. The first simulation model (STM2013) has been built in order to choose a suited fire plan which would adapt to a higher number of vehicles entering the intersection. By fire plan we denote the red-yellowgreen cycles of all the traffic lights of the C129 intersection. Four fire plans have been tested (Np = 4), which we denote: (P55 , P70 , P80 , P90 ), each lasting respectively 55, 70, 80 and 90 seconds. Due to the stochastic behavior of the system, we are also interested in the adaptability of the simulation model in FlexSim in terms of computing time, determined by the variations of three of the most important parameters: the number of replications (Nr ), the number of fire plans tested (Np ), and the number of scenarios to be tested (Ns ). More specifically, we fix two of the above parameters, and observe how the computing time of the model will vary over the third parameter. Table 1 shows the computing time when we vary the number of fire plans we want to test (as we have four fire plans, we test until Np = 4), for a fixed number of replications (Np = 15, as explained
As the intersection will be prone to a bigger inflow of vehicles during rush hours, we tested the resistance of the simulation to certain flow variations. We denote by D2 the total number of vehicles entering C129 as received from CUGN. We will then test all the fire plans (P55 , P70 , P90 , P80 ) within the D2 scenario, but as well within the following scenarios: D1 = D2 /2, D3 = D2 ∗ 2, D4 = D2 ∗ 3. The results in terms of computing times for all the above scenarios are shown in Table 2. We notice that the Flexsim simulation model is capable of simulating bigger traffic inflows without over increasing the computing time. The last test is meant to determine the number of replications needed to obtain accurate statistic results, when we run all the traffic light plans inside the D2 scenario, as shown in Table 3. Following the method suggested by (Archer and H¨ogskolan, 2005), we run successive simulations until the average mean and standard variation of the average stay-time (or the mean number of cars) fall within an acceptable confidence interval calculated in relation to the standard t-distribution. Using this procedure in accordance with a confidence interval of 95%, the number
MOSIM14 - November 5-7-2014 - Nancy - France Computing time Tc compared to Nr, Np, Ns
1
suitable in terms of average stay-time. Although the P90 gives the smallest stay-time on the Pont des Fusill´es street (Figure 7 a), we can observe that it would dramatically increase the waiting time on the Joffre Boulevard (Figure 7 b).
(Tc,Nr)
0.9
(Tc,Np) (T ,N )
0.8
c
s
0.7 0.6 0.5 0.4 0.3 0.2 0.1 0
0
0.2
0.4
0.6
0.8
1
Figure 5: Computing time Tc compared to Nr ,Np ,Ns . of runs indicated approximately 10-12 runs per scenario. Given the importance of the accuracy in the results, for the rest of the results we decided to conduct 15 replications for each time-period scenario. All the above tests are represented in Figure 5 and show the adaptability of the FlexSim model to higher variations of the model’s parameters. An important aspect of FlexSim is that it can run parallel replications of the simulation model according to the number of available processors. The simulations have been made using an Intel Quad Core i7 (2.4 GHz) computer having 8 GB DDR3 SDRAM memory. 4.2 4.2.1
Statistics and analysis
Figure 7: Tavg on the a) Pont des Fusill´es street and b) the Joffre Boulevard. This aspect lead us to analyze the variation of the Tavg versus the N rcars , for all the fire plans (P55 , P70 , P90 , P80 ), when a considerably bigger inflow of vehicles will occur (during the above mentioned scenarios: D1 , D2 , D3 , D4 ).
Average stay-times a) Whole C129 intersection [sec] avg
Average State Time: T
The first step in analyzing the impact of the current reconfiguration inside C129 is to extract statistics from the reference simulation model which we denoted STM2013. For this model, we compare and analyze the mean number of cars (N rcars ) and the average stay-time (Tavg ), needed to pass C129.
800 700 600 500 400 300
Figure 6: The total number of cars inside C129. In Figure 6 we represent the variation of the number of cars inside C129, during the morning rush hours for the D2 scenario. We notice that the P90 plan seems to allow a bigger number of cars to pass the intersection and thus to be the one suitable for bigger inflow. In Figure 7 we verify if this plan is also
0
20
40
60 80 Number of cars (Nrcars)
100
120
Figure 8: Data variations on a) C129 b) Abb´e Didelot Street Based on the results we present in Figure 8 a), we would tend to make the following remarks: a) the av-
MOSIM14 - November 5-7-2014 - Nancy - France
4.2.2
Evolutionary algorithm for the C129 750 Plan 55 sec Plan 70 sec Plan 90 sec Plan 80 sec Evolutionary Populations Optimum
700
600
avg
[sec]
650
Average State Time : T
erage stay-time inside C129 will grow as the number of vehicles entering grows, b) the best adapted plan even when a bigger number of vehicles enter the intersection, seems to be the P55 , which is in a total contradiction with the previous observations. For example, when representing the same variations on the Abb´e Didelot street (Figure 8 b), we can notice that there is a mix of possible plans which would better be adapted to a bigger number of vehicles (see the set D3).
550
500
450
Optimization problem 400
The previous results show the complexity of the C129 intersection, for which a special optimization method needs to be applied. Choosing the best adapted fire plan needs to take into consideration the fact that we search the optimal fire plan which would allow a maximal number of vehicles to enter the intersection during a minimal average stay-time. We therefore search to: PM i Maximize N rcars = i=1 N rcars PM i Minimize Tavg = i=1 Tavg subject to
i i ≥ 0. ≥ 0 and N rcars Tavg
where M is the number of streets inside the interseci tion, and Tavg the mean average stay-time that the i N rcars vehicles spend on a street i of C129 . This represents the objective criteria we optimized using the evolutionary algorithm from Annexe A. Each individual is represented by the pair (mean number of cars, average stay-time inside the intersection). The number of individuals are the total number of points resulted from each simulation, following the experimental plan as in Figure 8 (nind = 4 scenarios ∗4 fire plans ∗15 replications per scenario). The number of survivors and mutants have been set according to the input data (nsurv = 5%nind, nmut = 20%nsurv). The number of generations we have used for the data we have received is 10, but the algorithm provides good results even after 7 generations. The optimal result we obtain in Figure 9 shows us that the best fire plan which would better manage a big number of input vehicles for the STM2013, is the P90 (given by the closest point to the horizontal axis of the optimum), which is nowadays used in the C129 crossroads. 4.2.3
Congestion analysis and comparison
Based on the new reconfiguration of the C129 intersection, and using the optimal fire plan we previously detected, we build the new FlexSim simulation model (STM2014), by implementing the new bus line, as well as the new switching lane probabilities accord-
350
300
0
20
40
60 Number of cars (Nr
80
100
120
)
cars
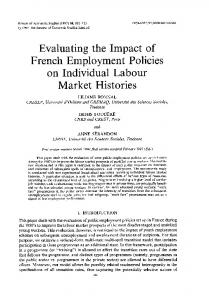
Figure 9: EA1 applied to STM2013 ing to the recent data received from CUGN. The comparison with the previous simulation model is done in terms of mean blocking times inside the intersection, as well as average stay-times, which give us a realistic representation of the congestion inside the intersection. Figure 10 shows the mean blocking times in the morning, on all the possible connections inside the C129: entrance either from the train station or the Grand Rabin Haguenaeur and exit towards Abb´e Didelot or Rue Cyffl´e, etc. Although we would have expected the P90 plan to assure less blocking times on all the main streets, we observe that the new bus line induces higher blocking times on all the vehicles entering the intersection from the Pont des Fusill´es: 14 minutes of blocked traffic when wanting to exit towards Abb´e Didelot. The exit towards the train station is more crowded than before, as 10 out of the 17 possible transitions inside the intersection have deteriorated in terms of blocking times, but we observe that 7 transitions present an amelioration especially for all the vehicles wanting to enter the C129 from the Ghetto Varsovie street. As well, we notice that the new bus line towards the train station, has an average of 8 minutes of congestion in the morning. By observing as well the average stay-time on the main arteries in Figure 11, we notice that all the streets intersected by the new bus line are affected both in terms of congestion and waiting times : Pont des Fusill´es, Joffre Boulevard and Rue Cyffl´e. The Abb´e Didelot street has gained in average stay-time due to the suppression of the bus line from PF. This study shows the complexity of the system, which needs a deeper analysis over the current state of intersection and a rethinking of traffic fire plans, in order to choose the one adapted to the current inflow of vehicles.
MOSIM14 - November 5-7-2014 - Nancy - France
Figure 10: Comparison between blocking times inside C129 in 2013 and 2014. tersection. As well we are interested in testing the impact of the undergoing modifications on the traffic flow in the whole Nancy Grand Cœur neighborhood; an extended simulation model is currently under construction. ACKNOWLEDGMENTS The authors of this work are grateful to the data and support provided by the Urban Community of Grand Nancy (CUGN), as well as to the continuous support offered by FlexSim. Figure 11: Comparison between average stay-times inside C129 in 2013 and 2014. 5
The traffic simulation model was conceived at ENSGSI Nancy France6 , and has received the 1st prize in the international discrete event simulation tournament organized by FlexSim in 20137 .
CONCLUSIONS
In this paper we have presented an evaluation method for analyzing the impact of undergoing reconfiguration of the traffic flow of a complex road intersection from Nancy, France (C129). We begin by implementing the FlexSim simulation models using real-traffic data, which gives us the statistics measures to use in the optimization method. Based on the optimization criteria, we choose which fire plan is the most adapted to the the actual configuration of the system, and which responds to a higher inflow of vehicles. This plan has been used in the simulation of the current reconstructed intersection, allowing us to analyze the impact of the modifications in terms of blocking times and average stay-times, and to detect which streets present a bottleneck behavior. A further perspective of this work is be to be able to optimize and choose the best adapted fire plan from all the possible fire plans we can conceive for this in-
ANNEX A The algorithm we present here is based on the general approach of evolutionary algorithms given in (Deb and Kalyanmoy (2001)). The complete outline of the algorithm is given in Algorithm 1, with the following associated steps: 1. The current EA is an iterative optimization process starting from an initial population of nind individuals which are supplied by the traffic simulation model, and which are characterized by two variables: the mean number of cars and the average stay-time inside the intersection. The function initialise population is respon6 Ecole Nationale Sup´ erieure en G´ enie des Syst` emes Industriels 7 www.flexsim.com/blog/flexsim-student-tournament-infrance-and-morocco/
MOSIM14 - November 5-7-2014 - Nancy - France Algorithm 1 Outline of the evolutionary algorithm. Require: nind (the number of individuals in a population), ngmax (the number of maximum generations to be created); Ensure: P - the optimized population ; Parameters: nsurv (number of survivors), nmut (number of mutants), ngen (number of populations) //Step 1: construct initial population from simulation ngen = 0; P (0) ← initialise population(); while do(ngen ≤ ngmax) //Step 2: Compute the objective criteria for all ind ∈ P (ngen) do calculate objective fct(ind) end for //Step 3: select best individuals(survivors) Psurv ← select best indiv(P (ngen), nsurv) //Step 4: generate mutants Pmut ← ∅ for i = 1 : nmut do mutant(); mutant ← generate S Pmut ← Pmut mutant end for //Step 5: generate children Pchild ← ∅ for i = 1 : (nind − nsurv − nmut) do (p1 , p2 ) ← select parents(Psurv ); child ← createSchild(p1 ,p2 ); Pchild ← Pchild child end for //Step 6: create the S wholeSnew population P ngen+1 ← Psurv Pmut Pchild ngen + +; // increase the population counter end while sible for the initialization of all the individuals inside the algorithm. By P (ngen) we denote the whole population we are creating at each generation of individuals. 2. The next step is to evaluate the population by computing the objective criteria previously defined, inside the function calculate objective fct. 3. Once the objective criteria have been computed for all the individuals of the current population, we sort and select the best individuals which we call the survivors, using the function select best indiv. This step is usually known as the sorting of solutions from best to worst, and can be also achieved by computing a domination score (Halsall-Whitney and Thibault (2006), Perrin et al. (1997)). 4. At this point, we have a selection of best individuals. We now generate randomly the mu-
tants of the population inside the domain definition of the population, using the function generate mutant. 5. The main part of the algorithm is the creation of new individuals (children), by randomly choosing two different parents (Ip1 and Ip2 ) from the population of survivors (function select parents). The combination of these two individuals inside the function create child, is made according to the equation : Ichild = Dp Ip1 + (1 − Dp )Ip2 , where Dp is a randomly selected real number between 0 and 1 each time an input Ichild has been determined. 6. Steps (2) to (5) is repeated until we reach a predetermined maximal number of generations (mgmax), where ngmax is chosen based on the expected precision of the results. To resume, this evolutionary algorithm is a population-based stochastic search procedure which selects the best members of a population and uses them to recombine and perturb locally, in order to create new and better populations until the predefined goal was reached. Overall the EA offers the possibility of having a flexible optimization procedure for the traffic flow problem we want to solve. References Anfilets, S., Shuts, V., 2012. The use of natural optimization algorithms for the implementation of adaptive control at the crossroad, in: Proceedings of the 12th International Conference Reliability and Statistics in Transportation and Communication, Riga, Latvia. pp. 227–233. Archer, J., H¨ogskolan, K., 2005. Indicators for Traffic Safety Assessment and Prediction and Their Application in Micro-simulation Modelling: A Study of Urban and Suburban Intersections. TRITAINFRA, Royal Institute of Technology. Brockfeld, E., Barlovic, R., Schadschneider, A., Schreckenberg, M., 2001. Optimizing traffic lights in a cellular automaton model for city traffic. Physical review. E, Statistical, nonlinear, and soft matter physics 64, 056132. Chen, B., Xie, Y., Tong, W., Dong, C., Shi, D., Wang, B., 2012. A comprehensive study of advanced information feedbacks in real-time intelligent traffic systems. Physica A: Statistical Mechanics and its Applications 391, 2730–2739. Cimino, A., Longo, F., Mirabelli, G., 2010. A general simulation framework for supply chain modeling:
MOSIM14 - November 5-7-2014 - Nancy - France
State of the art and case study. International Journal of Computer Science Issues 7, 1–9. Deb, K., Kalyanmoy, D., 2001. Multi-Objective Optimization Using Evolutionary Algorithms. John Wiley & Sons, Inc., New York, NY, USA. Fellendorf, M., Vortisch, P., 2010. Microscopic traffic flow simulator vissim, in: Barcelo, J. (Ed.), Fundamentals of Traffic Simulation. Springer New York. volume 145 of International Series in Operations Research & Management Science, pp. 63–93. Hafstein, S., Chrobok, R., Pottmeier, A., Schreckenberg, M., Mazur, F., 2004. A high-resolution cellular automata traffic simulation model with application in a freeway traffic information system. Computer-Aided Civil and Infrastructure Engineering 19, 338–350. Halsall-Whitney, H., Thibault, J., 2006. Multiobjective optimization for chemical processes and controller design: Approximating and classifying the pareto domain. Computers & Chemical Engineering 30, 1155–1168. Hidas, P., 2005. A functional evaluation of the AIMSUN, PARAMICS and VISSIM microsimulation models. Road and Transport Research 14. Hoogendoorn, S.P., Bovy, P.H., 2001. State-of-theart of vehicular traffic flow modelling. Proceedings of the Institution of Mechanical Engineers, Part I: Journal of Systems and Control Engineering 215, 283–303. Hou, S., 2013. Distribution center logistics optimization based on simulation. Research Journal of Applied Sciences, Engineering and Technology 5, 5107–5111. Li, J., Zhang, B., Liu, W., Tan, Z., 2011. Research on OREMS-based large-scale emergency evacuation using vehicles. Process Safety and Environmental Protection 89, 300–309. Liu, Z., 2007. A survey of intelligence methods in urban traffic signal control. IJCSNS International Journal of Computer Science and Network Security 7, 105–112. Mih˘ai¸ta˘, A., Camargo, M., Lhoste, P., 2014. Optimization of a complex urban intersection using discrete event simulation and evolutionary algorithms. Proceedings of the International Federation of Automatic Control World Congress - IFAC WC Cape Town . Nishimoto, K., Fucatu, C.H., Masetti, I.Q., 2002. Dynasim - a time domain simulator of anchored fpso. Journal of Offshore Mechanics and Arctic Engineering 124, 203–211.
Palma, A.d., Marchal, F., 2002. Real cases applications of the fully dynamic METROPOLIS tool-box: An advocacy for large-scale mesoscopic transportation systems. Networks and Spatial Economics 2, 347–369. Perrin, E., Mandrille, A., Oumoun, M., Fonteix, C., Marc, I., 1997. Optimisation globale par strat´egie d’´evolution : Technique utilisant la g´en´etique des individus diplo¨ıdes. RAIRO. Recherche op´erationnelle 31, 161–201. Qureshi, K.N., Abdullah, A.H., 2013. A survey on intelligent transportation systems. Middle-East Journal of Scientific Research 1 , 629–642. Salem, H.H., Papageorgiou, M., 1998. Metacor : a dynamic macroscopic simulation tool for corridor traffic. CESA 1998-IEEE . Sanchez Medina, J., Galn Moreno, M., Rubio, E., 2008. Evolutionary computation applied to urban traffic optimization, in: Kosinski, W. (Ed.), Advances in Evolutionary Algorithms. InTech. Sun, D., Zhang, L., Chen, F., 2013. Comparative study on simulation performances of CORSIM and VISSIM for urban street network. Simulation Modelling Practice and Theory 37, 18–29. Voinescu, M., Udrea, A., Caramihai, S., 2009. On urban traffic modelling and control. Journal of Control Engineering and Applied Informatics 11, 10– 18. Wahle, J., Bazzan, A., Klugl, F., Schreckenberg, M., 2000. Decision dynamics in a traffic scenario. Physica A 287, 669–681. Wen, W., 2008. A dynamic and automatic traffic light control expert system for solving the road congestion problem. Expert Systems with Applications 34, 2370–2381. Zegeye, S., Schutter, B.D., Hellendoorn, J., Breunesse, E., Hegyi, A., 2013. Integrated macroscopic traffic flow, emission, and fuel consumption model for control purposes. Transportation Research Part C: Emerging Technologies 31, 158–171. Zhiyong, L., 2006. Immunity genetic algorithms based adaptive control method for urban network signal. Control Theory & Applications 23, 119–125.