Evaluating the Impact of Undetected Disk Errors in RAID Systems
Recommend Documents
UDEs, their origin in real systems, their effects, and tech- niques for ...... global.aspx/power/en/ps2q02darden?c=us&cs=555&l=en&s=biz. [6] E. M. Evans.
one disk failure without losing any data and RAID level 6 ... bad blocks on a given disk is much higher now than it was then. .... This recovery could be the result of a failed ..... [5] J. G. Elerath, ââHard disk drives: The good, the bad and th
RAID6/5 MRAIDs and give examples of updating data and recovering lost data. .... for mirrored data such as interleaved declustering, chained declustering, and ...
05/25/06. 1. Multilevel RAID for Very Large. Disk Arrays - VLDAs. Alexander Thomasian [email protected]. Integrated Systems Laboratory. Computer ...
Apr 1, 2014 - 1 Department of Mathematics, Carleton College, Northfield, MN, USA ... of Mathematics, Massachusetts Institute of Technology, Boston, MA, ...
a catastrophic single disk failure by providing parity bits. ... it would allow the RAID-5 array to recover normally. ... Redundant copies of data that are very hard.
[17] Apple Computers. (2003) Xserve RAID. http://www.apple.com/server/ pdfs/L26325A XserveRAID TO.pdf [2003]. [18] IBM. (2002) IBM Deskstar 60GXP hard.
Jan 6, 2014 - Treatment and Outcomes of Breast Cancer. Robert I. ... cancer, and a second index for previously undetected conditions, using three months after cancer. Conditions ..... performance status, advanced stage, histological grade, living ...
amount of the power budget is spent when the data- intensive server ... long time to recover a maximum RPM speed, which will cause a ... we propose a new threshold model that can efficiently ... The energy consumption of a hard disk drive is.
Power Management in RAID Server Disk System Using Multiple Idle States. Hogil Kim, Eun Jung Kim and Rabi N. Mahapatra. Department of Computer Science, ...
Jun 9, 2008 - evaluate the learning support mechanisms that are used to deliver this .... or all, of the technologies such as desktop and laptop computers, software, ..... 'I was impressed with the idea of free wireless internet facility and the ...
To reduce the probability of data unavailability, whenever a single disk fails, ... We find that the conventional recovery schemes of RDP and EVENODD ...... times of different disks (excluding the backup Disk 0) with RDOR-RDP are almost.
To reduce the probability of data unavailability, whenever a single disk fails, ... Permission to make digital or hard copies of part or all of this work for ... tems have an online failure recovery mode [Holland 1994], in which the system still prov
ERP, Soft Systems Methodology, Organizational Change. 1. Introduction ..... the meanings that make those actions meaningful & relevant. In analyzing ERP ...
further VGS design scenarios using design builder software should now be ..... Figure 5: Vertical Greening System, Source: kirhammond.wordpress.com, ...
In this paper, we report on whether OCR errors have any effect on training categories or on the ... Using Bayes' theorem, we can calculate this probability by:.
Design errors are inevitable in the construction industry. Many researchers consider ... and electrical design [16]. Mechanical, electrical, and plumbing systems (MEP systems) have .... Project 10 (commercial building). 2.71*. 2.55. 2.20. 2.67.
In practice, owner, designer, contractor, and other stakeholders have different interests in the design [3]. These various interests certainly lead to design errors ...
Dec 1, 2013 - The number of pharmacist interventions increased from 15 to ... for administration to the patient.4 ..... Comprehensive accreditation manual for.
Technical school certiï¬cate 0 l 0 3029. High school diploma and above 0 1 0-092. Non-response 0 1 0, 1017. Reason of entry into the sampled unemployment ...
in English, one would expect that the subjects of passive sentences, which are patients .... experiment was conducted in two parts with the task for the active sentences done ..... Turning to the second research question, is there a significant assoc
Jan 12, 1995 - Chane L. Fullmer, Darrell D. E. Long y. Computer and ... achieved one half of the write throughput for RAID level 4. (about 900 ... This type of operation amounts to an automatic .... The client and each server keep them until the succ
the disk was used to store executable files and libraries that were shared by 14 Sparcstations through NFS. ... HP 9000/720 diskless workstations. .... Power state transition is an effective approach for laptop disk drives to save energy. This is.
19] showed that disk failure rates typically remain below 8 to 9 percent per year. This meant that a disk mean time to failure (MTTF) of 100,000 hours was a good ...
Evaluating the Impact of Undetected Disk Errors in RAID Systems
Keywords: silent data corruption, undetected disk errors, sim- ulation, modeling ... other hand, are persistent errors which are only detectable dur- ... a given storage system, one must model the disks at a fine level ... then derive a model for UDEs for use in our simulation, this ... A subsequent (good) write to the affected track.
Evaluating the Impact of Undetected Disk Errors in RAID Systems Eric W. D. Rozier1,2 , Wendy Belluomini1, Veera Deenadhayalan1 , Jim Hafner1 , KK Rao1 , Pin Zhou1 IBM Almaden Research Center1 , University of Illinois Department of Computer Science2 Email: [email protected], {wb1, veerad, hafner, kkrao, pinzhou}@us.ibm.com
Abstract Despite the reliability of modern disks, recent studies have made it clear that a new class of faults, Undetected Disk Errors (UDEs) also known as silent data corruption events, become a real challenge as storage capacity scales. While RAID systems have proven effective in protecting data from traditional disk failures, silent data corruption events remain a significant problem unaddressed by RAID. We present a fault model for UDEs, and a hybrid framework for simulating UDEs in large-scale systems. The framework combines a multi-resolution discrete event simulator with numerical solvers. Our implementation enables us to model arbitrary storage systems and workloads and estimate the rate of undetected data corruptions. We present results for several systems and workloads, from gigascale to petascale. These results indicate that corruption from UDEs is a significant problem in the absence of protection schemes and that such schemes dramatically decrease the rate of undetected data corruption. Keywords: silent data corruption, undetected disk errors, simulation, modeling
1. Introduction Despite the reliability of modern disks, recent studies have made it increasingly clear that a new class of faults, that of undetected disk errors (UDEs) are a real challenge facing storage systems as capacity scales [2, 11, 7]. While RAID systems have proven quite effective in protecting data from traditional failure modes [13], these new silent data corruption events are a significant problem unaddressed by RAID [2]. UDE faults themselves are drawn from two distinct classes, undetected read errors (UREs) and undetected write errors (UWEs). UREs manifest as transient errors, and are unlikely to effect system state beyond their occurrence. UWEs, on the other hand, are persistent errors which are only detectable during a read operation subsequent to the faulty write, and thus manifest in a similar manner to a URE [7]. Metrics to quantify the occurrence of data corruption due to UDEs have not been presented before since these events have been deemed to be very rare. Recently capacity scaling has made UDEs common enough to be a concern and drives further study both on the rate of occurance of these faults, and their manifestation as errors from a user perspective. While both evidence of UDEs and suggested techniques for their mitigation have been outlined in the literature [2, 7], it
is clear that there are several situations where many of these techniques will not be able to prevent UDE induced faults from manifesting as errors [11]. Given that the rate of UDE occurrence is low, testing these techniques in a real system would be costly, likely requiring a prohibitively large array of disks to witness UDEs in large enough quantites to derive measures of their effects within a reasonable period of time. A need therefor exists for modeling tools which address the particular challenges presented by such systems. A model provides the capability to analyze the risk posed by UDEs in a given system and the fault tolerance coverage provided by suggested mitigation techniques. A simple analytical model could fail to account for important emergent trends in UDE manifestation for a given workload. For example a block that has had a UWE error must be read before that fault manifests as data corruption and therefore the chances of system failure depend on the I/O stream in question. A simulation approach that is customizable and can determine the effect of UDEs for an abitrary workload is an effective way to capture this behavior. Efficient simulation of UDE faults in large scale systems proves to be a serious challenge, however, due to the stiffness of the system. A system is said to be stiff when events occurring on vastly different timescales must be simulated in order to capture the behavior one wishes to model. In order to fully understand the effect of UDEs and how they manifest in a given storage system, one must model the disks at a fine level of detail, looking at individual block read and write information in order to track portions of the disk which are suffering from a UDE, the propagation of UWEs due to normal operations within the RAID system (including rebuild events), and the effectiveness of mitigation techniques to prevent a UDE based fault from manifesting as an error. This means any model of such processes will necessarily consider events on two very different scales, from the very fast block level I/Os (with a rate of roughly 100 ios/sec), to the much rarer UDEs (with a rate of roughly 10−12 UDEs/io). In order to satisfy these requirements we present in this paper an extensible hybrid framework for simulating large scale storage systems that combines discrete event simulation on multiple levels of resolution with numerical analysis in a hybridized fashion. Our methods take advantage of dependency relationships within a the I/O stream to temporally switch between numerical methods, a block level discrete event simulator, and a hybridized numerical model with some discrete events simulated. Our techniques achieve a more efficient use of time and space than discrete event simulation alone. These
methods have been implemented in a simulator which takes as input a model of a storage system and a model of a workload, and produces as output an estimate of the rate at which UDEs manifest as corruption at the user level. Our simulator has been designed in a way that allows the user to build component level models of storage systems, extend components to create new behavior, and test under arbitrary workloads and rates of UDEs. Mitigation techniques can be easily implemented by extending the implemented base classes for disks. The paper is organized as follows: We will first discuss UDEs, their origin in real systems, their effects, and techniques for mitigating UDEs provided by the literature. We will then derive a model for UDEs for use in our simulation, this derivation includes determining appropriate rates for the various types of UDEs, as these rates have yet to be determined in the literature. Next we will discuss how we create workload and system models models for a novel hybrid simulator and the operation of the simulator itself. Finally, we present our results which illustrate the problems posed by UDEs as systems scale, and the effectiveness of even simple mitigation techniques in preventing the faults injected by UDEs from manifesting as undetected data corruption events.
2. Undetected Disk Errors A growing concern in the storage community has been errors for which RAID [13, 14] does not provide adequate protection. Schroeder and Gibson note that despite a supposed MTTF for drives ranging from 1,000,000 to 1,500,000 hours field data suggest that MTTF is, in practice, much lower [15]. By analyzing data corruption events for over 1.53 million disks in production storage systems Bairavasundaram et al. documented cases of data corruption events that occurred in a 41 month period. This work illustrates the existence of several types of rare faults which manifest as corrupt data blocks. These errors were detected by their production system due to additional detection mechanisms implemented at the filesystem layer by their system. We refer to these silent data corruption events [10, 14] as undetected disk errors (UDEs) [7]. UDEs differ from seemingly similar faults, such as Latent Sector Errors (LSEs), due to the fact that unlike other failure modes when a UDE occurs the drive reports the operation occured appropriately and the state of the drive is as expected. Unless detected through explicit means in the I/O stack a UDE has the potential to result in incorrect data being served to user level processes.
2.1 Introduction UDEs can be divided into two primary categories, undetected write errors (UWEs) and undetected read errors (UREs) [7], and arise from a variety of factors, including software, hardware and firmware malfunctions. The primary difference between UWEs and UREs is that UREs are transient in nature, while UWEs result in a changed system state that can cause
many subsequent reads to return corrupt data. Table 1 summarizes the primary types of UDEs, and how they manifest as actual errors on the disk [7]. Dropped writes occur when the write head fails to overwrite the data already present on a track. In this case the disk remains in its previous state as if the write never occured [7]. Off-track writes (also referred to as misdirected writes) come in two categories, near and far off-track. Both types occur when the write head is not properly aligned with the track. In the case of a near off-track write, the data is written in the gap between tracks, adjacent to the intended track. On a read operation, the head may align itself to either the target track, or the off-track, potentially producing stale data. Far off-track writes occur when data is written even further off-track, such that it corrupts data in another track entirely. Subsequent reads to the track which was mistakenly written will produce corrupt data, while reads to the track which was intended to be written will produce stale data. [7] It is important to note, however, that not all UWEs introduced disk errors manifest as a user level undetected data corruption error. A subsequent (good) write to the affected track will remove the error, preventing undetected data corruption. Likewise a near off-track write will cause future reads to randomly return either good or stale data. Though a far off-track write results in both stale data on the intended track, and corrupt data on the unintended track, if the unintended track is not currently in use, that part of the effect will be mitigated. Likewise, a UWE may manifest as several undetected data corruption events if the same track is read multiple times before it is corrected by a subsequent write operation. Thus a one-to-one correspondance does not exist between UDEs and user level undetected data corruption errors. We will investigate the rate of UDE manifestation as undetected data corruption errors in Section 4.
2.2
UDEs in RAID Storage Systems
Systems designed for high reliability often make use of RAID storage systems. While there has been little study of the effect of UDEs in RAID systems, it has been shown that data scrubbing, the normal disk error mitigation and detection technique in such systems, is not sufficent to protect against all UDEs [11, 7]. Even under RAID6, the most powerful RAID technique in common usage, a data scrub may incorrectly assess the integrity of data due to a UDE [7].
2.3
Mitigation
Despite the threats to data integrity and storage system reliability posed by UDEs, production systems rarely implement detection and mitigation strategies [6]. Methods have, however, been proposed, if not evaluated in real systems. One family of proposed methods to mitigate the effect of UDEs in RAID are of the form of parity appendix methods [7]. In these methods, metadata is co-located with some or all of the blocks associated with a chunk of data and its parity blocks. In
Table 1. Summary of UDE types and manifestations
I/O Type Write (UWE)
UDE type Dropped Write Near off-track write Far off-track write
Read (URE)
Near off-track read Far off-track read
our models we focus on a data parity appendix method [4, 7], which utilizes the metadata portion of a block to store a sequence number. This sequence number is the same for all blocks in the write. UDEs can be detected with this method by comparing the sequence numbers stored in the parity and data blocks. The sequence numbers won’t match when a UDE manifests as an error unless a collision occurs in the sequence number with probability 1 P (Seq(Parity) = Seq(UDE)) = b 2 where b is the number of bits allocated for the sequence number. On a read, the sequence number for each data block is retrieved from parity and compared, allowing this technique to mitigate UDE manifestations, at the cost of an extra read. We model sequence numbers in our study by storing each sequence number with the block state information in our model as an 8-bit number, representing the actual sequence number for the block. Sequence numbers are drawn uniformly from a discrete Uniform distribution [12] [0, 255]. On a far off-track write, or dropped write, the original target blocks have their sequence numbers unchanged. The new target of a far off-track write will get the sequence number intended for the original target. near off-track writes result in two sequence numbers for a given block, one for each sub track. Sequence number mismatches are handled, by marking the affected blocks as unreadable.
2.4 Modeling UDEs Storage systems faults are complex events, arising from a combination of hardware, software, and firmware malfunctions. In the case of well studied faults, such as latent sector errors, and complex models have been derived to capture detailed relationships and correlations. Bairavasundaram et al., when designing a model for latent sector errors, capture temporal and spatial locality measures [1]. Schroeder and Gibson in their study of MTTF propose and fit both Weibull and Gamma distributions, obtaining better results than with exponentially distributed interfailure times [15]. Unfortunately when it comes to UDEs, there is very little information on their rates of occurance, let alone enough data to fit multiparameter distributions, or ascertain spatial and temporal relationships on their failure. As such, we choose to model UDEs in our study with exponential interfailure times, and make no assumptions
Manifestation Stale data Possible stale data on read Stale data on intended track Corrupt data on written track Possible stale data Corrupt data with respect to temporal and spatial locality. While we make this assumption about the distribution of UDEs, our methodology is not contingent on this assumption. Our simulator has been designed to be flexable about the distribution of UDE interarrival times, and temporal and spatial locality. Given additional data on UDEs we hope to refine these assumptions in the future. Rates for the occurance of UDEs have not yet been published, as such we make a first attempt in this paper to derive rates of UDEs from published materials. We can estimate the rates of UDE occurrence by using a combination of the data presented in [1] and the data presented in [2]. In [1], a study of latent sector errors was presented for the same set of field data that was used to derive the statistics on UDEs in [2]. Since latent sector errors are hard errors, which have manufacturer provided rates, we can approximate the workload run on the field systems by back calculating from the rate of hard errors observed. We start this calculation by making some observations and assumptions about usage patterns. Nearline drives have a maximum I/O rate of 100 IO/s; enterprise drives have a maximum I/O rate of 200 IO/s. For the purposes of this calculation, we will assume a system block size of 4k, and thus that each IO is 4k. We assume that the read ratio is 60% (i.e. reads are 60% of the IO stream and writes are 40%). We also assume that the drives are used at high utilization some number of hours in the day and at low utilization the rest of the time. Nearline drives have a hard error rate of 1 uncorrectable sector for every 1014 bits read and the corresponding rate for enterprise drives is 1 uncorrectable sector for every 1015 bits read. We treat drives with up to 10 sector errors as having 10 individual occurrences of sector errors. The spatial locality analysis in [1] appears to validate this assumption. If a drive has more than 10 sector errors (some have hundreds of errors), we view these as manifestations of the same occurrence (for example a scratch along a track taking out several consecutive sectors) and ignore them. We focus on drives used for the 24-month period in described in [1]. During this period, there are 68,380 nearline drives with a total of 25,827 latent sector errors (using the above filter). There are 264,939 enterprise drives with a total of 13,989 latent sector errors. To reverse engineer the workload parameters, we adjust the high and low utilization rates and hours until the predicted latent sectors errors align reasonably
closely with the observed values. By setting the high utilization to 50% for 10 hours per day, and the light utilization to 10%, we predict 22,302 latent sector errors for nearline drives and 17,282 latent sector errors for enterprise drives. We validate these assumptions by comparing these calculated latent sector error numbers to those reported in [1]. The above numbers are close enough to what has been reported in [1] (25,927 for nearline and 13,989 for enterprise) that we believe that our calculations represent a reasonable estimation of the workload. Now that we have a representative workload, we can derive the rate of UDEs from the data in [2]. We look at agenormalized disk drives and their statistics. There are approximately 270,000 nearline drives and 1,150,000 enterprise drives in the 17-month period observed in [2]. We assume that multiple corrupt fields (e.g. multiple checksum mismatches) on the same drive are manifestations of the same event. Thus, we use the count of corrupt drives as equivalent to the count of corruption events. The spatial locality analysis in the [2] appears to validate this assumption. In [2] corruption events are not classified into dropped writes, far off-track writes and near off-track writes. Instead they are classified by the way they manifest in the detection logic of the system. Corruptions in [2] are classified as checksum mismatches (the checksum is incorrect), identity mismatches (the intended LBA does not match the actual LBA), and parity mismatches (the data does not pass a parity scrub). We believe that checksum mismatches are caused by far off-track writes that write across 4 KB file system data blocks, and by hardware bit corruption. Identity and parity mismatches are caused by dropped writes and near off-track writes. In [2], there are 1,782 reported checksum errors, 113 identity mismatches, and 297 parity errors in the nearline systems and 690 checksum errors, 68 identity mismatches, and 199 parity errors in the enterprise systems. We combine the identity and parity errors to determine a combined dropped and near off-track rate of 4.01·10−12 /write in nearline systems. We use the checksum error rate to determine a far-offtrack and hardware bit corruption rate of 1.4 · 10−11 /write in nearline systems. The corresponding rates for enterprise systems are 2.47 · 10−13 and 6.38 · 10−13 . These rates, summarized in Table 2, are of course estimates made from a single (although large) field sample, but we believe that they are sufficient to make the output of the simulator useful in determining the impact of UDEs. In our results we also provide a sensitivity analysis to show how the results change when these rates change. Table 2. Estimated rates of UDEs in UDEs I/O .
UDE Type Dropped I/O Near-off Track I/O Far-off Track I/O
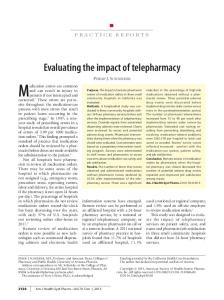
Figure 1. Two state DTMC read/write workload model.
3. Simulation Framework Given our assumptions that UDE manifestation is likely highly correlated to the workload and system in which they occur, we take a flexible approach in building our simulator. Our solution techniques do not make any assumptions about the underlying workload or model, allowing the user to construct appropriate workloads or models based on their own needs or assumptions. We provide a common interface for workload models, allowing the use of traces, or probablistic models (as was used in our evaluation), and a framework for constructing a storage system model by composing common component level objects, which can be subclassed as needed to increase the library of components from which the system can be built. Once a workload model and system model have been created, we utilize a multi-modal simulator which executes the model at three different resolutions, based on a dependency relationship with UDEs which occur in the I/O stream.
3.1
Workload Modeling
The manifestation of UDEs as actual data corruption events is dependent on read operations following a write which suffers from a UDE (or in the case of UREs, just simply a read operation). This fact makes modeling the workload for the system an important consideration. The mix of reads and writes impacts the manifestation of UDEs, as does the correlation of reads and writes in time. While this fact drives a desire to use realistic representative work loads in any simulation, perhaps even traces, the rare nature of UDEs makes makes this a difficult proposition. Utilizing a trace based simulation has two problems. The first is a lack of sufficiently detailed traces, and the second is a lack of traces of sufficient length. Due to the long periods of time involved in simulating UDE mitigation, one requires hundreds, if not thousands, of days of block level traces. Additionally, trace based analysis is limited to a handful of possible trajectories in the file system, only those captured in the available traces. Given these limitations we form a simple probabilistic model of the workload which we use to generate synthetic workloads that statistically match available traces. Generating a representative synthetic workload has proven difficult in the past, and is still largely considered an open problem. For the purposes of this analysis we present a simplified workload model which captures the primary metrics of interest for our needs, namely the ordering of reads and writes, which can be directly parameterized using real traces to which
we have direct access. Despite our selection of this method of workload modeling, our simulator has been designed in a flexible manner which allows it to utilize any workload model a user would like to design. The main simulator couples with the workload model simply by requesting events from the workload model, including the type of I/O, and size and location of the write, and the time until the next I/O. It then injects UDEs as appropriate. In order to characterize the workload used in our study, we create a statistical model of five primary features from a given trace.
Table 3. Parameters for the workload models.
Parameters io/s uc/s sizeio P (R) P (R|R) P (R|W ) P (W |R) P (W |W )
• I/O Size - Based on our analysis of some available traces we model the size of an I/O operation within the simulator as a Exponential random variable with a mean request size of sizei/o blocks. • Read/Write Composition of the I/O Stream - When the simulator is not suffering from a UDE, our simulator discards I/O events rather than simulate them, as they cannot have an effect on the rate of undetected data corruption errors. When an UDE does occur, it is important to know whether it occurred during a read operation (and is thus transient) or during a write operation, (and could thus lead to a series of data corruption events). Towards this end we estimate the parameter P (R), which tells us the probability with which a given I/O is a read request. • Correlation of I/O Stream Composition - In our analysis of available traces, we found that an I/O request for an individual chunk is highly temporally correlated with the most recent I/O for that same chunk in the trace. In order to model this behavior we utilize a discrete time Markov chain (DTMC) for each active chunk to determine the next I/O operation that will take place after a read or a write, as illustrated in Figure 1. This model has four transition probabilities which we estimate from the trace data. P (R|R) is the probability of a chunk being
Write Heavy 122.04 16.2623 3465.98 B 0.23161 0.4488 0.8339 0.5512 0.1661
Read Heavy 90.24 7.2226 2448.94 B 0.82345 0.829483 0.204677 0.170517 0.795323
read if the most recent I/O for the chunk was also a read. P (R|W ) is the probability of a chunk being read when the most recent I/O request was a write. P (W |R) is the probability of a chunk being written when the most recent I/O request was a read, and finally P (W |W ) is the probability of a chunk being written when the most recent I/O request was a write.
• Per Disk Rate of I/O - Given that our UDE rates are in units of UDEs I/O , it is important to know the rate at which I/O is conducted in our workload. This rate is captured in the workload parameter io/s. Our workload model assumes exponentially distributed interarrival times, with rate io/s. • Diversity of the I/O Stream - Just knowing the rate of incoming I/O requests is not, however, enough to characterize the system. We also need some measure of the diversity of the I/O stream. While io/s measures the number of I/O requests per second, it tells us nothing about the average number of unqiue chunks on which I/O operations are performed, per second. We introduce the parameter uc/s to model this, which is a measure of the unique chunks read or written each second.
Abstract 100 10 4096 B 0.6 0.6 0.6 0.4 0.4
Table 3 indicates the values of these parameters for three different workloads. The first workload, which we call the Abstract Workload, is derived from parameters assumed in the calculations presented in Section 2.4 derived from [2] and [15]. Both the “Read Heavy” and “Write Heavy” workloads are estimated empirically from actual disk traces. Separate DTMCs are kept in the workload model for each chunk on the disk that is being read or written.
3.2
Storage System Modeling
In order to understand the manifestation of UDEs into userlevel undetected data corruption errors, we present a block level model of storage systems which can be used to understand the actual effects of these faults in real systems. This block level model is designed to be easy to extend and compose with other similar models to allow for the construction of more complex disk models. Each individual block level model keeps track of the state of a single disk. Models can be composed to allow the simulation of various RAID configurations and techniques for detecting UDEs. In our models, for example, a RAID6 system is simply a subclass of a disk, which contains a number of composed disk models. RAID6 with mitigation is simply a subclass of our RAID6 model which implements the sequence number data parity appendix method described in Section 2.3.
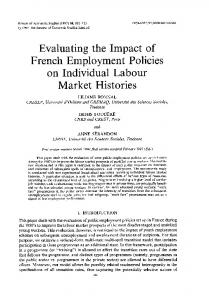
3.2.1 Block Level Model. In order to determine the state of the individual blocks on a given disk, each disk block is modeled as a non-deterministic finite automaton (NFA). The set of states Q of the NFA represents the states of the block, and is comprised of the union between a set of stable states
Qstable and unstable states Qunstable defined by
efficent implementation of even very large disks. This sparse matrix is represented with a hashtable, using a hash function of Q = Qstable ∪ Qunstable LBA mod n, for some n. While a simple function, it exploits Qstable = {good, stale, corrupt} the fact that UDEs will most often manifest on a disk as a string Qunstable = {stale-good, corrupt-good, of consecutive blocks in a state other than good. The modulo corrupt-stale} function then works to try to ensure that consecutive blocks will appear in different elements of the hashtable, which keeps Unstable states differ from stable states in that the behavior of access times for the hash table at a minimum. This improves a read operation is ill-defined and may return either good data, the time it takes to update the state of our various block level or corrupt/stale data. They are used to model the effects of near NFAs, and thus overall simulation time. off-track writes. In the case of an unstable state where one of Individual disk models are composed with a controller to the tracks is good, a read to that track will not necessarily form RAID units. The controller model presents to the simmanifest as an error. We assume it will read a given track track ulator an interface to write to the underlying disks as if they with: were a single larger disk. It performs the calculations of which P (read track good) = P (read track {stale,corrupt}) = 0.5 stripe to write to on a block by block basis to enforce the RAID model. The RAID interface also serves to inform the simulator of the number of actual disk reads and writes executed per The unstable state corrupt-corrupt is omitted from requested operation so that UDEs occurring due to a single this set, as it seems equivalent to a corrupt state, as is logical write to a RAID system will be generated appropristale-stale for similar reasons. ately for the larger numbers of actual disk reads and writes The sector model transitions from state to state on a set performed due to RAID operations such as read-modify-write. of input symbols Σ, which correspond to the write events to Each RAID unit undergoes weekly scrubbing, and we make the sector, both faulty and non-faulty. The set of faulty write the assumption that during a scrub all UDEs will be detected events corresponds to the set of UDE events discussed in Secand marked unreadable so as not to result in a data corruption tion 2, which is shown below. event in the future. Σ = {GW, DW, N-OTW, F-OTWH , F-OTWO } Parity scrub mismatches are handled by marking the affected blocks as unreadable, meaning that any reads from the Symbol GW represents a good write event. DW represents a workload stream to these blocks will not be executed. On a dropped write event. N-OTW represents a near offtrack write successful write operation (UDE or otherwise) to a block, this event. F-OTWH indicates a far offtrack write event which was status is changed via the NFA in Figure 2 treating the unreadintended to write to this block but instead wrote to another. able sector as being in the good state just before the write. F-OTWO represents a far offtrack write event which was in3.3 Simulator architecture tended for another block but was instead incorrectly written to the block in question. Given the rare nature of UDEs, attempting to calculate the Figure 2 shows the NFA states with transitions for a sinmean rates of undetected data corruption due to their injecgle block, indicating how the block changes states due to UDE tion into a storage system using just discrete event simulation events. Of particular importance is the fact that from all states would prove prohibitively costly. With the rates given in Taa good write event brings us to the good state, masking the ble 2, it is not unreasonable to expect 1013 or more I/O events UDE. This fact is important when considering how a UDE in between UDEs. Even given a discrete event simulator cafault manifests as an actual error. In the case that a UDE ocpable of processing 107 or more events per second evaluating curred, but the same blocks were again written with no error a single UDE event would take almost a month on modern before a read for those blocks was issued, the fault will not workstations. This makes simulating a large number of UDEs manifest as an error. impractical, and seems to preclude their analysis via simulation. 3.2.2 Disk Level Model. In order to represent an entire We attempt to solve some of the efficiency issues inherent disk, the block level model indicated in Section 3.2.1 is implein simulating a stiff system by designing our simulator to have mented for every block in a disk, forming our base disk model. three operating modes (illustrated in Figure 3), and allowing Each block is indexed, and thus can have individual write opthe simulator to dynamically switch between modes to maxierations directed to it, causing state changes in the underlying mize efficiency while maintaining accuracy in estimating the automata. For efficient storage of the automata, we take adrate of undetected data corruption served to the user. The first vantage of the fact that, barring a UDE which is by definition a operating mode, which is purely analytical, is also the simrare event, the entire disk consists of blocks in the good state. plest. It takes the parameters of the system model, workload By representing the state of all blocks in a disk using a sparse model, and the rates entered for the various UDE types, and matrix with good as the default value, we achieve a space from this estimates the UDE rate of the composed model and
N−OTW
DW || F−OTWH
N−OTW || F−OTWH corrupt−stale
N−OTW
corrupt−good N−OTW
N−OTW GW
GW
DW || F−OTWH stale
GW F−OTWO F−OTWO
GW
N−OTW
DW || F−OTWO || F−OTWH
F−OTWO good
DW || F−OTWH
corrupt GW
DW || F−OTWH N−OTW
N−OTW
GW F−OTWO
stale−good N−OTW F−OTWO
Figure 2. NFA representation of transitions in the block model.
generates an exponentially distributed interarrival time. The internal clock which is used to determine the next event is then advanced to the indicated time, our metrics are updated, and we process the UDE as appropriate. The second mode utilizes discrete event simulation to model the interaction of the workload with the faults injected into the storage system. In order to determine which events occurring in the storage system cause a user level undetected data corruption event, lists are maintained of both those chunks being actively read and written, and the chunks in the storage system which have suffered from a UDE. Only those events which add or remove chunks from the active list, or access faulty disk blocks are explicitly simulated. Since all other operations will either read a chunk composed of good blocks, or write a good block to a block which is already good, they cannot affect the state of blocks within the system. When the UDE can no longer manifest as a data corruption event, i.e. when all active chunks which intersect with the faulty chunk are no longer active, or when the faulty chunk is overwritten with good data, we pass from discrete event simulation into our simulator’s third operational mode. The third mode is a hybrid of the first two, and combines discrete event simulation at a higher level of abstraction than the second mode, with calculations which utilize a rate adjustment to estimate the probability of a UDE before the next discrete event. Despite the fact that by the third mode of our solution technique the UDE can longer manifest we must be careful to respect the dependency the system has with respect to the last UDE injected into the system, for the admittedly unlikely case that a second UDE might occur before the system is no longer dependent on the events of the last UDE. This is done by modeling the flow of chunks into and out of the active
list, and calculating the probability of a UDE before the next flow of a chunk into or out of the list and adjusting the rate of the next UDE based on the current composition of the active list. The following sections describe the modes in more detail. UDE UDE can no longer manifest as error Model Flow of Active Chunks for Block Level I/O Events Rate Tilting
Numerical Solution
Discrete Event Simulation
Hybrid Numerical and Discrete Event
Figure 3. Simulator Architecture
3.3.1 Analytic Mode. Our simulator begins in its first mode, and calculates the expected rate of a UWE or URE. This is done by first finding the expected number of reads and writes generated by an I/O operation to one of the RAID units. An example of how this calculation is accomplished with RAID5 using read-modify-write is given in Figure 4. Given a RAID5 strip size of sizestrip , and a stripe width of w data disks plus one parity, the expected number of writes for a read-modifywrite operation is equal to the number of required strips, plus one write per stripe written to update parity. One read is likewise required for each strip written in a row, plus an additional potential read if the write crosses a row boundary. On a read to the RAID system, only a single read is performed. Using the calculated values from Figure 4, it is possible to find the rate of UDEs, given an I/O rate of λIO of which pread
Figure 4. Actual writes and reads required to perform a RAID5 read-modify-write.
are reads, And it is possible, using these parameters to generate a time to the next UDE (TUDE ) as shown in Figure 5 Once we have determined a UDE will occur, we determine the type of UDE (UWE vs. URE) and the mechanism (dropped, near-off track, far-off track) via uniformization [9]. In the case of a URE, the error is transient, and we remain in numerical mode after handling the UDE. In the case of a UWE, the error does not manfiest immediately, and we switch the simulator into the discrete event simulation mode. 3.3.2 Discrete Event Mode. The discrete event simulator makes only slight modifications to methods discussed in [3]. Pseudo-code for a single pass through the main simulation loop is illustrated in Figure 6. The primary modification to the standard algorithms is our creation and maintenance of two lists, the active chunk list, CA , and the tainted chunk list CT . The set CT is comprised of all chunks which have blocks affected by a UDE that can still serve corrupted data to the user. Between this set, and the set of all chunks being actively read and written, CA , we can identify I/O events which do not affect system state and safely discard them without updating the state of the simulator beyond advancing the clock. This is because all events which do not modify the state of a block within CT , or which do not alter the composition of CA or CT cannot serve corrupted or stale data, or affect the rate at which additional UDEs occur. At each step in the simulator, we process one event, comparing it to CA and CT to see if our metric depends on the event, processing it if it does, and modifying CA and CT if necessary. We continue with discrete event simulation until such a time as CT ∩ CA = ∅. When this occurs, all UDEs have either been mitigated, or the chunks they occurred on will not be read again until first written, and we no longer need to simulate I/Os on a block level as they cannot result in a data corruption error. However, it is not enough to simply return to our first, analytic, mode. So long as CA,i 6= ∅ and CA,i ∩CA,0 6= ∅, where CA,0 was the active chunk list when it was first true that CT ∩ CA = ∅, and CA,i is the active chunk list at some time i, we have a dependence on the state of the simulator during the previous UDE, which must be maintained in the case that another UDE were to occur before CA,i = ∅ or CA,i ∩ CA,0 = ∅,
nextEvent ← eventList.head() clock ← clock + nextEvent.interarrivalTime if nextEvent.io ∩(CA ∪ CT ) then Process nextEvent if nextEvent reads a block which suffered from a UDE then Record UDE, update MTTDC else {nextEvent writes a set of blocks B which suffered from a UDE} CT ← CT ∪ B end if end if if nextEvent is a chunk leaving CA then CA ← CA \ nextEvent end if if nextEvent.io \ CA 6= ∅ then CA ← CA ∪ nextEvent.io CT ← CT ∪ nextEvent.io end if Schedule new event of the same type as nextEvent Figure 6. Pseudo-code representation of a single pass through the main loop of the discrete event simulator.
and thus we switch into our Hybrid mode instead of Analytic. 3.3.3 Hybrid Mode. The Hybrid mode of operation for our simulator uses discrete event simulation to manage the contents of CA . When a chunk leaves CA , it removes it from the set, and when a chunk enters, it increments a counter of implicitly simulated active chunks, active chunks represented by this counter are treated as the expected value of an active chunk from the workload. In between events which modify CA , the hybrid mode acts in a manner similar to the analytic mode described previously, calculating TUDE as shown in Figure 5. Instead of using the parameters for the workload, however, it takes a less general approach and estimates the same parameters from CA . It then uses these new estimates to perform a rate adjustment calculation for TUDE , representing each of the parameters used to calculate TUDE as a weighted average
TUDE
=
1/(λIO pread (E[writes/read] + E[reads/read]) +λIO (1 − pread )(E[writes/read-modify-write] + E[reads/read-modify-write])) Figure 5. Calculation of time to next UDE.
with the expected value of these parameters for the workload in general. The weights used are simply the fraction of active chunks in CA as compared to the total number |CA |+implicit. When CA,i = ∅ or CA,i ∩ CA,0 = ∅, we return to the purely numerical scheme as we are no longer dependent on the last UDE scenario. nextEvent ← eventList.head() clock ← clock + nextEvent.interarrivalTime if nextEvent is an addition to CA then implicit ← implicit + 1 end if if nextEvent is a chunk leaving CA then if implicit > 0 and nextEvent ∈ / CA then implicit ← implicit - 1 else CA ← CA \ nextEvent end if end if if CA = ∅ then Switch to Analytic mode end if Adjust the rate for UDEs based on CA and Implicit Schedule next change in CA Figure 7. Pseudo-code representation of a single pass through the main loop of the hybrid discrete event simulator.
3.4 Validation Results of the simulator were validated using a simple numerical model of a UDE process. The numerical model functions the same as our simulator during the initial stage, but once it has decided a UDE has occurred, instead of switching to discrete simulation, it utilizes the DTMC described in Figure 1, using a Geometric distribution with parameter equal to the transition probability to the opposite state to find the number of reads before a subsequent write event. After the UDE has been resolved, it simply calculates the next UDE, and continues as before. Comparing results for the proportion of UDEs manifesting as undetected data corruptions, and rates of user-level undetected data corruption errors from this numerical model with results from the simulator (with parity scrubbing and other such features switched off) helped us to gain confidence in our simulator and ensure it was generating results which agreed with our numerical model. Estimation of
rates at which UDEs manifested as user level undetected data corruption events by the simulator were within 4.6% of those given by our numerical model, for 10 million simulated UDEs with no scrubbing, and no mitigation.
4. Results For this study we simulated three different example systems to ascertain the effect of UDEs in three settings, a largescale storage system, a large enterprise storage system, and a small business storage system. The large-scalesystem was modeled as a set 1000 disks each with a capacity of 1 terabyte, the enterprise system was modeled as a set of 512 disks, each with a capacity of 300 gigabytes, and the small business system was modeled as a set of 32 disks, also with capacities of 300 gigabytes each. Each of the three modeled systems were simulated with three different workloads, as discussed in Section 3.1. The rate of I/O operations per second for each systemworkload pairing was calculated by multiplying the io/s parameter for the workload by the number of disks (excluding those used for parity) in the system. All systems, including those without mitigation, simulated a weekly parity scrub. A weekly scrub [8] was chosen based on the existing literature, which discusses a wide range of scrub intervals from every few days [5] to at least every two weeks [11, 1]. A scrub interval of one week was chosen as a representative rate, but is not integral to our simulator, and can be easily altered. Each of these systems was simulated with and without mitigation techniques. UDE rates of three different orders of magnitude (10−11 , 10−12 , 10−13 ) were considered. A total of 10 million UDEs were simulated for each scenario. Tables 4(a) and 4(b) summarize the proportion of UDEs which actually manifest as an undetected data corruption event for the simulated scenarios. As can be seen in Table 4(a) the proportion of UDEs which manifest as an actual error does not vary significantly when varying system parameters. The various rates of UDEs/IO simulated are not listed as the results were the same for all three parameters. Adding the mitigation technique described in Section 2.3 had the effect of reducing the proportion of UDEs which manifested as undetected data corruption by two orders of magnitude. Table 4(b) shows the effect that varying the workload can have on the proportion of UDEs that manifest as an error. While both the Abstract workload and Write Heavy workload have similar rates of manifestation, the Read Heavy workload has a much lower proportion of UDEs which manifest as undetected data corruptions. In all cases, adding mitigation had the effect of reducing the proportion of UDEs manifesting as errors by two orders of magni-
Table 4. Estimated mean proportion of UDEs which manifest as undetected data corruption for various workloads and various system models, with and without mitigation.
(a) Various systems with Abstract workload Mitigation No Yes
Large 0.718 0.0028
System Enterprise Small Business 0.718 0.718 0.0028 0.0028
(b) Various workloads on large system model Mitigation No Yes
Abstract 0.718 0.0028
Workload Read Heavy Write Heavy 0.275 0.887 0.0011 0.0035
Table 5. Estimated mean and standard deviation of rate of UDE manifestation as undetected data corruption per second for various systems under the Abstract workload, with and without mitigation, for various rates of UDEs/io.
Table 6. Estimated mean and standard deviation of rate of UDE manifestation as undetected data corruption per second for the large scale system under the all workloads, with and without mitigation, for various rates of UDEs/io.
tude. Tables 5 and 6 illustrate the relationship between the rate of undetected data corruption errors and varying system and workload parameters, and rates of UDEs/IO. Table 5 shows that the rate of UDEs manifesting as undetected data corruption declines both as the rate of UDEs/IO decreases, and as the size of the system decreases. Those scenarios which involved mitigation decreased the rate of undetected data corruption events by between two and three orders of magnitude. To put these rates into perspective, Table 7 shows the mean interval between undetected data corruption events that correspond to these rates. Table 6 summarizes the effect of varying the workload while holding the simulated system constant. We show the results for the large system only, as the results for enterprise and small business systems showed similar trends
in the rates of UDE manifestation. The rates of manifestation vary in a manner consistent with Table 4(b) illustrating that workload does have an effect on the rate of UDE manifestation, but for the workloads and systems tested, varying the workload still yields a rate of undetected data corruption events within the same order of magnitude.
5. Conclusions Our results indicate that UDEs will continue to grow in their importance to system designers as storage systems continue to scale, a conclusion which seems affirmed out by field observation of UDEs in modern large scale storage systems. Even in the case of the small business system simulated, the rate of data corruption events without implementing mitigation is such that one would expect to see UDEs occuring in a pop-
Table 7. Estimated mean interval between undetected data corruption events for all systems under the Abstract workload, with and without mitigation, derived from Table 5.
System Large Large Ent. Ent. Small Small
Mitigation No Yes No Yes No Yes
10−11 18.43 days 13.13 years 35.98 days 25.19 years 1.576 years 399.9 years
Mean Interval 10−12 10−13 184.2 days 5.04 years 128.6 years 1258 years 0.9854 years 9.844 years 251.3 years 2531 years 15.76 years 157.6 years 4030 years 40358 years
ulation of such storage systems, and if we assume a UDE/IO rate of 10−11 , the rate is high enough to push the mean interval between undetected data corruption below the average lifetime of even a single such system. Our results suggest that data scrubbing on a weekly schedule is not enough to reduce UDEs sufficiently, as the data scrub must be processing the location on a disk where the UDE has occurred after the time at which the disk suffered the fault, and prior to the next read request for that location. It is particularly telling that when the rate is set at 10−12 UDEs/IO, the rate of UDEs/IO estimated for near-line disks, both enterprise and large scale systems have rates of undetected data corruption which place the mean interval between such events at less than a year. Given the growing practice of utilizing cheaper near-line drives in a RAID configuration, this highlights an important limitation of RAID. Since RAID5 and RAID6 can only detect errors on the data drives during a parity scrub, the protection they implement is largely orthogonal to the issues posed by UDEs. Fortunately, our simulations suggest that by using relatively simple techniques such as the sequence number approach to mitigation modeled in this work and described in [7], UDEs can largely be eliminated for the expected lifetime of near-future systems. While they double the requirement for read operations, requiring reading both the data and the parity, these methods reduce the rate of undetected data corruption events by two to three orders of magnitude.
6. Future Work While this paper considers only a single mitigation technique, and a set of relatively simple RAID based systems, there is no reason why one could not model other mitigation techniques with our methods, or model more complicated systems. In fact, our simulator was designed in a general fashion to allow one to easily build additional models of both disks and mitigation techniques. It would be useful to conduct similar studies under a broader variety of mitigation techniques, and a wider array of more complex systems with different architectures than just standard RAID configurations. Bairavasundaram et al. indicate in [2] that UDEs may be correlated in both time and space, it would be interesting to
construct a good model of this locality and apply our techniques to scenarios which take the locality into account to see how it affects MTTDC. Alterations to the simulator in this fashion would simply be a matter of altering the probabilistic distributions which govern UDE placement in the storage systems, and the rate of UDEs occuring in the I/O stream. Additionally, while the simulator design we used was tailored to the problem of UDE analysis, many of the assumptions made likely hold for other fault tolerance analysis. Work needs to be done towards generalizing the provided techniques, and adapting them for use in other domains.
References [1] L. N. Bairavasundaram, G. R. Goodson, S. Pasupathy, and J. Schindler. An analysis of latent sector errors in disk drives. SIGMETRICS Perform. Eval. Rev., 35(1):289–300, 2007. [2] L. N. Bairavasundaram, G. R. Goodson, B. Schroeder, A. C. Arpaci-Dusseau, and R. H. Arpaci-Dussea. An analysis of data corruption in the storage stack. In FAST’08: Proceedings of the 6th USENIX Conference on File and Storage Technologies, pages 1–16, Berkeley, CA, USA, 2008. USENIX Association. [3] J. Banks, J. Carson, B. L. Nelson, and D. Nicol. Discrete-Event System Simulation. Prentice-Hall International Series in Industrial and Systems, 2004. [4] B. E. Clark, F. D. Lawlor, W. E. Schmidt-Stumpf, T. J. Stewart, and G. D. T. Jr. Parity spreading to enhance storage access. US Patent No. 4761785, 1988. [5] M. H. Darden. Data integrity: The dell emc distinction, may 2002. http://www.dell.com/content/topics/ global.aspx/power/en/ps2q02darden?c=us&cs=555&l=en&s=biz. [6] E. M. Evans. Working draft project, american national standard t10/1799-d, ”information technology – scsi block commands-3 (sbc-3)”, may, 13, 2008. http://www.t10.org/ftp/t10/drafts/sbc3/sbc3r15.pdf. [7] J. L. Hafner, V. Deenadhayalan, W. Belluomini, and K. Rao. Undeteced disk errors in raid arrays. IBM Journal of Research and Development, 52(4):413–425, 2008. [8] I. Iliadis, R. Haas, X.-Y. Hu, and E. Eleftheriou. Disk scrubbing versus intra-disk redundancy for high-reliability raid storage systems. In Proceedings of the 2008 ACM SIGMETRICS international conference on Measurement and modeling of computer systems, pages 241–252, Annapolis, MD, USA, 2008. ACM. [9] J. Keilson. Markov Chain Models–Rarity and Exponentiality. Springer-Verlag, 1979. [10] P. Kelemen. Silent corruptions, june 1, 2007. http://fuji.web.cern.ch/fuji/talk/2007/kelemen-2007-C5SilentCoruptions.pdf. [11] A. Krioukov, L. N. Bairavasundaram, G. R. Goodson, K. Srinivasan, R. Thelen, A. C. Arpaci-Dusseau, and R. H. ArpaciDussea. Parity lost and parity regained. In FAST’08: Proceedings of the 6th USENIX Conference on File and Storage Technologies, pages 1–15, Berkeley, CA, USA, 2008. USENIX Association. [12] A. M. Law and W. D. Kelton. Simulation Modeling and Analysis. Wiley, New York, 2000. [13] D. A. Patterson, G. A. Gibson, and R. H. Katz. A case for redundant arrays of inexpensive disks (raid). Technical Report UCB/CSD-87-391, EECS Department, University of California, Berkeley, Dec 1987.
[14] V. Prabhakaran, L. N. Bairavasundaram, N. Agrawal, H. S. Gunawi, A. C. Arpaci-Dusseau, and R. H. Arpaci-Dusseau. Iron file systems. ACM SIGOPS Operating Systems Review, 39(5):206–220, 2005. [15] B. Schroeder and G. A. Gibson. Disk failures in the real world: what does an mttf of 1,000,000 hours mean to you? In FAST ’07: Proceedings of the 5th USENIX conference on File and Storage Technologies, page 1, Berkeley, CA, USA, 2007. USENIX Association.