amount of the power budget is spent when the data- intensive server ... long time to recover a maximum RPM speed, which will cause a ... we propose a new threshold model that can efficiently ... The energy consumption of a hard disk drive is.
Power Management in RAID Server Disk System Using Multiple Idle States Hogil Kim, Eun Jung Kim and Rabi N. Mahapatra Department of Computer Science, Texas A&M University {hogil, ejkim, rabi}@cs.tamu.edu Abstract Energy efficient design for disk devices has become a very important issue, because ever increasing need for data storage systems significantly increases the power budget in the disk array. Most research on power management in disk devices focuses on the traditional way of stopping disk rotation. In this paper, we propose a new approach in which the energy consumption can be reduced without stopping the disk rotation. The proposed Multiple Idle States (MIS) model modulates the disk RPM to optimize the energy consumption during idle periods. We present a new threshold time model to calculate a minimum idle period so as to save energy without significant performance degradation. The simulation results with real traces show that our MIS achieves more than 58% energy savings at low I/O workload and also gets 8% energy savings for high workload with less than 50% response time compared to the traditional shut-down power management scheme.
1. Introduction Energy is a significant issue to most computer system. Although the need for low-power designs has been critical to small form-factor embedded systems, today’s large systems are no exception to low power requirements. The power management in server systems has become significant because a great amount of the power budget is spent when the dataintensive server systems begin to form large clusters. In these server systems, large amounts of energy are consumed by the disk subsystem [1, 2]. For example, the disk consumes 13.5 times more energy than the CPU in many large server systems [3]. Also, we observe that the energy consumed during idle periods takes a significant portion of the total energy consumption. Figure 1 shows the fraction of
the energy consumption for each operation mode of the disk1. mean arrival (10 m s)
mean arrival time (100ms) Position 5%
Position 15%
Active 1%
Active 3%
Idle 82%
Idle 94%
Figure 1. Proportion of energy consumption The disk idling consumes 82% and 94% of the total energy for mean arrival time of 10 ms and 100 ms respectively. Before this work, there are many researches that have proposed several energy management schemes exploiting the disk idleness [5, 6, 7, 8, 9, 10]. Most of these power management schemes are based on timeout, stochastic, and predictive algorithms. The timeout algorithms shut down the disk if the idle time lasts longer than the timeout threshold. The stochastic algorithms model the I/O requests in the stochastic process and estimate power management with a discrete-time Markov decision process. The predictive algorithms predict the length of the next idle period by using a previous actual idle period and a previous predicted idle period. However, those researches have been limited to desktop, notebook computer and mobile devices. They try to shut down the disk for the idle period and spin up to the maximum RPM level when a new I/O request arrives. We cannot apply this scheme directly to server disk systems, since the shut-down and spinup time of the server disk is much longer than that of the desktop computer. In other words, it is difficult to find an idle period long enough to shut down the disk We get this result by Disksim simulator[12] with synthetic workload.
in the server system. Moreover, if a new request arrives during the shut-down period, it will take a long time to recover a maximum RPM speed, which will cause a huge response time. To come up with the energy wastes for threshold time and delay caused by recovering maximum RPM speed, we suggest a new method that spins down the RPM speed without waiting for threshold time and is able to service a request at different RPM speed. To realize this idea, we propose a new threshold model that can efficiently use multiple idle states (MIS) for general disk systems and the server disk systems that usually have short idle times. We apply an aggressive approach to implement our threshold model. Our MIS model is composed of the idle period prediction stage and the dynamic RPM modulation stage to spin down/up the disk to an appropriate RPM level. This approach can largely reduce energy consumption in the server disk system besides desktop computers. According to our simulation, we achieve more than 50% energy savings for low I/O workload and at least 8% energy savings at high I/O workload. The rest of this paper is organized as follows: Section 2 gives the basic of the MIS model, including algorithms for idle prediction, and threshold calculation. Section 3 presents the result of the simulation, and section 4 gives the conclusion.
2. MIS (Multiple Idle States) Power Management Model In this section, we describe the MIS power management model which facilitates multiple idle states. We introduce the power model for calculating the energy consumption of different RPM levels. The prediction algorithm for the next idle length and our new threshold model are presented.
2.1. Power model for multiple idle states The energy consumption of a hard disk drive is composed of two major parts, the spindle motor and the electrical control circuit. + 12V is used for the spindle motor and the actuator, and + 5V is used for the controller’s electrical components [11]. The operation modes of the disk are Start-up, Active, Seek, Idle, Standby, and Sleep. The peak power consumption occurs in Start-up mode, when the disk is powered on. To evaluate the power consumption during running time, we need to trace the power consumption at the Active, Seek, and Idle modes. In addition, the power consumed during the RPM transition is also verified. We will use the term “low-
Idle state” to indicate the RPM levels below the maximum RPM. Each mode has different power dissipation, since different current values are consumed. To calculate runtime energy consumption, we use the quadratic power model proposed in [4] described below. These models can calculate the energy consumption while the dynamic RPM scheme is applied. Pidle = 1.318 × 10
−7
rpm
2
− 4.439 × 10
−4
rpm + 8.643
−8 −4 2 P12V = 8.607 × 10 rpm − 2.898 × 10 rpm + 2.93 2 −8 −4 P5V = 4.575 × 10 rpm − 1.5405 × 10 rpm + 1.5576 ∆t = 4.48 × 10
−3
∆n ( ms ) ,
(1) (2) (3) (4)
where n represents the amplitude of the RPM changes. Whenever the RPM is changed, these equations are used to calculate the power cost at the current RPM level and the time spent changing RPM level. Equation (1) is used to calculate the power consumption for the idle state and low-idle state. Equations (2) and (3) are used to calculate the power cost for the active state, during which read or write operations run. The energy is calculated whenever the operating state is changed by multiplying the required power at each state by the time spent for the operation. We use Equation (4) to calculate the time spent changing the RPM. In this case, we assume that the power required for changing the RPM is related to the RPM to be changed.
2.2. Idle Period Prediction Model If we can reduce the idle energy as shown in Figure 1, the total energy required for the disk system will decrease. We can save this wasted energy by slowing down from the maximum RPM to a lower one. The objective of this paper is to modulate the RPM dynamically according to the length of the idle period. This is unlike with DRPM [4] in the point of using the length of an idle period not average response time of requests to modulate RPM speed. The magnitude of change of RPM definitely relies on the interval of the idle period. We consider the time spent for RPM change and the energy gain to decide the magnitude of change of RPM. The next incoming idle period can be obtained by the idle prediction algorithm. The main objective of the predictive scheme is to find the next incoming idle period based on the pattern of the I/O requests. If the idle period is long enough to save the energy by shutting down the disk,
the disk is shut down for the idle period and RPM will be returned to the maximum RPM level at the end of the idle period or at the next I/O request arrival. We use the algorithm proposed in [8]. This method uses an event-driven computation based on the history of the previous idle periods. It is independent of a target application so the prediction algorithm is eligible for the MIS model. The exponential-average approach for predicting the next idle period uses the last predicted value and the latest idle period as follows.
I n +1 = a ⋅ in + (1 − a ) ⋅ I n ,
(5)
where I n +1 is a new predicted idle time, I n is the predicted idle time for the current period, in is a current idle time, and a is an attenuation factor in the range of 0 to 1. By using this value, the algorithm controls the relative weight of current and past history of prediction. We use this formula to predict the next idle period. The prediction can be made in parallel while the disk system read or write an I/O request and it can reduce the overhead for calculating the next idle time.
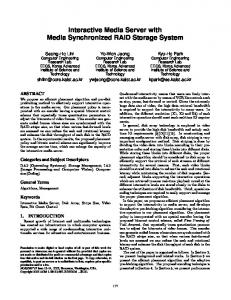
2.3. Implementation of MIS The MIS model decides a proper RPM level for next idle period according to the predicted idle-time value. Figure 2 shows the flow diagram of the MIS model implemented for this purpose. The main idea of the MIS model is that it uses multiple RPMs for different idle periods and services an I/O request at reduced RPM level to avoid spin-up time. Prediction
T > tth
RPM Decision
IDLE RPM_max
IDLE RPM_1
•••
IDLE RPM_n
ACTIVE
Figure 2. Flow diagram of MIS model
Whenever an I/O request arrives, the prediction module calculates the next idle period. After finishing an I/O request, the MIS model decides whether it can change a current RPM level to another level or not.
We use a predefined threshold to decide the RPM change. If the predicted idle period is greater than the predefined threshold, the MIS calculates a proper RPM level from multiple RPM levels and the RPM is changed according to the calculated RPM. If the predicted idle period is smaller than the threshold, the RPM should remain at maximum level. If a new I/O request arrives during the low-Idle state, the MIS model services the request at the current RPM level without wasting spin-up time. The MIS model can reduce energy wastes in spin-up time with this new mechanism. The RPM is restored to the maximum level after the predicted idle period ends. If no I/O request arrives after the predicted idle period ends, the MIS model periodically checks the disk queue and spins down the RPM step by step until a new I/O request arrives. The RPM can be spun down to the minimum RPM. The threshold is represented by equation (6). tth = 2tr + ts = 2(4.48 × 10⁻³ ∆n) + t s
(6) ≅ 0.01∆n + ts In equation (6), t r represents the spin-up or spindown time that will be spent for changing the RPM, which is equal to t in equation (4) and t s is an intermediate period between spin-down and spin-up operation. During this period, the disk RPM will be stable at a reduced RPM level. ∆n is an altitude between a previous RPM and a current RPM that is changed. We define the threshold as the time interval required for the following; spin-down, staying at the reduced RPM level, and spin-up to the maximum RPM level. We assume that the spin-down time is equal to the spin-up time. For the threshold of the MIS model, we may need several threshold values for each multiple RPM levels to meet break-even time. The break-even time means the minimum amount of time to be able to get energy gain by reducing RPM. However, we propose a new MIS threshold model that is designed for multiple idle states or multiple RPMs using only one threshold value. The MIS threshold model first compares the threshold value with a predicted next idle period and calculates a lower RPM level according to the predicted next idle period if it is greater than the MIS threshold. This method has the following advantages. First, for the system reliability, our threshold model can avoid unnecessary RPM changes by filtering out small idle periods that are shorter than the threshold time. Second, it avoids unnecessary use of resources to hold multiple threshold values. In the next section,
we explain the process of determining the minimum threshold for the MIS model.
2.4. Threshold Calculation (tth) The idea of our threshold model is to obtain one threshold for all of the multiple idle states. For this purpose, we first decide the minimum energy gain that is supposed to be obtained during idle periods. After the threshold is obtained for the minimum energy gain, the MIS model calculates a proper RPM level whenever the predicted idle period is larger than the threshold. The energy gain α is represented by equation (7).
PI M × tth ≥ α ( PIS (t s + tr ) + PIM × tr ),
(7)
where PI M is an idle power requirement at the maximum RPM level, PI S is an idle power requirement for the low RPM level, which is reduced to save energy consumption. We assume that the required power for RPM transition is same as that of the idle power of the RPM level to be transitioned. According to this equation, the energy consumed by the reduced RPM should be smaller than that of maximum RPM.
PIS ≤ =
(2 − α )tr + ts (2 − α )tr + β tr PIM = P α (ts + tr ) α ( β tr + tr ) IM
(2 − α + β ) P α ( β + 1) IM
α≤
(2 + β ) PIM (1 + β ) PIS + PIM
(8)
(9)
We derive equation (9) from equation (7) and (8) by substituting ts = β tr and tth = 2tr + ts , where the β is used to represent the ratio of ts to tr. This value affects the depth of the intermediate RPM level to be selected to obtain same energy gain. For example, the RPM level required for a certain energy gain will be decreased when this ratio is 1 rather than 3. As this ratio increases, the total queuing delay wasted for the RPM transition will be decreased because the time required for the transition will decrease. This property supports a low delay with a competitive energy savings. The energy gain is calculated by three parameters: PI S , PI M and β . These parameters may be varied according to different system specifications and chosen by the system designer. If we examine our
simulated system, the maximum idle power is 22.3W (= PI M ) at maximum 12,000rpm and the minimum idle power is 8.75W at 3,600rpm. Those power values are calculated using equation (4). Hence, expected energy gain lies between 1 and 1.9 if β = 3. To get a threshold for MIS, we need to decide prospective energy gain from 1 to 1.9. If we decide 1.5 as a minimum energy gain, we can get 13W as a new PI S from equation (9). The appropriate RPM for this PI S is 7,200 out of 15 different RPM levels. The value of 7,200 rpm is obtained by equation (1). From equation (6), the threshold will be 112.5 (ms) by applying ∆n = 12,000-7,200 = 4,800 and ts = β *tr = 3*21.5 = 64.5 (ms). The value of tr is calculated by equation (4). This is just an example to determine a threshold for the MIS model. System designers can apply this procedure to obtain a proper threshold for their own systems varying the three parameters PI S , PI M and β . This flexibility can be used efficiently by system designers in certain environments to optimize the system performance and reliability. To be briefly, we first decide an energy gain value using the minimum idle power and maximum idle power that can be obtained from the disk with multiple RPMs. After we calculate the threshold, we decide a proper RPM level by RPM-lookup algorithm. This algorithm can be easily implemented. It compares a predicted idle time with calculated time for each RPM transition. The RPM transition time includes spin-down, spin-up and idle time at each RPM level. The lowest RPM level which transition time fits into the predicted idle time can be selected.
3. Experiment and Result 3.1. Simulation Environment We have used the synthetic and real workloads to evaluate the benefit of MIS technique. The synthetic workload is generated by the DiskSim [12] simulator with different exponential mean arrival times. We used the OLTP workload from [13] for the real traces. This OLTP trace has been collected by running the TPC-C benchmark on a Microsoft SQL database system. In order to evaluate the energy consumption, we add the function of the energy calculation module to the DiskSim. We have simulated five different schemes: NPM, PRED, MIS, DRPM and MIS+DRPM. NPM is a case when no power management scheme is applied. PRED is the scheme that uses idle prediction and
For the PRED, the threshold is 200 ms and the minimum RPM is 3,600. We apply this configuration to PRED because the original PRED may not acquire any chance to shut down the disk for lack of a sufficient idle period in a real server environment. The disk configuration we used for our simulation is shown in Table 1.
60
energy savings(%)
Table 1. Configuration of disk used for MIS Parameter Value RAID Level 5 Number of Disks 10 Maximum RPM 12000 RPM Minimum RPM 3600 RPM RPM step 600 RPM
Energy Savings 70
50
PRED
40
MIS_20
30
MIS_60
20
MIS_120
10 0 -10
10
100
1000
5000
mean arrival time(ms)
(a) Resopnse Time 40 35
PRED
30
time (ms)
shuts down the disk after predefined threshold time. MIS is our suggested model. DRPM is the model proposed in [4]. MIS+DRPM is the combined model that incorporates MIS into DRPM.
25
MIS_20
20
MIS_60
15
MIS_120
10
NPM
5 0 10
100
1000
5000
mean arrival time (ms)
First, we compare our MIS to the PRED with the synthetic workload. Figure 3(a) shows the energy savings for the PRED and the MIS scheme with synthetic workload. Different thresholds for MIS are used. For example, MIS_20 indicates that threshold is 20 ms. PRED obtains up to 8% energy savings compared to the NPM scheme while MIS achieves up to 59 % energy savings. Specifically, MIS can save 20% of energy consumption for the high-workload configuration. If we consider low workloads, there are many longer idle periods, and thus the MIS can save energy by reducing RPM. Both schemes have difficulty finding a sufficient idle period for the high workload, but the MIS gets about 23% energy savings, while the PRED cannot. The threshold also affects the amount of energy savings. When the workload has 10 and 100 ms mean arrival time, the threshold of 20 and 60 ms does not show a static result; but a threshold of 120 ms shows similar energy savings for both workloads, which is derived from our model with β = 3. For the low workload with the mean arrival time of 1 and 5 seconds, similar energy savings are obtained, regardless of the threshold, showing that a threshold less than a certain value may not give the expected result according to the characteristics of a different workload.
(b) Figure 3. Energy and response time of MIS and PRED with Synthetic Workload According to those simulation results, we can show that our threshold model gives the optimal value (120 ms) to maximize energy savings over all workloads. The graph of response time in Figure 3(b) shows the average response time that includes the service-waiting time and the average response time for each I/O request. PRED causes a large delay overhead, while MIS services the requests without significant delay overhead across all kinds of the workloads. From this result, one can see that the MIS model can save a large amount of the energy consumed in the RAID system without a significant delay. Ene rgy Savings 70
percent of savings(%)
3.2. Simulation Result
60 50 40
PRED
30
MIS
20 10 0 - 10
raid1
raid2
(a)
raid3
NPM
2
PRED
1.5
MIS
1 0.5 0
raid1
raid2
raid3
(b) Figure 4. Energy and response time of MIS and PRED with Real Traces In the case of the real OLTP workload, the percentage of the energy savings for the MIS model is also greater than that of the PRED model as shown in Figure 4(a). The simulated system for this real workload is composed of RAID1, RAID2 and RAID3. The average inter-arrival time for each RAID system is 52 ms, 266 ms and 10 seconds respectively. We used the same disk configuration shown in Table 1. Our results show the PRED scheme consumes more energy than NPM for high workload. This is because it needs extra energy and time to spin up. In contrast with PRED, MIS achieves more than 2 time energy savings with less than 50% delay compared to the PRED as shown in Figure 4(b). Note that the response time results in Figure 4(b) are normalized to NPM for better readability. By comparing the results of PRED and MIS, we can conclude that multiple idle states are more useful to reduce the energy consumption than the simple shut-down scheme used in PRED. For the server disk, it is impossible to get a chance to shut down the disk. The MIS scheme improves energy savings by the incorporation of multiple idle states. For the last part, we show the effectiveness of the combined model, MIS+DRPM, compared to the original DRPM model. In Figure 5, we compare the MIS+DRPM model with the DRPM model. MIS+DRPM works in a cooperative way in which MIS reduces RPM by the rule of the original MIS while the DRPM decides a current RPM by its policy. In other words, the RPM of the active state is decided by the DRPM according to the average response time and the RPM for the idle state is set by the MIS model. When we use our scheme with the DRPM (MIS+DRPM), we can see that the performance of energy savings and response time can be improved as shown in Figure 5. The MIS+DRPM model shows a comparable energy savings and response time to DRPM for high workload. The response time of
Energy Savings 30 25
energy savings(%)
3 2.5
MIS+DRPM is as same as DRPM scheme with a little bit small energy savings. The strong point of MIS+DRPM is shown for the low workload. It can achieve more energy savings than DRPM for low workload with similar response time to the high workload. With this result, we can see that our scheme can improve the energy efficiency of the DRPM for the low workload for which the original DRPM model is not efficient to get energy savings. We can observe that our scheme can enhance the performance of other power management schemes. To be briefly, our scheme saves more energy than traditional power management schemes for the high workload and it can bring energy savings for low workload compared to dynamic RPM modulation scheme like DRPM. Our scheme shows a static response time over all kinds of workload having remarkable energy savings.
PRED
20 15
DRPM
10
MIS+DRPM 120
5 0 -5
10
100
1000
5000
mean arrival time (ms)
(a) Response Time 40 35 30
time (ms)
Res ponse Tim e
NPM
25
PRED
20 15
DRPM
10
MIS+DRPM
5 0 10
100
1000
5000
mean arrival time (ms)
(b) Figure 5. Energy and Response time of MIS+DRPM model
4. Conclusion In this paper, we suggest a new threshold model that is efficient enough to obtain energy savings compared to the existing threshold model. We applied this model to the predictive power management algorithm for the disk system and
simulated the efficiency of our scheme. Our model can achieve great energy savings using multiple idle states with our new threshold model. It predicts the next idle period and reduces RPM to the appropriate level whenever the predicted idle period is greater than the threshold instead of remaining at maximum RPM level for threshold time like other existing schemes. We have calculated the threshold from the expected energy gain for the multiple idle states. The simulation has shown that the MIS gets 20-50% energy savings across the range of workloads with at most 1.5 times degradation in total average response time. For the future work, we plan to verify reliability issues of the disk system under the proposed model. We also would like to investigate cache schemes in order to maximize the idle period of disk so that power consumptions can be reduced. The cache schemes will be integrated with our MIS model.
References [1] J. Chase and R. Doyle, “Balance of Power: Energy Management for Server Clusters”, Proc. of the 8th Workshop on Hot Topics in Operating Systems (HotOS), May 2001 [2] D. Patterson, G. Gibson, and R. Katz, “A Case for Redundant Arrays of Inexpensive Disks (RAID)”, Proc. of 1988 ACM SIGMOD Conf. on Management of Data, Chicago, IL, June 1988. [3] TPC-C Executive Summary – Dell PowerEdge 6650/4/1.6GHz.http://www.tpc.org/tpcc/results/tpcc_result _d-etail.asp?id=102053101 [4] S. Gurumurthi, A. Sivasubramaniam, M. Kandemir and H. Franke, “DRPM: Dynamic Speed Control for Power Management in Server Class Disks”, Proc. of the 30th annual international symposium on Computer architecture, San Diego, California, 2003, pp. 169 - 181 [5] Y. Lu, E. Chung, T. Simunic, L. Benini and G. De Micheli, “Quantitative Comparison of Power Management Algorithms”, Proc. of Design Automation and Test in Europe Conference(DATE), 2000, pp. 20-26. [6] Fred Douglis, P. Krishnan and Brian Bershad, “Adaptive Disk Spin-down Policies for Mobile Computers”, Proc. 2nd USENIX Symp. on Mobile and Location-Independent Computing, 1995, pp. 121-137 [7] T. Simunic, L. Benini, Peter Glynn and Giovanni De Micheli, “Event-Driven Power Management”, IEEE Trans. on Computer-Aided Design, Vol. 20, July 2001, pp. 840 – 857. [8] Chi-Hong Hwang, Allen C.-H. Wu, “A Predictive System Shutdown Method for Energy Saving of EventDriven Computation”, IEEE/ACM International Conference on Computer-Aided Design, 9-13 Nov. 1997, pp. 28 – 32 [9] Eui-Young Chung, Luca Benini and Giovanni De Micheli, “Dynamic Power Management Using Adaptive
Learning Tree”, Proc. of the 1999 IEEE/ACM international conference on Computer-aided design, 1999, pp. 274 279 [10] Yung-Hsiang Lu and Giovanni De Micheli, “Adaptive Hard Disk Power Management on Personal Computers”, Ninth Great Lakes Symposium on VLSI, 1999, pp. 50-53 [11] The PC Guide, Charles M. Kozierok, Available: http://www.pcguide.com/ref/hdd/perf/perf/spec/otherPower -c.html [12] G.Ganger, B. Worthington, and Y.Patt. “The DiskSim Simulation Environment Version 2.0 Reference Manual”, http://www.ece.cmu.edu/ganger/disksim [13] Qingbo Zhu, Francis M. David, Christo F. Devaraj, Zhenmin Li, Yuanyuan Zhou and Pei Cao, “Reducing Energy Consumption of Disk Storage Using Power-Aware Cache Management”, 10th International Symposium on High Performance Computer Architecture (HPCA'04), 2004