Jun 2, 2017 - School of Engineering, RMIT University, Melbourne, Victoria .... Sunshine hrs. Ã. Ã ..... COMPARISON OF TMI CONTOUR MAPS OF VICTORIA.
EVALUATION AND COMPARISON OF METHODS FOR CALCULATING THORNTHWAITE MOISTURE INDEX Xi Sun, Jie Li and Annan Zhou School of Engineering, RMIT University, Melbourne, Victoria
ABSTRACT The use of Thornthwaite Moisture Index (TMI) as a means of classifying climatic zones and estimating the depth of design soil suction changes is now widely accepted in Australia. Over the last two decades, TMI-based contour maps for various parts of Australia have been published by a number of authors. However, reconciling these TMI maps is often difficult because different assumptions and equations were adopted in the study. There is no doubt that there are discrepancies between the various maps and their associated sets of TMI values due to the adoption of different TMI equations and methods for calculating potential evapotranspiration (PET) as well as differences in the quality, quantity and time span of data used in the computations. In this study, TMI values calculated using various assumptions and methods are compared and evaluated. It is hoped the results and discussion presented in this paper can promote a higher level of understanding of the use of TMI equations and methods and provide useful guidance for future TMI users.
1
INTRODUCTION
Research into expansive soil behaviour has been carried out in Australia since the late 1950’s. The outcome of much of the Australian research was an Australian standard. The Australian Residential Slabs and Footings Standard AS2870 was first published in 1986, then revised and published in two parts in 1988 and 1990, followed by two more complete editions in 1996 and 2011. Common to the all four versions of the Standard, sites are classified according to soil profile and regional climate influence on soil moisture state (Li et al. 2014). The site classification for reactivity is based on ys, the predicted design site surface movement, over the life of the house, which is based on design soil suction change profiles for different climatic regions of Australia (Li and Cameron, 2002). The value of ys is determined by the following expression (AS2870, 2011):
= ys
1 Hs I pt udh 100 ∫0
(1)
where, Ipt is the instability index of the soil, which is defined as the percent vertical strain per unit change in suction considering possible lateral restraint; ∆u is the change in suction, in pF units in the soil layer under consideration; dh is the thickness of the soil layer and Hs is the design depth of suction change. For sites where ground movement is predominately due to soil reactivity, and where abnormal moisture conditions are not anticipated, the standard provides for sites to be categorized into one of five classes in accordance with Table1. The suction changes (∆u) are simply assumed to linearly decrease with depth. Hs are given in the Australian Standard AS2870 (2011) for populated cities and regions. For other areas, the site classifier has to have recourse to a Thornthwaite Moisture Index (TMI) map and use Table 2 to obtain the depth of design suction change Hs. The use of the climate index, TMI, as a predictor of the depth of design soil suction changes is now widely accepted by geotechnical engineers and practitioners. Over the last 20 years or so, many researchers have published studies which include TMI maps for various parts of Australia. However, reconciling the published results is often difficult due to the different assumptions and equations adopted in the various studies, which results in different TMI values being ascribed to the same climate record. In this study, the different definitions of the TMI and methods for estimating the potential evapotranspiration are explored. The TMI values calculated by the use of the different assumptions and methods are then compared and evaluated.
AUSTRALIAN GEOMECHANICS | VOLUME 52: NO.2 JUNE 2017 AUSTRALIAN GEOMECHANICS | VOLUME 52: NO.2 JUNE 2017
61
COMPARISON AND EVALUATION OF METHODS FOR CALCULATING THORNTHWAITE MOISTURE INDEX SUN ET AL.
Table 1: Site classification by characteristic surface movement ys (AS2870, 2011). ys (mm)
Class
Description
0 < ys ≤ 20
S
Slightly reactive
20 < ys ≤ 40
M
Moderately reactive
40 < ys ≤ 60
H1
Highly reactive
60 < ys ≤ 75
H2
Very highly reactive
ys > 75
E
Extremely reactive
Table 2: Relationship between TMI, Hs and climatic zone. (AS2870, 2011)
2
Climatic Zone
Description
TMI
Hs (m)
1
Alpine / wet coastal
> +10
1.5
2
Wet temperate
-5 to +10
1.8
3
Temperate
-15 to -5
2.3
4
Dry temperate
-25 to -15
3.0
5
Semi-arid
-40 to -25
4.0
6
Arid
< -40
> 4.0
OVERVIEW OF POTENTIAL EVAPOTRANSPIRATION AND THORNTHWAITE MOISTURE INDEX
The Thornthwaite Moisture Index (TMI) was originally derived from precipitation minus evaporation (P-E) Index by Thornthwaite in 1948 for the purpose of climate classification. This climate parameter has been widely used in geotechnical engineering and other disciplines to evaluate the soil moisture changes in the unsaturated zone and predict the depth of seasonal moisture changes. TMI is mainly a function of rainfall and potential evapotranspiration (PET). The calculation of TMI is on a yearly basis and expressed in a number which is computed for a statistically significant number of years to allow a true climatic condition to be obtained for a particular region. A negative TMI indicates an arid climate with a deficit of precipitation relative to PET and generally low moisture in the soil. A positive TMI indicates a humid climate with a surplus of precipitation and generally high soil moisture. Zero TMI index means that, over the long term, under average conditions, the inflow from precipitation just equals the loss of soil moisture through evapotranspiration that would occur if the notional reference vegetative cover was actually present. 2.1 POTENTIAL EVAPOTRANSPIRATION (PET) Potential evapotranspiration (PET) is the soil evaporation and crop transpiration under sufficient water supply. It is the measurement of the ability of the atmosphere to transport water from the surface through the evaporation and transpiration processes. This term was first introduced by Thornthwaite in 1948 to define the evapotranspiration that would occur when there was an adequate supply of soil moisture at all times (Chow, 1964). Estimating PET is difficult since it presents the potential transfer of water vapour to the atmosphere that would occur assuming the existence of a particular notional extent of vegetative cover rather than the actual transfer that occurs at any particular site with its actual vegetative cover. PET is a physical process which cannot be directly measured and must be determined theoretically or experimentally. Unfortunately, the concept of PET may cause confusion since it does not clearly specify what kind of ground surface (e.g. clipped grass or forest) it refers to. To avoid ambiguities in the definition of PET, it was replaced by the term ‘reference evapotranspiration’ (ETref) in the late 1970s and early 80s (Irmak and Haman 2003).
AUSTRALIAN GEOMECHANICS | VOLUME 52: NO.2 JUNE 2017
62
AUSTRALIAN GEOMECHANICS | VOLUME 52: NO.2 JUNE 2017
COMPARISON AND EVALUATION OF METHODS FOR CALCULATING THORNTHWAITE MOISTURE INDEX SUN ET AL.
PET plays a critical role in TMI calculation since TMI indices can vary greatly if different PET estimation methods are employed. There are approximately 50 models available for estimation of evapotranspiration (Grismer et al. 2002). These models range from very simple equations which require only one or two meteorological parameters (e.g. Thornthwaite method and Hamon method) to more sophisticated and accurate models (e.g. Priestley-Taylor method and FAO-56 Pennan-Monteith method). There are mainly two types of approaches to compute PET (i.e. temperature based method and radiation based method). The seven most popular models/methods and the required meteorological parameters are given in Table 3. The ASCE Standardized Penman-Monteith (PM) method has been established as a standard for calculating reference evapotranspiration (ETref) while the Thornthwaite method is the most widely used method for TMI calculation by researchers and practitioners. In this study, the ASCE Standardized PM method and Thornthwaite method were used to calculate TMI index. The results are presented and compared in Section 3.1. Table 3: Climatic parameters required for PET calculation. Methods Parameters Time step Max. air temp. Min. air temp. Solar rad. Wind speed Max. relative humidity Min. relative humidity Sunshine hrs. Daytime length Latitude Elevation Note:
Temperature based methods Radiation based methods Hargreaves PriestleyThornthwaite Hamon ASCE ASCE PM FAO -56 PM -Samani Taylor (1948) (1963) (1990) (1998) Standardized (1985) (1972) PM (2000) M √ √ × ×
D √ √ × ×
D or M √ √ × ×
D or M √ √ √ ×
H or D √ √ √ √
H or D √ √ √ √
H or D √ √ √ √
×
×
×
×
√
√
√
×
×
×
×
√
√
√
× √ √2 ×
× √ √1 ×
× × √1 ×
√ × × √
√ × √1 √
√ × √1 √
√ × √1 √
M= Monthly, D= Daily, H= Hourly, to compute the sunset hour angle, 2. to compute the day length correction factor. 1.
Thornthwaite Method Thornthwaite introduced his potential evapotranspiration (PET) method (Equation 2) in 1948, which was developed based upon global climate pattern distribution and the concept of plant physiology relating to moisture availability (Jewell and Mitchell 2009). This method requires fewer parameters and the data for these are readily available for most of the weather observation stations in Australia. Temperature is the primary input parameter which is utilised on a monthly basis. A derived adjustment factor is employed to correct for site latitude (Table 4) and month length. Detailed methodology in deriving Thornthwaite PET was described in Chow (1964). Due to its simplicity, this method has been widely used by many researchers including Chan and Mostyn (2008, 2009); Fox (2000, 2002); Mitchell (2012, 2013); Jewell and Mitchell (2009); McKeen and Johnson (1990); Fityus et al. (1998) ; Er and Rifat (2014) ; Li and Sun (2015) and Karunarathne et al. (2016).
AUSTRALIAN GEOMECHANICS | VOLUME 52: NO.2 JUNE 2017
AUSTRALIAN GEOMECHANICS | VOLUME 52: NO.2 JUNE 2017
63
COMPARISON AND EVALUATION OF METHODS FOR CALCULATING THORNTHWAITE MOISTURE INDEX SUN ET AL.
Table 4: Mean possible duration of sunlight - Southern Hemisphere (day length correction factor in units) of 30 days of 12 hours (Thornthwaite, 1948). Latitude 20 25 30 35 40
Jan 1.14 1.17 1.20 1.23 1.27
Feb 1.00 1.01 1.03 1.04 1.06
Mar 1.05 1.05 1.06 1.06 1.07
Apr 0.97 0.96 0.95 0.94 0.93
May 0.96 0.94 0.92 0.89 0.86
Jun 0.91 0.88 0.85 0.82 0.78
Jul 0.95 0.93 0.90 0.87 0.84
Aug 0.99 0.98 0.96 0.94 0.92
Sep 1.00 1.00 1.00 1.00 1.00
Oct 1.08 1.10 1.12 1.13 1.15
Nov 1.09 1.11 1.14 1.17 1.20
Dec 1.15 1.18 1.21 1.25 1.29
Note: Victoria is positioned between latitude 30 and latitude 40.
The adjusted potential evapotranspiration (PETi) for the month, i, is calculated by the following equation:
PETi = ei (
Di N i ) 30
(2)
where Di is the day length correction factor for the month i; Ni is the number of days in the month i; and ei is the nonadjusted potential evapotranspiration (cm) for the month i given as:
10t ei = 1.6 i H y
a
(3)
where ti is the mean monthly temperature in °C and calculated as the average of tmax and tmin. The heat index for each month is determined as follows: hi = ( 0.2 ti )
1.514
(4)
The annual heat index, Hy is simply determined by summing the 12 monthly heat index values. The power term a in Equation 3, is given as: a= 6.75 × 10 −7 H y3 − 7.71 × 10 −5 H y2 + 0.017921H y + 0.49239
and
0 < a < 4.25
(5)
ASCE Standardized Penman-Monteith (PM) Equation
ASCE Standardized PM equation (Equation 6) was developed based upon the FAO-56 PM equation. It takes crop height, h = 0.12 m for short reference crop (e.g. grass) and h = 0.50 m for tall reference crop (e.g. alfalfa). The calculation of reference evapotranspiration requires several meteorological parameters, such as air temperature, vapour pressure, solar radiation, and wind speed. For simplification, 2.45MJ/kg is used for latent heat of vaporization and 0.23 is adopted for albedo of reference surfaces. It assumes the height of wind measurement (zw) and the height of humidity or air temperature measurement (zh) are measured in a range of 1.5 to 2.5 m above the ground. The ASCE Standardized Penman-Monteith method can be expressed as follows: ETref
Cn 0.408 ( Rn − G ) + γ T + 273 u2 ( es − ea ) = + γ (1 + Cd u2 )
(6)
Where, ETref (mm /day) is the reference crop evapotranspiration; Rn (MJ/m2/day) is the net radiation at the crop surface; G is the soil heat flux density at the soil surface; T (°C) is the mean daily or hourly air temperature; u2 (m/s) is the mean daily or hourly wind speed at 2 m height; es (kPa) is the mean saturation vapour pressure, for daily computation, which is computed as the average of es at maximum and minimum air temperature; ea (kPa) is the mean actual vapour pressure; Δ is the slope of the vapour pressure-temperature curve; γ is the psychrometric constant; Cn is the numerator constant for reference type and Cd is the denominator constant for reference type. Detailed descriptions of all the parameters and the ETref calculation procedures can be found in Allen et al. (2005). Equation 6 can be applied on an hourly or the daily time steps. The accuracy of the calculated ETref is dependent on the
AUSTRALIAN GEOMECHANICS | VOLUME 52: NO.2 JUNE 2017
64
AUSTRALIAN GEOMECHANICS | VOLUME 52: NO.2 JUNE 2017
COMPARISON AND EVALUATION OF METHODS FOR CALCULATING THORNTHWAITE MOISTURE INDEX SUN ET AL.
quality of data collected. If some of the required meteorological data are missing, it will directly affect the quality of ETref. The ASCE Standardized PM method provides procedures for the estimation of the missing data, which include the estimation of temperature, solar radiation, vapour pressure, and wind speed data. The level of accuracy for the estimated parameters depends upon the quantity and quality of data used.
2.2 THE DEVELOPMENT OF TMI EQUATIONS TMI computation equation (Equation 7) was originally developed by C. W. Thornthwaite in 1948. It was quickly accepted by the world scientific community and has been widely used by many researchers across a variety of disciplines with success over the last several decades. In Australia, TMI index is mainly used for classifying climate zones and estimating the depth of design soil suction changes. Aitchison and Richards (1965) adopted this equation for the determination of TMI and the results were used for delineation of the first TMI map of Australia. TMI contour maps for Melbourne and Victoria recorded in Australian Standard for Residential Slabs and Footings (i.e. Figure D1 and D2 in AS2870-2011) were also developed based on Equation 7 (Fityus et al. 2008). Over the past 15 years or so, this equation has been employed by a number of researchers for the development of TMI isopleth maps for various states of Australia, including New South Wales (Chan and Mostyn, 2008), Victoria (Lopes and Osman, 2010; Li and Sun, 2015), Queensland (Fox, 2000) and Western Australia (Hu et al. 2016).
TMI= I h − 0.6 I a
(7)
where, Ih and Ia are indices of humidity and aridity respectively, and are expressed as:
= Ih
100 R 100 D = Ia PET PET
(8)
where, R represents the moisture surplus or runoff (mm) (i.e. the amount of rainfall that cannot infiltrate a wet site); D represents the moisture deficit (mm) (i.e. the quantity of water that cannot be evapotranspired from a dry site because it is not available) and PET is the adjusted potential evapotranspiration (mm) and represents the water need. The coefficient of water surplus and deficit is based on the assumption that, 6 inches (15.24 cm) moisture surplus in one season will compensate 10 inches (25.4 cm) deficiency in another season, and the reason, as explained by Thornthwaite (1948), is simply because it is easier for water to enter the soil profile than it is for water to be extracted. In 1955, Thornthwaite and Mather (1955) revised this equation by eliminating the coefficient 0.6 for the aridity index so the equation becomes,
TMI= I h − I a
(9)
Equation 7 and 9 require TMI to be computed based upon an annual time step and there is a need to carry out the water balance approach. The term water balance was pioneered by Thornthwaite and it was defined as the balance between the income of water from precipitation and the outflow of water by evapotranspiration (Thornthwaite, 1948). This approach requires initial and maximum water storage information for the study site. However, these data are difficult to obtain and some of them never exist, and thus assumptions are necessary. In 1974, Mather (1974) made an assumption that rainfall would not augment the depleted storage and there was no net change in soil water storage over the long-term, leading to the following simplified TMI equation which requires only the annual precipitation P and the adjusted potential evapotranspiration PET:
P TMI 100 = − 1 PET
(10)
The determination of TMI by the use of Equation 7 or 9 is computationally intensive since a number of parameters and assumptions (e.g. values of initial (S0) and maximum (Smax) water storage) are required for conducting the water balance analysis. Equation 10, however, eliminates the need to carry out the water balance analysis. Due to its simplicity, Equation 10 has been employed by some researchers (e.g. McCabe and Wolock, 1992; Fityus et al. 1998; Xi et al. 2015).
AUSTRALIAN GEOMECHANICS | VOLUME 52: NO.2 JUNE 2017
AUSTRALIAN GEOMECHANICS | VOLUME 52: NO.2 JUNE 2017
65
COMPARISON AND EVALUATION OF METHODS FOR CALCULATING THORNTHWAITE MOISTURE INDEX SUN ET AL.
2.3 METHODOLOGY OF TMI DETERMINATION The most commonly used methodology for TMI calculation was the ‘year-by-year’ method. This method requires the existence of both temperature and rainfall data for the same year, but this is not always available. The major procedures in applying this method are as follows (note: Thornthwaite PET method is adopted for illustration): • • • • • •
Collect long-term fully recorded monthly precipitation and temperature data from the nearest weather observation station. Calculate monthly potential evapotranspiration using temperature data collected. Conduct water balance analysis for each month over a year (from January to December) to determine moisture deficit, moisture surplus/run off and water storage. Guidance for conducting the water balance analysis was given by McKeen and Johnson (1990). Sum monthly moisture deficit, moisture surplus and potential evapotranspiration to allow annual TMI to be calculated. Repeat the above procedures for a statistically significant number of years by the use of fully recorded historical data. Average a set of yearly TMI to obtain the mean for a particular site.
The ‘average year’ method was introduced by Fityus et al. (1998). The steps for employing this method are summarised as follows:
• • • •
3
Gather monthly precipitation and temperature data for the entire study period and then work out the monthly average. Determine potential evapotranspiration by employing the mean monthly temperature data. Carry out the water balance analysis for the determination of mean monthly moisture deficit, moisture surplus and water storage. Add mean monthly moisture deficit, moisture surplus and potential evapotranspiration to generate annual average TMI for any given site.
A COMPARATIVE STUDY OF DIFFERENT METHODS/PROCEDURES FOR CALCULATING TMI INDEX
The different definitions of the TMI and methods for estimating the potential evapotranspiration are discussed in the above sections. To evaluate and compare the TMI indices calculated by using the different assumptions and methods, a comparative study has been untaken by the authors. The results are presented in the following sections.
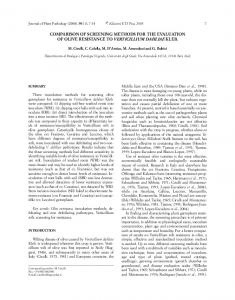
3.1 COMPARISON OF TMI VALUES CALCULATED BY THE TWO DIFFERENT PET EQUATIONS In this study, TMI values for selected sites in various states of Australia, which include Melbourne (VIC), Maryland (NSW) and Walkley Heights (SA) are calculated and compared. Fully recorded long-term climatic data sets for 19932013 are extracted from the following weather stations: Melbourne Airport (086282), Newcastle University (061390) and Adelaide Kent Town (023090). Meteorological data are employed for PET computation using the Thornthwaite method (Equation 2) and ASCE Standardized Penman-Monteith method (the reference vegetative cover of 0.12m (e.g. grass) is adopted) (Equation 6). Both calculated PET values are then employed to compute TMI by the use of the original TMI equation (Equation 7). As a temperature based method, the Thornthwaite PET method requires only temperature data which is commonly available for most weather stations in Australia. In marked contrast to the Thornthwaite PET method, the ASCE Standardized PM method is a radiation based method which requires diverse weather parameters, such as solar radiation, air humidity, wind speed, etc. It is rather difficult to collect all the required weather data as some of them never exist. These two PET calculation methods are chosen because Equation 2 has been widely used by numerous researchers in Australia and it is argued that Equation 6 produces the most reliable and accurate PET result among all the available PET calculation methods. The calculated PET and TMI are summarised in Table 5 and are also plotted in Figures 1-2 for comparison. Figures 1-2 show the significant discrepancies in the results obtained using the different methods. PET values computed by the Standardized PM method are much higher than those calculated using the Thornthwaite method. From Figure 1, it can be seen that that PET for Melbourne derived by using the Standardized PM equation is nearly double the value obtained by the use of the Thornthwaite equation. According to BOM Australia, based on a standard 30-years (1981-2010)
AUSTRALIAN GEOMECHANICS | VOLUME 52: NO.2 JUNE 2017
66
AUSTRALIAN GEOMECHANICS | VOLUME 52: NO.2 JUNE 2017
COMPARISON AND EVALUATION OF METHODS FOR CALCULATING THORNTHWAITE MOISTURE INDEX SUN ET AL.
climatology record, the mean monthly temperature in Maryland and Walkley Heights is around 18 Celsius degree while in Melbourne the temperature is approximately 15 Celsius degree. This trend is consistent with the temperature based Thornthwaite PET method as the higher temperature can lead to a larger PET. In contrast, PET derived by Standardized PM equation does not follow this trend since it is a radiation based method. Table 5: TMI calculation using different PET equations. Methodology
Location Melbourne
PET Calculation Equation
Maryland
PETi = ei
Di Ni 30
Walkley Heights
(Equation 2)
Melbourne
Maryland
ETref =
∆+γ (1+Cd u2)
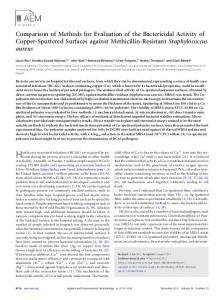
Mean Annual PET(cm) 76 89 86 151 TMI Calculation Equation TMI = Ih − 0.6 Ia (Equation 7) Mean Annual TMI -19 31 -20 -39 Interpolated Hs(m) 2.6 1.5 2.7 3.9 Note: Missing data for a particular day is obtained from the nearest neighbouring weather station.
Figure 1: PET calculated using different equations
Walkley Heights
C 0.408∆Rn -G+γ n u2(es -e a) T+273
139 -6 1.9
(Equation 6) 161 -40 4
Figure 2: TMI calculated using different PET methods
From Table 5. it can be seen that TMI value calculated by using ASCE Standardized PM equation is much lower (more negative) than that obtained by the use of Thornthwaite equation. Walkley Heights has the lowest TMI value, indicating it has a more arid climate and consequently, the design depth of suction change (Hs) is relatively larger than other sites. The climate of Maryland is the wettest with a TMI value of 31 (derived from Thornthwaite equation) or -6 (derived from Standardized PM equation). Although there are significant discrepancies between TMI values derived by the two different PET methods, the general trend for TMI is quite similar and the ranking of the sites is the same in both methods.
3.2 TMI COMPARISON AND EVALUATION USING VARIOUS EQUATIONS AND METHODS To assess and compare different TMI computation equations (i.e. Equations 7, 9 and 10) and methodologies (i.e. yearby-year method and average year method), a case study was conducted in three locations across Victoria, namely Mildura, Cape Otway and Wilsons Promontory. Long term historical data sets (both temperature and rainfall) were extracted from the nearest weather stations (i.e. Mildura Airport (076031), Cape Otway Lighthouse (090015) and Wilsons Promontory Lighthouse (085096)) over a 20-year period (i.e. 1994 to 2013). Thornthwaite method (Equation 2) was adopted for PET computation. TMI indices were derived by using Equation 7, 9 and 10 with both year-by-year and average year methods. The following assumptions were made in the TMI calculation: • Calculation always commences in January, • Maximum water storage (Smax) value of 10 cm was used (for Equation 7 and 9 only),
AUSTRALIAN GEOMECHANICS | VOLUME 52: NO.2 JUNE 2017
AUSTRALIAN GEOMECHANICS | VOLUME 52: NO.2 JUNE 2017
67
COMPARISON AND EVALUATION OF METHODS FOR CALCULATING THORNTHWAITE MOISTURE INDEX SUN ET AL.
•
Various values of initial (S0) water storage were employed when conducting water-balance analysis (for Equation 7 and 9 only). Table 6: Average TMI for the 20 year-period (1994-2013) Equation used :
Assumptions Sites S0 = 0cm Average Year S0 = 3cm Analysis S0 = 6 cm S0 = 9cm S0 = 10 cm S0 = 0cm Year-by-Year S0 = 3cm S0 = 6 cm Analysis S0 = 9cm S0 = 10 cm Equation used : S0 = 0cm S0 = 3cm Average Year S0 = 6 cm Analysis S0 = 9cm S0 = 10 cm S0 = 0cm S0 = 3cm Year-by-Year S0 = 6 cm Analysis S0 = 9cm S0 = 10 cm
Mildura -41.7 -39.6 -37.6 -35.5 -34.9 -41.5 -41.4 -41.3 -41.2 -41.1 -69.5 -66.1 -62.6 -59.2 -58.1 -69.5 -69.3 -69.1 -69.0 -69.0
Equation used : Average Year Analysis Year-by-Year Analysis
TMI = Ih – 0.6Ia (Equation 7) Cape Otway 22.5 25.0 27.5 30.0 30.9 29.5 29.6 29.7 29.9 29.9 TMI = Ih − Ia (Equation 9) 16.3 20.5 24.7 28.9 30.3 24.6 24.8 25.0 25.2 25.3
TMI = 100( -69.5 -69.5
P
PET
Wilsons Promontory 41.3 43.8 46.3 48.7 49.7 49.9 50.0 50.1 50.2 50.2
− 1) (Equation 10)
25.1 25.1
35.9 40.1 44.2 48.3 49.7 45.4 45.5 45.7 45.9 46.0 46.0 46.0
The TMI values calculated for the 20-year period between 1994 and 2013 using different equations (Equation 7, 9 and 10) and different methods (i.e. year-by-year and average year) for all study sites are summarised in Table 6. Five different values of S0 (ranging from 0 to 10 cm) were assumed to examine the impact of the initial water storage (S0) and the use of two different methods on the TMI calculations. It can be seen that TMI values calculated using Equation 9 and 10 are generally smaller (more negative) than that computed using Equation 7 and thus present a drier climatic condition. However, this is only an empirical inference, uncertainties involved are attributable to the non-rigorous climate classification system itself since it does not precisely and clearly define which TMI calculation equation and method was employed in correlating TMI and climate zone. Figure 3 and 4 reveal that the average year method is very sensitive to the assumed initial water storage values S0, with the biggest variation of up to 14 TMI units (calculated by Equation 9) for Cape Otway while the year-by-year analysis method is not sensitive to the assumed S0 values with the biggest variation of 0.7 TMI units (for Cape Otway, calculated by Equation 9). It can be seen that the discrepancies in TMI values calculated by the two methods increase with S0 values for drier climate (i.e. Mildura) and the largest difference occurred when soil water storage reached its capacity (i.e. S0 =10cm) (refer to Figures 3a and 4a). However, for the two moist coastal sites (i.e. Cape Otway and Wilsons Promontory), the greatest discrepancy occurred when soil water is assumed to be initially depleted (i.e. S0 = 0 cm).
AUSTRALIAN GEOMECHANICS | VOLUME 52: NO.2 JUNE 2017
68
AUSTRALIAN GEOMECHANICS | VOLUME 52: NO.2 JUNE 2017
COMPARISON AND EVALUATION OF METHODS FOR CALCULATING THORNTHWAITE MOISTURE INDEX SUN ET AL.
(a) Mildura
(b) Cape Otway
(c) Wilsons Promontory
Figure 3: TMI for various S0 (calculated by Equation 7)
(a) Mildura
(b) Cape Otway
(c) Wilsons Promontory
Figure 4: TMI for various S0 (calculated by Equation 9) TMI indices derived by different equations and methods (S0 was assumed to be 0 cm) are plotted in Figure 5 for comparison. Values computed by Equation 10 suggest there is no difference when either the year-by-year method or the average year method is employed. It can be seen that TMI values obtained by Equation 9 are almost the same as those computed using the simplified TMI equation (i.e. Equation 10) when the year-by-year method was used in the calculation. It is worth noting that for Mildura, the average year analysis yielded the same TMI of -69.5 when Equation 9 and 10 were used. This may be attributed to the absence of “runoff” since only a one-year water balance analysis was carried out when using Equation 9.
(a) Mildura
(b) Cape Otway
(c) Wilsons Promontory
Figure 5: Comparison of TMI calculated by different equations and methods (S0 = 0 cm)
4
COMPARISON OF TMI CONTOUR MAPS OF VICTORIA
TMI contour maps for Victoria have been developed by many authors, for example, Smith (1993), McManus et al. (2004), Lopes and Osman (2010), and Li and Sun (2015). There is no doubt that there are discrepancies between these various maps due to differences in assumptions, PET calculation methods, the quality and quantity of meteorological data and methods of interpolating the results between geographical locations.
AUSTRALIAN GEOMECHANICS | VOLUME 52: NO.2 JUNE 2017
AUSTRALIAN GEOMECHANICS | VOLUME 52: NO.2 JUNE 2017
69
COMPARISON AND EVALUATION OF METHODS FOR CALCULATING THORNTHWAITE MOISTURE INDEX SUN ET AL.
In this study, long-term historical weather data from 70 weather observation stations were used to delineate the TMI isopleth maps over the past 60 years for Victoria (in three 20 year periods, i.e. 1954-1973, 1974-1993 and 1994-2013). Weather data package was purchased from the Bureau of Meteorology (BOM), which have the fully recorded meteorological parameters required for this study. To compare the results calculated using different equations, a total of six TMI contour maps for Victoria were developed using Surfer® 11 (2012): three of these maps were based on the original Thornthwaite equation (Equation 7) and another three TMI contour maps were based on the simplified TMI equation (Equation 10). PET values were calculated using Thornthwaite method (i.e. Equation 2) and year-by-year analysis was employed for TMI calculations. The initial (S0) and maximum water storage (Smax) were taken as 0 mm and 100 mm respectively for water balance analysis.
(a) derived from Equation 7
(b) derived from Equation 10
Figure 6: TMI contour map for Victoria (1954 – 1973)
AUSTRALIAN GEOMECHANICS | VOLUME 52: NO.2 JUNE 2017
70
AUSTRALIAN GEOMECHANICS | VOLUME 52: NO.2 JUNE 2017
COMPARISON AND EVALUATION OF METHODS FOR CALCULATING THORNTHWAITE MOISTURE INDEX SUN ET AL.
(a) derived from Equation 7
(b) derived from Equation 10
Figure 7: TMI contour map for Victoria (1974 – 1993)
AUSTRALIAN GEOMECHANICS | VOLUME 52: NO.2 JUNE 2017
AUSTRALIAN GEOMECHANICS | VOLUME 52: NO.2 JUNE 2017
71
COMPARISON AND EVALUATION OF METHODS FOR CALCULATING THORNTHWAITE MOISTURE INDEX SUN ET AL.
(a) derived from Equation 7
(b) derived from Equation 10
Figure 8: TMI contour map for Victoria (1994 – 2013)
AUSTRALIAN GEOMECHANICS | VOLUME 52: NO.2 JUNE 2017
72
AUSTRALIAN GEOMECHANICS | VOLUME 52: NO.2 JUNE 2017
COMPARISON AND EVALUATION OF METHODS FOR CALCULATING THORNTHWAITE MOISTURE INDEX SUN ET AL.
TMI isopleth maps of Victoria delineated by the use of the Equation 7 and simplified Equation 10 for three 20 year periods (1954-1973, 1974-1993 and 1994-2013) are plotted in Figures 6-8. Climate zones are classified based on the averaged TMI for 20-year intervals and Table 2. From Figures 6-8, it can be seen that the semi-arid zone (zone 5, - 40< TMI < -25) and arid zone (zone 6, TMI< -40) were generally distributed in the north-west of the state, whereas the wettest zone (i.e. zone 1, TMI > 10) spreads out along the southern and eastern coastal regions. The results have confirmed the belief of many geotechnical engineers that the State of Victoria was becoming drier in terms of average TMI with the most notable change occurred during the last 20 years. Comparing the TMI climate zones for the first 20year period and the last 20-year period, it can be seen that the climate zone boundaries have changed quite remarkably over the average 40 year interval between the first and last 20 year periods that we have studied. It is notable that TMI maps developed using Equation 10 (Figures 6b, 7b and 8b) show a more arid climate condition than those produced using Equation 7 (Figures 6a, 7a and 8a). For example, there was no presence of climate zone 6 for the TMI isopleth maps (Figure 6a and 7a) developed using Equation 7 in the first and second 20 year periods (i.e. 19541973 and 1974-1993). The arid zone 6 appeared in the north-west of the state only in the recent 20-year period (19942013). However, as shown in Figures 6b, 7b and 8b, the climate zone 6 has appeared on the TMI maps produced using Equation 10 in all three 20 year periods since 1954. The TMI maps developed using both methods seem to have similar spatial patterns for the three time intervals. However, more severe aridity can be observed from the maps produced by using the simplified TMI equation (i.e. Equation 10). Generally speaking, TMI variation trends are quite similar for TMI contour maps developed using both methods, with more severe aridity shown in the maps produced by Equation 10. Take the most densely populated Melbourne CBD for example, its prevailing climate zone has changed from zone 2 (TMI of -3, Figure 6a) to zone 4 (TMI of -15, Figure 8a) over the average 40 year interval between our first and last 20 year periods. Then, according to TMI values derived using Equation 10, the decrease of TMI from -12 in the first 20-year period to -28 in the third 20-year period has led to the degradation (towards to a more arid condition) of the climate zone and consequently the temperate zone 3 (Figure 6b) has been superseded by semi-arid zone 5 (Figure 8b). Such TMI variation indicates that greater ground movement can be expected as the result of seasonal moisture change, particularly for the western and the south-western suburbs of Melbourne (e.g. Laverton, Avalon and Werribee). It is worth noting that the wet climate area in the south-east Victoria has expanded through the period from 1954 to 2013. As can be seen from Figure 6, there was only a small area of zone 1 along the south-eastern coastal area in the first 20-year period. This wet climate area has gradually expanded to the far north-east border (Figure 8) as a result of the significant growth of the moist climate.
5
CONCLUSIONS
Climate affects the extent of soil moisture variation likely to occur through time and hence the amount of foundation movement likely to occur on moisture reactive foundation soils. The extent of variation in the soil moisture profile between the extremes of wet and dry is greater in a more arid climate. The Thornthwaite Moisture Index (TMI) is now widely used in Australia to categorize climate zones across various regions for the purposes of the Australian standard Residential Slabs and Footings standard, AS2870 (2011). The standard suggests the use of TMI to estimate the depth of design suction change (Hs) which is required for the prediction of the characteristic ground movement (ys). However, AS2870 (2011) does not specify which equation or method should be employed for TMI calculation. TMI values will vary significantly if different equations, methods, length of study periods, assumptions and compromises are used in the calculation. There are numerous equations and models available for PET estimation. TMI values calculated using different PET models can vary greatly. A case study has been carried out to evaluate the TMI discrepancies arising from the use of the Thornthwaite PET equation and the ASCE Standardized Penman-Monteith equation. The results have shown that the differences between the two equations are quite significant. Such discrepancies can be explained by the different methods, equations and climatic data used in the PET calculation. Of the three sites studied in the PET evaluation, the site at Maryland was the wettest and AS2870 would assign it a depth of design suction change of 1.5 – 1.9m, depending on which TMI value is adopted. The substantially negative TMI values for Melbourne and Walkley Heights demonstrate both sites have experienced severe aridity in the past two decades. To compare and evaluate how equations, methods and assumptions employed would affect the computed TMI values, another case study has been conducted for three locations in Victoria from 1994 to 2013. This study has demonstrated
AUSTRALIAN GEOMECHANICS | VOLUME 52: NO.2 JUNE 2017
AUSTRALIAN GEOMECHANICS | VOLUME 52: NO.2 JUNE 2017
73
COMPARISON AND EVALUATION OF METHODS FOR CALCULATING THORNTHWAITE MOISTURE INDEX SUN ET AL. COMPARISON AND EVALUATION OF METHODS FOR CALCULATING THORNTHWAITE MOISTURE INDEX SUN ET AL.
that TMI index value calculated using Equation 9 and 10 are generally smaller (more negative) than that computed using the original TMI equation (i.e. Equation 7), indicating a drier climatic condition. The results (Figure 3 and 4) indicate that indexyear value calculated using Equation to 9 and are generally smaller values (more negative) than that computed using this method should be that theTMI average method is very susceptible the 10 assumed initial storage S0 and thus the original equation (i.e.method Equation 7), sensitive indicatingtoa the drier climatic The results (Figure 3 and indicate . It was found that when carrying out4)the yearavoided while TMI the year-by-year is not values of S0condition. thus this 10. method should be that the averageTMI yearvalues method is very susceptible initialtostorage values S0 and by-year method, computed by Equationto9the areassumed quite similar those calculated by Equation avoided while the year-by-year method is not sensitive to the values of S0. It was found that when carrying out the yearIn by-year this study, TMI TMI values calculated using Equation 10 to were also employed produce10. six TMI isopleth method, values computed byEquation Equation79and are quite similar those calculated bytoEquation maps (i.e. three based on Equation 7 and three based on Equation 10) for Victoria for three 20 year periods (i.e. 1954In this study, TMI values calculatedThese using maps Equation Equation 10 were also employed to produce six TMI isopleth 1973, 1974-1993 and 1994-2013). have7 and shown that TMI variation trends are quite similar using both maps (i.e. three based on Equation 7 and three based on Equation 10) for Victoria for three 20 year periods (i.e. 1954methods, that is, Victoria has suffered a drying climate over the average 40 year interval between the first and last 20 1973, 1974-1993 andthe 1994-2013). These maps(e.g. have shown decrease that TMIofvariation trends are quite the similar usingrecent both year study periods and most notable changes a marked TMI) occurred between two most that is, Victoria has suffered a drying climatedeveloped over the average year interval firstEquation and last 10) 20 20methods, year periods. It is important to note that TMI maps using the40simplified TMIbetween equationthe(i.e. year an study periods and severe the most notable changes (e.g. a marked decrease of TMI) occurredTMI between the two most recent show unreasonably aridity compared to those produced using the original equation (Equation 7). 20 year periods. It is important notedepth that TMI maps soil developed the(H simplified TMI equation (i.e. Equation 10) Overestimation of TMI leads to a to larger of design suctionusing change s) which can add unnecessary cost for the show an unreasonably severe aridity compared to those produced using the original TMI equation (Equation 7). construction of footings for residential buildings. Overestimation of TMI leads to a larger depth of design soil suction change (Hs) which can add unnecessary cost for the From the results and discussion provided, it is clear that further research is required to investigate the impact of the construction of footings for residential buildings. different definitions of the TMI and different methods for estimating the potential evapotranspiration on the TMI From the Furthermore, results and discussion provided, it is clear further research requiredthe to correlation investigate between the impact of and the calculation. there is still much research to that be done to verify andisimprove TMI different definitions of the TMI and different methods for estimating the potential evapotranspiration on the TMI Hs. calculation. Furthermore, there is still much research to be done to verify and improve the correlation between TMI and Hs.
6
ACKNOWLEDGEMENT
This research was funded partially by the6Australian Research Council via the ARC Linkage Grant No. LP16160100649. ACKNOWLEDGEMENT The authors would like to thank the anonymous reviewers for their valuable comments and suggestions to improve the This research was funded partially by the Australian Research Council via the ARC Linkage Grant No. LP16160100649. quality of the paper. The authors would like to thank the anonymous reviewers for their valuable comments and suggestions to improve the quality of the paper.
7 REFERENCES Aitchison, G.D. and Richards, B.G. 1965. A broad-scale study of moisture conditions in pavement subgrades throughout 7 REFERENCES
Australia: Parts 2 & 3. Moisture Equilibria & Moisture Changes in Soils Beneath Covered Areas. Butterworths, Aitchison, G.D. and Richards, B.G. 1965. A broad-scale study of moisture conditions in pavement subgrades throughout Sydney. Australia: Parts 2 & 3. Moisture Equilibria & Moisture Changes in Soils Beneath Covered Areas. Butterworths, Aitchison, G.D. and Woodburn, J.A. 1969. Soil suction in foundation design. Proceedings of 7th International Conference Sydney. on Soil Mechanics and Foundation Engineering, Mexico City: 1-8. Aitchison, G.D. and Woodburn, J.A. 1969. Soil suction in foundation design. Proceedings of 7th International Conference Allen, R. G., Pereira, L. S., Raes, D. and Smith, M. 1998. Crop Evapotranspiration: Guidelines for computing crop water on Soil Mechanics and Foundation Engineering, Mexico City: 1-8. requirements. Irrig. and Drain. Paper 56, Food and Agriculture Organization the United Rome, Allen, R. G., Pereira, L. S., Raes, D. and Smith, M. 1998. Crop Evapotranspiration: of Guidelines forNations, computing crop300p. water Allen, R.G., Walter, I.A., Elliott, R.L., Howell, T.A., Itenfisu, Daniel, Jensen, M.E., and Snyder, R.L., eds. 2005. The requirements. Irrig. and Drain. Paper 56, Food and Agriculture Organization of the United Nations, Rome, 300p. ASCE standardized reference evapotranspiration equation, Reston, Va., American Society of Civil Engineers, Allen, R.G., Walter, I.A., Elliott, R.L., Howell, T.A., Itenfisu, Daniel, Jensen, M.E., and Snyder, R.L., eds. 2005. The 196p. ASCE standardized reference evapotranspiration equation, Reston, Va., American Society of Civil Engineers, AS2870, 196p. 2011. Australian Standard: Residential Slabs and Footings. Standards Australia. Chan, I. and Mostyn,2011. G. 2008. Climatic factorsResidential for AS2870 for and the Metropolitan SydneyAustralia. area. Australian Geomechanics. AS2870, Australian Standard: Slabs Footings. Standards Vol. p. 17-28. Chan, I. and43(1), Mostyn, G. 2008. Climatic factors for AS2870 for the Metropolitan Sydney area. Australian Geomechanics. Chan, I. and Mostyn, 2009. Climatic factors for AS2870 for New South Wales. Australian Geomechanics. Vol. 44(2), Vol. 43(1), G. p. 17-28. p. and 41- Mostyn, 46. Chan, I. G. 2009. Climatic factors for AS2870 for New South Wales. Australian Geomechanics. Vol. 44(2), Chow, p. 41-V.T. 46. 1964. Handbook of Applied Hydrology. McGraw-Hill, New York, USA. Er, Y. andChow, Rifat, V.T. B. 2014. climatic factors for the classification of Oklahoma pavement regions. Geo1964. Evaluation Handbook ofofApplied Hydrology. McGraw-Hill, New York, USA. Technical Papers. of p. 4037-4046. Er, Y. Congress and Rifat,2014 B. 2014. Evaluation climatic factors for the classification of Oklahoma pavement regions. GeoFityus, S., Walsh, P.F. andTechnical Kleeman,Papers. P. W. p. 1998. The influence of climate as expressed by the Thornthwaite index on the Congress 2014 4037-4046. depthP.F. of and moisture change of clay soils the Hunter Conference Engineering Fityus,design S., Walsh, Kleeman, P. W. 1998. Theininfluence of Valley. climate as expressedon byGeotechnical the Thornthwaite index on and the Engineering Geology in thechange HunterofValley, Conference Publications, Springwood, p. 51-265. design depth of moisture clay soils in the Hunter Valley. Conference onAustralia. Geotechnical Engineering and Fityus, S. and Buzzi, O.Geology 2008. On of the Thornthwaite Moisture Index to infer depthsAustralia. of seasonal moisture change. Engineering inthe the use Hunter Valley, Conference Publications, Springwood, p. 51-265. Geomechanics, 43 of (4), 69-76. Fityus,Australian S. and Buzzi, O. 2008. On Vol. the use thep.Thornthwaite Moisture Index to infer depths of seasonal moisture change. Fox, E. 2000. A climate-based designVol. depth Australian Geomechanics, 43 of (4),moisture p. 69-76.change map of Queensland and the use of such maps to classify under AS 2870-1996. Australian Geomechanics. Vol.map 35(4), p. 53-60. and the use of such maps to classify Fox, E.sites 2000. A climate-based design depth of moisture change of Queensland Fox, E. 2002. Development of a map of Thornthwaite Moisture Index Isopleths for Queensland. Australian Geomechanics. sites under AS 2870-1996. Australian Geomechanics. Vol. 35(4), p. 53-60. Fox, E.Vol. 2002. Development 37(3), p. 51-59. of a map of Thornthwaite Moisture Index Isopleths for Queensland. Australian Geomechanics. Vol. 37(3), p. 51-59.
AUSTRALIAN GEOMECHANICS | VOLUME 52: NO.2 JUNE 2017 AUSTRALIAN GEOMECHANICS | VOLUME 52: NO.2 JUNE 2017
74
AUSTRALIAN GEOMECHANICS | VOLUME 52: NO.2 JUNE 2017
COMPARISON AND EVALUATION OF METHODS FOR CALCULATING THORNTHWAITE MOISTURE INDEX COMPARISON AND EVALUATION OF METHODS FOR CALCULATING THORNTHWAITE MOISTURE INDEX SUN ET AL. SUN ET AL.
Grismer, M.E., Orang, M., Snyder, R. and Matyac, R. 2002. Pan evaporation to reference evapotranspiration conversion Grismer, M.E., Orang, M., Snyder, R. and Matyac, R. 2002. Pan evaporation to reference evapotranspiration conversion methods. J. Irrig. and Drain. Engrg. Vol. 128(3), p. 180 -184. methods. J. Irrig. and Drain. Engrg. Vol. 128(3), p. 180 -184. Hamon, W. R. 1963. Computation of direct runoff amounts from storm rainfall. Int. Assoc. Sci. Hydrol. Pub. 63, p. 52-62. Hamon, W. R. 1963. Computation of direct runoff amounts from storm rainfall. Int. Assoc. Sci. Hydrol. Pub. 63, p. 52-62. Hargreaves, G. H. and Samani, Z. A. 1985. Reference crop evapotranspiration from temperature. Applied Engrg.in Agric. Hargreaves, G. H. and Samani, Z. A. 1985. Reference crop evapotranspiration from temperature. Applied Engrg.in Agric. Vol.1 (2), p. 96-99. Vol.1 (2), p. 96-99. Hu, Y., Saraceni, Hu, Y., Saraceni,P.,P.,Cocks, Cocks,G.G.and andZhou, Zhou,M. M.2016. 2016.TMI TMIassessment assessmentand andclimate climate zones zones in in Western Western Australia. Australia. Australian Australian Geomechanics, Vol. 51 (3), p. 79-89. Geomechanics, Vol. 51 (3), p. 79-89. Irmak, Florida Irmak,S. S.and andHaman, Haman,D.D.Z.Z.2003. 2003.Evapotranspiration: Evapotranspiration:potential potential oror reference? reference? Gainesville, Gainesville, FL: FL: University University of of Florida Institute of Food and Agricultural Sciences Document ABE 343. Institute of Food and Agricultural Sciences Document ABE 343. Jensen, ASCE Jensen,M.M.E.,E.,Burman, Burman,R.R.D.D.and andAllen, Allen,R.R.G.G.1990. 1990.Evapotranspiration Evapotranspiration and and irrigation irrigation water water requirements. requirements. ASCE Manuals and Reports on Engineering Practice No. 70: New York, 332 p. Manuals and Reports on Engineering Practice No. 70: New York, 332 p. Jewell, Jewell,S.A. S.A.and andMitchell, Mitchell,P.W. P.W.2009. 2009.The TheThornthwaite Thornthwaite Moisture Moisture Index Index and and seasonal seasonal soil soil movement movement in in Adelaide, Adelaide, Australian Geomechanics. Vol. 44 (1), p. 59-67. Australian Geomechanics. Vol. 44 (1), p. 59-67. Karunarathne, Karunarathne,A.M.A.N., A.M.A.N.,Gad, Gad,E.F., E.F.,Disfani, Disfani,M.M., M.M., Sivanerupan, Sivanerupan, S.S. and and Wilson, Wilson, J.L. J.L. 2016. 2016. Review Review of of calculation calculation procedures Vol. proceduresofofThornthwaite ThornthwaiteMoisture MoistureIndex Indexand andits itsimpact impact on on footing footing design. design. Australian Australian Geomechanics, Geomechanics, Vol. 51(1), p. 85-95. 51(1), p. 85-95. Li,Li, J. J. and Cameron, D.D.A.A.2002. of and Cameron, 2002.AAcase casestudy studyofofa acourtyard courtyardhouse housedamaged damagedby byexpansive expansive soils. soils. Journal Journal of of Performance Performance of Constructed Facilities, ASCE, Vol. 16 (6), p. 169-175. Constructed Facilities, ASCE, Vol. 16 (6), p. 169-175. Li,Li, J.,J., Cameron, Cameron,D.D.A.A.and andRen, Ren,G.G.2014. 2014.Case Casestudy studyand andback backanalysis analysisof of aa residential residential building building damaged damaged by by expansive expansive soils. Computers soils. Computersand andGeotechnics, Geotechnics,Vol. Vol.56, 56,p.p.89-99. 89-99. Li,Li, J. J.and andSun, Sun,X.X.2015. 2015.Evaluation Evaluationofofchanges changesofofThornthwaite ThornthwaiteMoisture Moisture Index Index in in Victoria. Victoria. Australian Australian Geomechanics, Vol.50 (3), p.p.39-49. Vol.50 (3), 39-49. Lopes, D.D.and Lopes, andOsman, Osman,N.Y. N.Y.2010. 2010.Changes ChangesofofThornthwaite’s Thornthwaite’stotal totalmoisture moistureindices indices in in Victoria Victoria from from 1948-2007 and the effect onon seasonal effect seasonalfoundation foundationmovement. movement.Australian AustralianGeomechanics, Geomechanics,Vol. Vol.45 45 (1), (1), p. p. 37-48. 37-48. Mather, J.R. 1974. Climatology: Mather, J.R. 1974. Climatology:Fundamentals Fundamentalsand andApplications. Applications.McGraw McGrawHill, Hill,USA, USA,p. p. 113-131. 113-131. McCabe, G.G.J. J.and McCabe, andWolock, Wolock,D.M. D.M.1992. 1992.Effects Effectsofofclimatic climaticchange changeand andclimatic climatic variability variability on on the the Thornthwaite Thornthwaite moisture index inin thetheDelaware index DelawareRiver RiverBasin. Basin.Climatic ClimaticChange, Change,Vol. Vol.20, 20,p.p.143-153. 143-153. McKeen,R.G. R.G.and andJohnson, Johnson,L.D. L.D.1990. 1990.Climate-controlled Climate-controlled soil soil design design parameters parameters for for mat mat foundations. foundations. Journal of McKeen, GeotechnicalEngineering, Engineering,Vol. Vol.116 116(7), (7),p.p.1073 1073-1094. -1094. Geotechnical Mitchell, P.W.2012. 2012.Footing Footingdesign designfor fortree treeeffects effectsconsidering consideringclimate climatechange. change. Proceedings Proceedings 2012 2012 ANZ Geomechanics Mitchell, P.W. Conference,Melbourne. Melbourne.No. No.1.3.11, 1.3.11,p.p.290-295. 290-295. Conference, Mitchell, P.W. 2013.Climate Climatechange changeeffects effectsononexpansive expansivesoil soilmovements. movements.Proceedings Proceedings of of the the 18th 18th ICSMGE, ICSMGE, Paris. Mitchell, P.W. 2013. Priestley,C.C.H.H.B.B.and andTaylor, Taylor,R.R.J.J.1972. 1972.On Onthe theassessment assessment ofof surface surface heat heat flux flux and and evaporation evaporation using large scale Priestley, parameters. Mon.Weath. Weath.Rev. Rev.100, 100,p.p.81-92. 81-92. parameters. Mon. Sun, Zhou,A.A.and andRen, Ren,G.G.2015. 2015.The Theimpacts impactsofofclimate climatechange change on on expansive expansive soil soil movements movements in Australia, Sun, X.,X.,Li,Li,J.,J.,Zhou, Proceedingsofofthe the6th 6thAsia AsiaPacific PacificConference Conferenceon onUnsaturated UnsaturatedSoils: Soils:Unsaturated Unsaturated Soil Soil Mechanics Mechanics -- from from Theory Proceedings Theory Practice, pp.697-702. 697-702. to to Practice, pp. Thornthwaite, C.W.1948. 1948.An Anapproach approachtoward towarda arational rationalclassification classificationof ofclimate. climate. The The Geographical Geographical Review, Review, Vol. Vol. 38(1), Thornthwaite, C.W. 38(1), p. 55-94. p. 55-94. Thornthwaite,C.W. C.W.and andMather, Mather,J.R. J.R.1955. 1955.The Thewater waterbalance, balance, Publ. Publ. Climatol., Climatol., Laboratory Laboratory of of Climatology. Climatology. Drexel Thornthwaite, Drexel Institute of Technology, Vol. 8 (1), p. 1-104. Institute of Technology, Vol. 8 (1), p. 1-104. Walsh, Fityus,S.S.and andKleeman, Kleeman,P.P.1998. 1998.AAnote noteon onthe thedepth depthofofdesign design suction suction change change for for clays clays in in South South Western Western Walsh, P.,P.,Fityus, Australia andSouth SouthEastern EasternQueensland. Queensland.Australian AustralianGeomechanics, Geomechanics,Vol. Vol.33(3), 33(3), p. p. 37-40. 37-40. Australia and
AUSTRALIAN GEOMECHANICS | VOLUME 52: NO.2 JUNE 2017 AUSTRALIAN GEOMECHANICS | VOLUME 52: NO.2 JUNE 2017
AUSTRALIAN GEOMECHANICS | VOLUME 52: NO.2 JUNE 2017
75