International Journal of Future Computer and Communication, Vol. 2, No. 6, December 2013
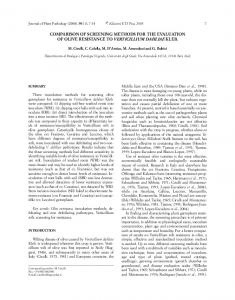
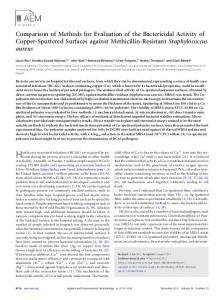
A Comparison and Evaluation of Computerized Methods for OD Localization and Detection in Retinal Images Kiran Yaseen, Anam Tariq, and M. Usman Akram modified form of original snake technique Detection is done by changing two aspects in original snake technique such as clustering and smoothing update. In this paper, we compare the OD localization techniques that localize the optic disc using canny edge detection and brightest region technique. We also compare the OD detection techniques that detect the optic disc using hough transform and LoG filtering The paper is organized in four sections. In Section II, comparison and evaluation of the two techniques for automated OD localization and detection is done in detail. Experimental results on the retinal images of the DRIVE and STARE databases and their analysis are given in Section III followed by conclusion in Section IV.
Abstract—Automated localization and detection of optic disc (OD) is essential step in the analysis of digital diabetic retinopathy systems. Retinal images give unique diagnostic about eye diseases. The detection of OD helps in early detection of proliferative diabetic retinopathy. In this paper two computerized optic disc localization and detection techniques are compared. First technique is uses edge detection method to localize the OD and Hough transform method to detect the OD. Second technique uses brightest region method for OD localization and LOG filtering method for OD detection. These techniques can be used to develop automated diagnostic system for OD localization and detection. We have used publicly available DRIVE and STARE databases for the testing of the two techniques. Experimental results showed that Hough transform technique gives better results. Index Terms—Diabetic retinopathy, optic disc, hough transform, LoG filtering, OD detection, retinal image, brightest region.
I. INTRODUCTION Retinopathy is a disease of the retina. Diabetic retinopathy is most common diabetic eye disease, is caused by changes in the blood vessels of the retina. Diabetic retinopathy can lead to poor vision and even blindness. Retinal images give unique problem-solving information about eyes diseases. For assessment of retina, to support ophthalmologists many automated methods have been developed. Optic disc (OD) is very important organ in eye where optic nerve enters the retina. It appears bright yellow or white in colour in retinal images. Accurate localization and detection of optic disc boundary is very useful in proliferate diabetic retinopathy where delicate vessels develop in retina. Many techniques have been proposed for OD localization and detection. Hoover [1] utilized the geometric relationship between the optic disk and main blood vessels to identify the disk location. He described a method based on a fuzzy voting mechanism to find the optic disc location. Walter et. al. [2] found edges of optic disc by applying morphological filtering includes erosion, dilation, opening and closing techniques. Then water transformation is used to find contours (outline) of optic disc. Sinthanayothin [3] applied relative fast deviation intensity method for optic disc detection. The variation of intensity of adjacent pixels was used for identification of the optic disc. Juan et al. [4] used
Fig. 1. Flow chart of hough transform technique
II. COMPARISON OF OD LOCALIZATION AND DETECTION TECHNIQUES The two techniques are compared in this section. A. Technique Using Hough Transform The Hough transform is a technique to identify the locations and orientations of certain types of features in a digital image. The systematic overview is given in Fig. 1. In summary, given a retinal image, its preprocessing is done by
Manuscript received December 18, 2012; revised February 17, 2013. Kiran Yaseen and Anam Tariq are with Department of Software Engineering, Fatima Jinnah Women University, Rawalpindi, Pakistan (email:
[email protected],
[email protected]). M. Usman Akram is with Department of Computer Engineering, NUST, Pakistan (e-mail:
[email protected]).
DOI: 10.7763/IJFCC.2013.V2.238
613
International Journal of Future Computer and Communication, Vol. 2, No. 6, December 2013
using averaging filter, than OD localization is done by computing highest gray levels and by extracting ROI. OD detection is done using Hough transform. 1) Preprocessing Pre-processing is done for removal of noise and for enhancing some object features. Basic steps for preprocessing are, Image is converted to grayscale. An average low pass filter of size 31×31 (using (1)) is applied on the gray scale image in order to smooth the image.
R=
1 961 ∑ zi 961 i =1
technique 1. 3) OD detection Hough transform consists of parameterized description of a feature at any given location in the original image space. A multi-dimensional array in the space defined by these parameters is then generated. At each point, a value is accumulated; indicating probability of an object generated by the parameters defined at that point fits the given image. Any points in the array that have relatively higher values are used to describe features that may be projected back onto the image. The higher to value, the bigger possibility that the features actually present in the image. The Hough transform can be used for representing objects that can be parameterized mathematically [5]. For example, in our case, a circle, can be parameterized by (2)
(1)
where Z’s are values of image gray levels and R is the smoothed image. Fig. 2 shows the original image and preprocessed image using technique 1.
(x - a) 2 + (y - b) 2 = r2
(2)
where (a, b) is the coordinate of center of the circle that passes through (x, y) and r is its radius. Hough accumulator is a 2-D matrix. The values in Hough accumulator are equal to the number of border points of circle in an image. The algorithm is stopped up when maximum of Hough accumulator for given radius is greater than 60% of margin of image points of ideal circle. The position of the maximum is supposed to be focus of optic disk. Hough transformation gives the center and radius of a circle and approximate border of optic disc [5]. Fig. 4 shows the image after OD detection.
(a) (b) Fig. 2. Preprocessing: (a) Original image, (b) Preprocessed image
(a)
Fig. 4. OD Detection using hough transform
B. Technique Using LoG filtering and Thresholding The systematic overview of this technique is given in Fig. 5. In summary, given a retinal image, its preprocessing is done by using median filter, than OD localization is done by using brightest region technique. OD detection is done using LoG filtering and thresholding.
(b) (c) (d) Fig. 3. OD Localization: (a) Result of localization, (b) ROI, (c) Canny edge detection, (d) Dilation
2) OD localization The optic disc is characterized by gray values which are brighter than background values. Optic disc can be localized by [5], Computing maximum gray level values form the histogram of the preprocessed image. Extract ROI (Region of Interest) of size 130x130 for reducing complexity. Perform canny edge detection on the ROI image to extract the edges of the image. Apply morphological dilation to join weak edges. Fig. 3 shows the OD localization process in detail using
1) Preprocessing Preprocessing is basically done to remove noise from the image. The basic steps of preprocessing are, Image is converted to gray scale. A 3×3 median filter (using (3)) is applied on the image to enhance it. fˆ ( x , y ) = median ( s , t )∈ S
{ g ( s , t )} xy
(3)
Fig. 6 shows the original image and preprocessed image using technique 2. 614
International Journal of Future Computer and Communication, Vol. 2, No. 6, December 2013
Fig. 7. OD localization: (a) Grayscale image, (b) Circular kernel filter, (c)Convolution, (d) Power law transformation, (e) OD localized
Fig. 8. OD Detection: (a) Red channel, (b) Gaussian blur, (c) Maximum image, (d) LoG filtering, (e)Thresholding, (f) Dilation, (g) Boundary fit
Fig. 7 shows the OD localization process in detail using technique 2.
Fig. 5. Flow chart of LoG filtering technique
2) OD localization OD localization is done by using brightest region method in this technique. The basic steps for OD localization are, 1) Convert the image to grayscale. 2) Make a circular kernel image. 3) Apply convolution on original image using circular filter image. 4) Apply power law transformation. After raising the factor optic disc will be clearly localized.
3) OD detection OD detection is done by LoG filtering in this technique. Following steps are applied for the OD detection using LoG filtering: Take the red channel of OD localized image. Take Gaussian blur of red channel image using (4).
G ( x, y ) =
1 2πσ
2
e
−
x2 + y2 2σ 2
(4)
Take maximum of red channeled and Gaussian blurred image. Then apply LoG filtering using (5).
1 ⎡ x2 + y2 ⎤ − LoG ( x, y ) = 1− e 2σ 2 ⎥⎦ πσ 4 ⎢⎣ (a) (b) Fig. 6. Preprocessing: (a) Original image, (b) Median filtered image
x2 + y 2 2σ 2
(5)
Apply global thresholding on the LoG filtered image. Apply morphological dilation to close the edges and to 615
International Journal of Future Computer and Communication, Vol. 2, No. 6, December 2013
remove the thin vessels. Fit the OD boundary. Fig. 8 shows the OD detection process in detail using technique 2.
database and average accuracy for OD detection. But in LoG transformation OD is not detected in most of images. In comparison of Hough transform technique with brightest region technique (LoG filtering), Hough transform technique gives better results. Fig. 9 shows the result of both techniques on different input retinal images.
IV. CONCLUSION The two computerized methods for OD localization and detection are compared in this paper. For both techniques Hough transform and LoG filtering a test product has been implemented in MATLAB 7.0 on a p4 PC under Windows XP. Both methods were able to localize and detect optic disc. But Hough transform gives much better results as compared to LoG filtering technique. In many retinal images LoG filtering technique failed to detect OD clearly. In addition Hough transform is simpler and takes less computation time as compared to LoG transform brightest region technique. REFERENCES [1] [2] Fig. 9. Experimental Results: (a) Original Images from DRIVE and STARE, (b) OD localization using technique 1, (c) OD localization using technique 2, (d) OD Detection using technique 1, (e) OD Detection using technique 2
[3]
TABLE I: OPTIC DISC LOCALIZATION AND DETECTION RSEULTS Technique Hough Transform Hough Transform LoG Filtering LoG Filtering
Database
Accuracy for localization (%)
Average accuracy for detection
DRIVE
100
0.955
STARE
93.8
0.921
DRIVE
85
0.75
[6]
STARE
80
0.72
[7]
[4]
[5]
III. EXPERIMENTAL RESULTS
A. Hoover and M. Goldbaum, “Locating the optic nerve in a retinal image using the fuzzy convergence of the blood vessels,” IEEE Trans. on Medical Imaging, vol. 22, no. 8, pp. 951 – 958, August 2003. T. Walter, J. C. Klein, P. Massin, and A. Erginay, “A contribution of image processing to the diagnosis of diabetic retinopathy —Detection of exudates in color fundus images of the human retina,” IEEE Transactions on Medical Imaging, vol. 21, no. 10, pp. 1236-1243, October 2002. C. Sinthanayothin, J. F. Boyce, H. L. Cook, and T. H. Williamson, “Automated localisation of the optic disc, fovea, and retinal blood vessels from digital color fundus images,” British Journal of Ophthalmology, vol. 83, pp. 902–910, 1999. J. Xu, E. Sung, O. Chutatape, C. Zheng, and P. Chew, “Automated optic disk segmentation via a modified snake technique,” in Proc. 9th International Conference on control, automation, robotics and vision, pp. 1-6, Dec. 2006. M. U. Akram, A. Khan, K. Iqbal, and W. H. Butt, “Retinal Images: Optic Disc Localization and Detection,” in Proceedings of ICIAR 2010, Part II, LNCS 6112, pp. 40-49, 2010. Image Sciences Institute. [Online]. Available: http://www.isi.uu.nl/Reseach/Databases/DRIVE/results.php Hoover STARE database. [Online]. http://www.ces.clemson.edu/ahoover/stare
Available:
Kiran Yaseen did her bachelor’s in software engineering from Fatima Jinnah Women University. Her research interests include medical image processing and biometrics.
We have evaluated and tested both the techniques using images from DRIVE and STARE databases. The DRIVE [6] database consists of 40 RGB color images of the retina. The images are of size 768×584 pixels, eight bits per color channel. The STARE [7] database consists of 20 RGB color images of the retina. The images are of size 605×700 pixels, 24 bits per pixel (standard RGB). The decision for successful localization or failed localization is based on human eye observation. For the verification of optic disc detection results, optic disks are manually labeled by the ophthalmologists for each image. The manually segmented optic discs by human observer are used as ground truth. Table I summarizes the results of optic disc localization and detection using the two databases. It shows the accuracy (successful localized OD) of both algorithms for each
Anam Tariq is a lecturer in Department of Software Engineering, FJWU, Pakistan. She has done her Masters in Computer Engineering from NUST in 2013. She has wide variety of research articles and journals to her credit. Her current research interests focus on medical image processing, biometrics and pattern recognition. Usman Akram is an assistant professor in Department of Computer Engineering, NUST, Pakistan. He has done his PhD in Computer Engineering from NUST in 2012. He received several awards for his research and teaching excellence. His current research interests focus on medical image processing, biometrics, pattern recognition and machine learning and his current research findings appear in wide variety of journals.
616