Evaluation of Core-Edge Storage Area Network Designs using Simulation Cameron G. Walker, Michael J. O’Sullivan, Mihiriyani Elangasinghe Department of Engineering Science, University of Auckland, P O Box 92019, Auckland, New Zealand, {
[email protected],
[email protected]}
In this paper we present discrete event simulation models for two Storage Area Network designs. The first network is currently servicing the learning management system at the University of Auckland. The second network is an automatically generated Core-Edge design, proposed as a replacement for the first. We use our models to compare the performance of the two designs, and also to evaluate the performance of the second design under various component-failure scenarios. The models are developed using Arena, an off-the-shelf commercial simulation package, with the secondary purpose of determining the viability of using this software as an evaluation tool for Storage Area Network designs. Key words: simulation; storage area networks; core-edge topology
1.
Introduction
It is now standard practice in large organisations to centralise data storage. If managed carefully, this results in lower congestion on the local area network and improved data security. Data flow between the storage devices and the client servers (hosts) travels exclusively across a dedicated storage area network (SAN). The importance of this network’s layout is well-understood: “The design of the SAN determines the network’s ability to be reprovisioned for future growth, as well as impacting directly on the speed and reliability of data retrieval in the system” Walker et al. (2006). Traditionally the design of a SAN has been performed manually by consultants. Typical SANs in industry have in the order of 100 hosts and 100 devices and can take 3 or 4 consultants a number of weeks to design. Furthermore, the complexity of the problem means that most designs constructed by hand are not optimal (in terms of performance, reliability, and cost), and cannot be effectively evaluated by eye. Years of experimentation and practice have lead to a small number of reference topologies that now tend to be used. 1
The basic properties of these topologies are well understood by consultants and clients alike. A corollary of this is that any design that does not fit into one of these reference topologies is unacceptable to most clients (even if it is the optimal design). The problem of designing a SAN fits into the broader research area of Network Design. It is known to be NP-hard, but good heuristics can produce designs in a matter of minutes that are significantly better than manual designs, at least in terms of cost Ward et al. (2002). These heuristics take as input a set of hosts, devices and (deterministic) flows (each with an origin, destination, and size). Of course the traffic on the network is not deterministic so even if the resultant design fits a well-understood reference topology there is still a degree of uncertainty as to how well it will perform in practice. Furthermore, it is generally not possible to obtain the a priori flow data necessary to use this approach, so a design with full host-device connectivity is often the goal. Some progress has been made to generate optimal designs for this simplified (but still NP-hard) version of the SAN design problem (SANDP) using the Core-Edge topology Walker et al. (2006), but with the explicit flow volumes removed from the formulation the performance of the resultant design becomes even more uncertain. Clearly a tool is needed for evaluating how the SANs constructed from deterministically specified designs will perform in their stochastic environments. The obvious solution is to build a simulation. Having successfully developed a Core-Edge SAN design formulation and used it to plan the reprovisioning of a SAN currently being used by Cecil (the learning management system at the University of Auckland), our goal is more specific. We outline here the development of two discrete event simulations for (ethernet technology) SANs: one to evaluate the performance of the existing Cecil back-end SAN, one for the reprovisioned Core-Edge design that we are proposing as its replacement.
1.1
Background
A discrete event simulation of a computer network incorporating the full functionality of the network protocols must create and process many events. In addition to the complexities of the protocols, simply dealing with the traffic loads is in itself computationally demanding. Such a simulation requires both significant computer power and long run-times to produce useful results. One approach to reduce the run-time is to build a simple model for the complexities of the protocols. Cardwell et al. (2000) have built a steady-state TCP model and compared their 2
results to those obtained via simulation. The success of these analytical models vary: the model for connection establishment time performs well, but the performance of the model for the latency during connection establishment deteriorates as the packet loss rate increases. Another approach for reducing the computational requirement of network simulation models is to model the stream of packets as fluid, typically using differential equations. This allows only the average behaviour to be modeled and the startup effect is ignored. Nicol (2001) models TCP flows as fluid flows using both discrete events (such as packet loss) and continuous activity (such as undisturbed flows) to capture the average behaviours of the flows as well as startup effects. All flows are described in terms of piece-wise constant rate functions. Their values change when there is a change in the advertised credit window. Computations are only done in the simulation when there are rate changes, which significantly relieves the computational load. This paper, however, is theoretical - a complete simulation is yet to be produced. Although simulating network traffic as fluid flows allows much larger networks to be modeled than when using discrete-event simulation, a drawback of this approach is that it is difficult to gather information about flows on a per packet basis. In an attempt to address this issue Gu et al. (2004) have built a hybrid packet-and-fluid network simulator. Small packet networks feed packets into a larger fluid network, with the performance metrics being the packet drop probability, queue delay and the TCP throughput. The fluid network part of the hybrid model is a set of differential equations that represent the operation of TCP over time. Solving the fluid network part of the hybrid involves solving this set of differential equations at incremental points of time. Thus when solving for a certain point in time (say t1 ), the state of the network at any time before t1 is always available. Two versions of the hybrid model have been developed: one that assumes that the effect of the packet flows is negligible on the fluid network, another that takes the packet flows into account by transforming them into fluid flows that are then fed into the fluid network. These models perform well when the packet flow rates are low. Most of the work specific to SAN simulations uses fiber channel technology. There is, however, a small body of work done on simulating ethernet based SANs. Molero et al. (2000) have built a simulation using the CSIM language. The CSIM language consists of a library of procedures, functions and macros that allow programmers to extend the capability of the C language to build discrete-event simulation models. The simulation is built from the ground up; which includes code to create and handle events in the order required. The network 3
simulated is of an irregular topology with 6 switches, 2 servers and several disks. The work is done with the aim of proving that the CSIM language can be used to build such a model. Berenbrink et al. (2001) have created a simulation environment for SANs called SimLab. This environment was developed to aid the PRESTO project, which is a venture at the Paderborn University to develop a scalable and efficient SAN. SimLab is written in C++. The approach with SimLab is not to build working models of the devices involved in the network in their entirety (such as switches). Instead, the network connecting the servers and storage devices is modeled as a collection of “active routers”, which allows the functionality to be transferred from the servers to the network. The aim of this work is not to evaluate the performance of particular SAN designs, but rather as a tool to develop and evaluate distributed algorithms for the PRESTO SAN. Our aim is to build an accurate model of a switch and include this explicitly in a discrete event simulation of a SAN currently in use. We have chosen a widely used commercial package (Arena) as the programming language, in order to test its performance as a design evaluation tool. The SAN we have chosen to model is small (relative to the size we can automatically design using mixed-integer programming), but gives us a good initial understanding of the viability of this approach.
1.2
Summary
The rest of this paper is set out as follows: in section 2 we describe the Cecil Back-end SAN and the workings of its switches; in section 3 we present our reconfigured design of this network; in sections 4 and 5 we describe our simulation models; in section 6 we discuss our results; and concluding remarks are made in section 7.
2.
The Cecil Back-End Storage Area Network
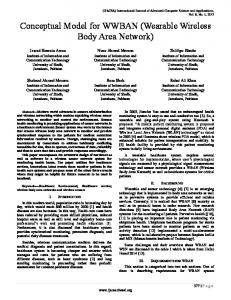
In this section we describe the Cecil Back-end SAN at the University of Auckland (shown in figure 1). The Cecil network was developed within the university itself as a means of providing a central place for students and staff of all faculties to share resources and information relating to courses. Previous figures put the number of courses the network supports at approximately 835 with 146220 students and 240 academics accessing the system Gardner et al. (2001). The network is one of the busiest within New Zealand and in 2000 it was experiencing more than three million hits per week. 4
DB5
DB3
Server A
DB4
Server B
AS1 AS3 Catalyst 3550-2
AS4 AS2 AS5 AS6 AS7 AS8
Catalyst 3550-1
WFA4
WFA5
WFA6
WFA7
WFA8
WFA9
Catalyst 3750
WFA10
WFA11
WFA12
WFA13
WFA1
WFA2
WFA3
WF1
WF2
Figure 1: The Cecil Back-end SAN
The Database Servers store the course-related data that is accessed by the students and staff. Database DB3 is read-only. All updates are carried out on the master database, DB4. Databse DB5 is the backup database for DB4. Updates are sent periodically from DB4 to both DB5 and DB3, keeping them up-to-date on changes that have been made. The Citrix Servers (AS1 - AS8) are used exclusively by academic staff to update and add course-related resources and information. Cecil Web Server Farm A (WFA4 - WFA13) and Cecil Web Farm B (WFA1-WFA3, WF1 and WF2) are used by students to access course resources and information. These web farms are known collectively as the Cecil Servers, and are partitioned into three groups; • Group 1: WF1, WF2 • Group 2: WFA1, WFA2, WFA3, WFA11, WFA12 • Group 3: WFA4, WFA5, WFA6, WFA7, WFA8, WFA9, WFA10, WFA13 All the servers run network load balancing software so that each server within a group experiences equal loading. Group 3 servers, however, are utilised more heavily than those in groups 1 and 2. The load balancing software employed by the Cecil servers requires each server to carry out periodic (per second) broadcasts to all servers within that group, and this broadcast traffic also uses the back-end network. The Citrix servers also run load balancing 5
software within the group. However the load balancing technique employed by the Citrix servers does not send packets through the back-end network. Table 1: Summary of all possible flow paths in Cecil Source DB4
DB3
AS1 to AS8 WFA1 to WFA3, WFA11, WFA12
WFA4 to WFA10, WFA13
Server A & Server B WF1 and WF2
Destination Updates to DB3 Updates to DB5 All Cecil servers All Citrix servers Server A and Server B All Cecil servers All Citrix servers Server A and Server B DB3 DB4 DB4 DB3 Broadcast flow to each other DB4 DB3 Broadcast flow to each other DB4, DB5 DB4, DB5 Broadcast flow to each other
All the Citrix and Cecil servers access either DB4 (to read or write data) or DB3 (if only data reading is required). DB5 is the backup master database and is not accessed by users, so the only data flows into DB5 are updates from DB4. There is no flow between a Citrix server and a Cecil server. All links in this system are duplex gigabit links (i.e. transmission speed of 1,000,000,000 bps in both directions). Table 1 shows a summary of the flow paths possible in the Cecil network.
2.1
Cecil’s Switches
All the switches in the network are from Cisco’s Catalyst range. There are two Catalyst 3550 switches and one Catalyst 3750 switch. This section gives a brief description of the operation of these switches. More detailed information can be found at the Cisco website Cisco (2005a). Cisco’s Catalyst switches include many features that are of use to network administrators when setting up their systems. However the only features discussed here are those that are relevant to the simulation involved in this research. Catalyst 3550 and 3750 switches are 6
Ethernet switches that use the store and forward method for arriving packets Dealtime (2005). They can handle both gigabit and non-gigabit ethernet links. Figure 2 shows the structure of a catalyst 3550 switch Cisco (2005b). The satellites consist of a single port or a group of single gigabit ports. The number of satellites in a switch and the number of ports assigned to a satellite can vary and are determined by the network administrator. Notify Ring Satellite
Shared Memory Fabric
Radial Channel
Figure 2: Schematic structure of Catalyst 3550 switch (source: pp2,Cisco (2005b))
The satellites are responsible for receiving and sending packets and also for making the forwarding decisions. Before the forwarding decision is made the satellite may also carry out some other quality of service activities, such as classifying or prioritising the packets, but the switches in the Cecil back-end network are not configured for these functions. Once the satellites make the forwarding decision for the arriving packet, the Notify Ring is used to send a message to the satellite in charge of the requested output port, signalling that it has a packet to transmit. In the mean time the ingress satellite uses its Radial Channel to send the packet to the Shared Data Buffer to be stored until the output port is able to take it for transfer. The Notify Ring is the means by which the satellites are able to communicate with each other. It is unidirectional and operates at 800 Mbps. With a size of 10 bytes per notification signal the ring can transfer up to 10 million frames per second between satellites. If a packet 7
is to be sent to more than one output port then the single notification signal will be used to warn all required satellites of a packet their ports must transmit. Each satellite has a Radial Channel to transfer packets between its ports and the shared memory buffer. The Channels operate at 200 Mbps each way (to and from satellites). Before transferring the packet to the shared buffer, the satellite will break the packet into smaller, fixed size cells. Having fixed size cells makes managing the memory buffer easier. All packets using the switch will pass through the 4 Mb shared-data buffer. This buffer is able to reserve a minimum space for each port and also allow a port to use unreserved buffer space if its own reserved space is filled. A packet that is to be sent to more than one port is only written to memory once and a copy of it is taken by each port that is to transmit the packet, thereby saving space by not having to store the same packet at several locations within the buffer. In the event that the memory fills up, the switch will send a ‘pause frame’ to the sending devices. When a sending device receives such a frame it will halt sending frames to that switch for a predetermined amount of time. Upon receiving a notification that it has a packet to transmit, the egress satellite will retrieve the packet from the common memory buffer via its radial channel and then transmit it out via the output port link. If the output port is busy then the notification will be stored in one of four queues until the port is free to transmit the packet. Before transmitting the packet into the network however, the egress satellite will rebuild the packet from its cells. Each output port has 4 queues attached to it, allowing for quality of service functionality. As mentioned earlier, Cecil does not apply quality of service and so in this network all queues are of equal importance, being managed in a round-robin manner. Each queue is served on a FIFO (First In First Out) basis.
3.
The Proposed Cecil Back-end SAN Design
The current Cecil back-end SAN is configured with three switches in series (see figure 1). Thus if a single switch fails the network fails. Furthermore, the current design does not allow for future reprovisioning, to support extra traffic if future demand grows. Walker et al. (2006) present four mixed-integer formulations for designing Core-Edge SANs with multiple distinct paths between every host-device pairing, and adapt one of these to produce a reprovisioned design for the Cecil back-end. The proposed design is more reliable and scalable than the current design, and should perform better. If a component (that is, a switch or a link) fails 8
the network does not fail, as every flow using that component has a second available path that does not use it. Also, ensuring at least two distinct paths for each host-device pair allows for load balancing and reduces the likelihood of severe bottlenecks. The proposed design is shown in figure 3. This configuration requires the procurement of two new switches (both Catalyst 3750 switches). The core of this design consists of the two 3550 switches, with the three 3750 switches used in the edge. Each link in the network is still a 1 gigabit per second link. DB3 DB4
Switch 1
DB5 WF1 WF2 WFA1 WFA2
Switch 4
WFA3 WFA4 WFA5 WFA6 WFA7 WFA8
Switch 2
WFA9 WFA10 WFA11 WFA12
Switch 5
WFA13
AS1 AS2 AS3 AS4
Switch 3
AS5 AS6 AS7 AS8 Server A Server B
Figure 3: Proposed core-edge design for Cecil
It is clear immediately that the proposed design can be easily scaled (by adding additional edge or core switches) and is more reliable than the current configuration (with dual disjoint paths between every host-device pair). However, this design has been produced using deterministic inputs with the aim of total host-device connectivity (irrespective of relative traffic density on the various paths in the network). We expect it will perform better than the current configuration, but need to build a stochastic simulation to verify this.
9
4.
A Discrete Event Simulation for the Cecil Back-end SANs
We have chosen to build a discrete event simulation for the current and proposed SAN designs using Arena, an off-the-shelf commercial simulation package. The main components of each of the networks were modeled modularly as Arena submodels. We used Arena entities to model the traffic across the network as packets (rather than streams of bits, or complete messages).
4.1
Modeling the Servers and Databases
The servers and databases are considered in two groups: those which send broadcasts across the back-end SAN (the Cecil servers), and those which do not (the databases and Citrix servers). The features of these end-devices, such as storage capabilities and processing speeds, are independent of the network layout, and so are excluded from our simulation model. The only features pertinent to the network itself are the rates at which each end-device supplies and demands data. Therefore the end-devices are all modeled as simply creating and receiving traffic in the form of packets. The traffic creation rate at each device is calculated using the historical outflow data. Retransmissions and acknowledgments only occur at end-devices, and we are not explicitly modeling the mechanisms that produce these types of flows. However since the outflow rates used to produce the traffic in the models include any retransmission and acknowledgment flows, our modeling is taking these flows into account implicitly. Cecil Servers These servers send “normal” traffic to databases, as well as broadcast traffic to servers within their grouping. The normal traffic is being created all the time while broadcast traffic is only created once per second at each device. There are distinct Arena create modules for the two types of packets. Upon creation all packets are assigned attributes (time of creation, packet size, source, destination etc) and then placed in a FIFO queue to await the availability of the appropriate link. Upon arrival at the destination port the procedure depends on the packet type. With the broadcast packets it is possible that the same packet may arrive more than once because of the way broadcasts are handled by the switches. However each server should only receive one broadcast packet from each of the servers in its group each second and must reject repeat 10
packets from the same source. So when a broadcast packet arrives the receiving device will check whether it has already received a broadcast packet from that source device in that second. If it has then the packet will dropped, if not the packet will continue forward. From that point forward, broadcast packets and normal packets are treated the same; their arrivals are recorded by writing any important attributes (such as arrival time, creation time, source, device, etc) to a text file. They are then discarded as they are no longer required. Figure 4 shows the layout of a Cecil server (i.e Cecil server submodel) and gives a general overview of the actions of modules used in the submodel. (The flow of logic in Arena models is always left to right.) Databases and Citrix Servers These are all the devices that only have “normal” flows (i.e. between a server and a database) and do not have broadcast flows. They are exactly the same as the Cecil servers except they do not include the section of the model that deals with creating broadcast traffic or the section that deals with arriving broadcast packets.
4.2
Modeling the Links
Each link in the system is modeled as two resources (one operational in each direction). When an entity is to be transferred across a link, it will first have to seize the appropriate link resource and then undergo a delay to represent the transfer time across the link, and finally release the link. In the model, the links are only able to transfer one packet at a time (in each direction), while in the real system a link may have more than one packet being transmitted at a time. We performed tests to compare the results of a model that split the packets into bytes for transfer across links against a model that transfered the packets in their entirety. The first model would allow the links to have the data of a second packet on a link as the tail of the previous packet completed its transfer, while in the second model a packet would have to complete its transfer before another could begin. We found that there was no significant difference in results (through-time and waiting times were considered), which was expected as a switch waits for the whole packet to arrive before it begins checking it and switching it to the output port. However the first model took significantly longer than the second to run: the “non-splitting model” took one and a half minutes to run 60 seconds of simulated time while the “splitting model” had only managed 0.7717 seconds of simulated time after 1 hour
11
Figure 4: Structure of a Cecil server in the Arena models 12
and 30 minutes of running. Therefore the decision was made to model the links handling only one transfer at a time in each direction.
4.3
Modeling the Switches
Our model of a switch is separated into three areas: the Input ports where the packets arrive and the switching decisions are made, the Output ports where the packets are switched to for transfer out of the switch, and the Memory. The memory is the shared memory buffer where all packets arriving at the switch are stored before they can be switched to the output port for transfer out. Input Ports Upon arrival at the input port of a switch each packet releases the link resource used. The input port can deal with only one packet at a time so if another arrives while one is being processed it must be dropped. If the port is free then the packet will seize the input port resource and the forwarding decision will be made by locating the packet’s “Destination ID” attribute in the switch lookup table. (If it is a broadcast packet then it will be bound for more that one output port.) Once the required output port has been identified, and before the packet can be transferred to memory, the input port must check that there is sufficient memory available to store the packet. It will first try to use the memory reserved for the output port required, but if that is full then the memory pool is used. If sufficient memory is available the packet will continue on, otherwise the packet is dropped. The input port will create a notification signal to be sent to the affected output port(s) that the port(s) have a packet to transfer out. This notification signal is sent via the notify ring and if the ring is busy the notification must wait in a queue for its turn. Notification signals from all input ports must use the same notification ring. A similar modeling simplification as is used for the links was made for the notification ring (i.e. the packets are not split into bytes for transmission). Finally the input port will use its Radial Channel to transfer the packet to the memory for storage so that the output ports can access and retrieve the packets. The switches in the model were also designed to discard packets if they were in the system for too long (as would happen in reality). This only affected broadcast traffic due to the way switches handle broadcast traffic. Figure 5 provides an overview of the functions of various groups of modules that make up the input port. Output Ports 13
Figure 5: Switch inport structure in the Arena models
14
The output ports inspect each notification traveling along the notify ring to check whether it is being notified of a packet it must switch. If the notification does pertain to that port, it makes a copy of the notification and then releases the original so that it can travel to other output ports. If the output port is not currently busy with another notification then it will locate the required packet in the memory so that it can be transferred from the memory to the output port. However if the output port is busy with another notification then the new notification will be placed in one of the four queues each port has available. The queues are served using Weighted Round Robin, although in Cecil the queues are weighted equally. Once the packet is found in memory it is transferred to the output port’s radial channel to be switched to the output port. The Notify Ring operates at a faster rate than the Radial Channel and the notification signals are much smaller than the packets, so the output port is often aware of a packet it has to transfer out before the packet has been transferred to the memory by the input port’s Radial Channel. This means that the output port may have to check the memory several times for the presence of the packet it requires. When the packet is found and transferred out, the associated memory is released after all output ports that need to transfer the packet have copied it from memory. Once at the output port the packet seizes the link out and is transferred out of the switch. Figure 6 shows the logic of the switches’ output ports. The models have separate “input ports” and “output ports” for each real physical port since the physical port’s input actions are distinct from its output actions. The model’s input port and output port combination is equivalent to the real situation of having one port which carries out two distinct, disjoint actions. The Radial channels that are used by catalyst switches to send packets between the satellites and the shared memory have a 200 Mbps capacity in both directions. Thus splitting a physical port into an “output” port and an “input” port in the model, and having a separate radial channel between each of them and the memory is equivalent to the real situation. Shared Memory The Shared memory is where all packets are stored between being transferred from an input port to the appropriate output port. All transfers to and from memory are made via Radial Channels. Lookup Tables In most networks the lookup tables are initially constructed at startup and then the switches continuously exchange information about the network in order to update the optimal 15
Figure 6: Switch outport structure in the Arena models
16
path to each destination. In the Cecil network there is only one path for each host-device pair, so the lookup tables in the simulation are static tables that are loaded from an input file at the start of the simulation. The structure of the full Arena model is shown in figure 7. Each node represents an Arena submodel.
Figure 7: Overview of current configuration model
5.
The Discrete Event Simulation for the Proposed SAN Design
For the most part the proposed configuration layout will utilize the Arena submodels that were built for the current configuration model (in a different layout). This is essential for ensuring that when the layouts are compared, any difference in performance between the two models arise from the difference in the physical layout and not due to any differences in the modeling of the devices. However, the structure of the proposed layout requires some aspects to be changed or added in order to make the model work, and these differences are discussed here. If a feature of a device is not explicitly discussed in this section it is because that feature remains unchanged from its description in section 4. Naturally all the input data fed into the proposed model (such as the arrival rate of packets and the destination distributions at each end device) are the same as those used in the current layout model.
17
5.1
Modeling Databases and Servers
In the current configuration each end-device has only one link to the network, but in the proposed configuration each end-device has two links to the network. Each link incident to an end-device in the proposed network is connected to a different switch. Thus we must decide which link a device will use when it sends packets out into the network. Hosts and devices in a network are not aware of the optimal path to use for any destination (they are only able to check whether links connected directly to them are operational). They will, however, attempt to load balance between those links that are operational. Therefore, in our model, after packets have been created and been assigned attributes (such as size and destination device), they are placed in one of the two link queues in a round robin manner. Figure 8 highlights the differences between the structures of the hosts in the current configuration model and the proposed configuration model. Note that incoming traffic also arrives along two different links at each end device in the proposed configuration model but this does not require any significant change in the logic of the modeling (only a doubling of modules).
5.2
Modeling the Switches
Lookup Tables In the current configuration there was only one path between any pair of devices, but the proposed layout has multiple paths between the pairs of end devices. A switch, however, has only one preferred output port for each destination (with the exception of broadcasts). In a real system the choice of output port is made based on the routing metric used in the network. We have chosen the simplest such metric for our simulation, which is the number of hops. This means that in the simulation model if a device is directly connected to an edge switch then the output port to use for that destination in the switch’s lookup table will be the output port to which the device is connected. However if a device is not directly connected to the switch then the switch will have to send the packets for that destination to a core switch. The layout is such that when a core switch is to be used, the number of hops taken with either switch is the same; yet a choice between the two (Switch 4 or Switch 5) must be made. Since they both result in paths of equal length, the choice is made randomly, although an attempt was made to ensure some level of balance in the amount of flow directed to each core switch. 18
Figure 8: Structure of a Cecil server in the proposed configuration model
19
The same is true when building the lookup table for the core switches. There are two paths of equal hop length to each destination (via separate edge switches), so a choice was made randomly but with some attempt to balance the load to each switch. While the models do not include the messages the switches send to each other in order to redirect flows in case of network congestion, the ability to redirect flows does need to be included in the simulation of the proposed model as this is one of its key advantages. This is achieved by making each switch aware of the alternative output port to use for each destination that is not directly connected to it. An alternative path for devices directly connected to a switch was not provided as it was not envisaged that the level of congestion seen would be such that a move to stop using direct links would be required, although this ability can easily be included in the model if need be. The mechanism to redirect traffic to the alternative port is as follows: if the number of packets waiting at the current preferred output port exceeds a level n, (which is a parameter that can be changed) use the alternative output port. Then update the lookup table so that the previous alternative output port becomes the preferred output port and the previous preferred output port becomes the current alternative. Inter-Switch Links Each connection between edge and core switches consists of two 1 gigabit links. In the proposed model “link 1” between two switches is always the preferred link (as opposed to “link 2”). However if its loading exceeds a threshold (which is an alterable value) then link 2 is used. Figures 7 and 9 show the layout of the current configuration model and proposed configuration model respectively. In the current configuration model Switch 1 and Switch 2 are Catalyst 3550 switches and Switch 3 is a Catalyst 3750 switch. In the proposed configuration model Switch 1, Switch 2, and Switch 3 are all Catalyst 3750 switches, and Switch 4 and Switch 5 are Catalyst 3550 switches. The structure of the full Arena model for the proposed SAN design is shown in figure 9. Each node represents an Arena submodel.
6.
Results
In this section we present the results for our simulation models. We briefly discuss our calibration and validation process, before comparing the performances of the two SAN designs. 20
Figure 9: Overview of proposed configuration model
We then analyse the performance of the proposed design under various failure scenarios, benchmarking against the fully operational current and proposed designs. The results we present here are for ten repetitions of the simulations, each for a 10 second period. The (real-time) run time for the current configuration model is in the order of 10 hours, whereas the run times for the proposed configuration model (and the associated failure scenarios) are in the order of a day.
6.1
Calibration and Validation of the Simulation for the Cecil Back-end SAN
As mentioned in section 1, for most systems individual flows are not monitored. This is also the case for the Cecil back-end SAN. The only historical data we have are the traffic levels through the various ports of the switches. As there is only one path for each hostdevice pair in the network, however, we are able to make reasonable assumptions about the data flow levels for each host-device pair. Our estimates have been determined using linear programming, with the objective of minimising the root mean squared error between the historical traffic levels at each switch port and those determined by the variables in our 21
formulation. To validate the model we assigned the appropriate generation rates for each different flow at its source, and compared the resulting traffic rates terminating at the host and device ports. Of course it was of no surprise that the simulation traffic levels were very close to what had been seen historically. It was, however, important to check that the model could support these traffic levels, as we had been assured by the Cecil team that the network had sufficient bandwidth and memory to cope. We were able to verify that no packets were being dropped.
6.2
Performance Comparison of the Current and Proposed SAN Designs
We performed Welch t-tests on the traffic through-times for all host-device pairs. In almost all cases the proposed network had average through-times that were shorter to a statistically significant level than the average through-times for the current network, the only exceptions being the few cases where the traffic passed through only one switch in the current configuration (such as traffic between WFA4 and DB4). The overall average was between 5.35e-05 and 5.42e-05 seconds less for the proposed network than for the current network (95% confidence, with p-value less than 0.01). The actual mean through-times were 2.98e-04 seconds for the current SAN design, and 2.44e-04 seconds for the proposed design (an 18% reduction). We measured the switch utilisation in the two designs as this identifies possible areas of congestion in the network, as well as indicating where the networks are likely to fail. Figures 10 and 11 show the switch utilisation for the two designs. Clearly all switches in the current configuration are utilised to higher degree than any of their counterparts in the proposed design, with switch 1 being particularly overtaxed. We also monitored the utilisation on the inter-switch links, as these loads are the hardest to predict yet these links tend to be the most highly utilised. Again, the utilisation for the components in the current network design tended to be higher than for their counterparts in the new design. Figures 12 and 13 show the amount of time that the inter-switch links were busy for each 0.1 second interval in the current and proposed designs respectively.
22
Figure 10: Utilization of switch notify rings in the current configuration
Figure 11: Utilization of switch notify rings in the proposed configuration
23
Figure 12: Inter-switch link usage in the current configuration
Figure 13: Inter-switch link usage in the proposed configuration
24
6.3
Evaluation of the Performance of the Proposed SAN Design under Component Failure
In the current configuration, if a component fails the network fails. In the proposed configuration, however, there are always two distinct paths for every host-device pair, so we were able to test this network’s performance under component failure. We chose to test the following four scenarios: • Scenario 1: The failure of an edge link (i.e between a device and an edge switch). The link between DB4 and Switch 1 was chosen as DB4 is the busiest device, and therefore the failure of a link attached to this device would have the greatest impact. • Scenario 2: The failure of a core switch. Switch 4 was chosen as it had the higher utilization of the two core switches. • Scenario 3: The failure of an edge switch under low utilization (Switch 2). • Scenario 4: The failure of an edge switch under high utilzation. Switch 3 was chosen as the switch to fail for this scenario. There was no point in modeling the failure of a core-link as there are two between every core and edge switch, and these are so lowly utilised that only one is needed to serve the current traffic levels. We compared the performance of the network under each of these scenarios to both the current configuration and the fully-functioning proposed configuration. We found statistically significant differences in all cases (95% confidence, p-values less than 0.01). In the worst case a failure resulted in an average through-time about 11% greater than for the proposed network, but still around 8% better than for the current configuration. The average through-time in the fully-functioning proposed configuration was: shorter by between 8.35e-06 and 9.02e-06 seconds than for scenario 1; shorter by between 7.14e-06 and 7.82e-06 seconds than for scenario 2; longer by between 1.52e-05 and 1.59e-05 seconds than for scenario 3; and shorter by between 2.70e-05 and 2.77e-05 seconds than for scenario 4. The reason for the anomaly in scenario 3 is that all flow is now forced to pass through either Switch 1 or Switch 3, both of which are connected directly to DB4. As DB4 is the busiest device (and all flow into it will no longer pass through the core) this means that the failure of switch 2 results in an improvement in average through-times (at the expense of switch 25
utilisation). Of course we could take advantage of this discovery in the fully-functioning network by adjusting our routing policy for flows destined for DB4. The average through-time in the current configuration was: longer by between 4.48e-05 and 4.55e-05 seconds than for scenario 1; longer by between 4.60e-05 and 4.67e-05 seconds than for scenario 2; longer by between 6.90e-05 and 6.97e-05 seconds than for scenario 3; and longer by between 2.62e-05 and 2.69e-05 seconds than for scenario 4. The worst case switch usage level rose as high as for the current configuration in scenarios 1 and 4, but remained significantly lower for the other two scenarios. In all four scenarios the inter-switch link utilisation was far lower than for the current configuration (around half the highest level).
7.
Conclusions
We have presented discrete event simulations of two designs for an existing real-world SAN, and used them to compare the designs’ performance. The first design is the current configuration of the Cecil Back-end SAN, and the second design is a proposed core-edge reconfiguration of the same network, generated automatically using mixed-integer programming. The results from our simulation runs suggest that the proposed reconfiguration outperforms the current network, even when one of its components fail. The simulations have been built using Arena, an off-the-shelf simulation package. A secondary aim of this work was to determine the viability of using discrete event simulation with such a package as an evaluation tool for automatically generated designs. Regrettably such an approach does not seem promising: the run-times for ten replications of a 10 second simulation on these relatively small networks was in the order of 10 and 24 hours. It seems probable that a discrete event simulation of a large computer network including the level of detail that we have outlined here would be too computer intensive at present.
Acknowledgments This work was made possible by a grant from the University of Auckland Vice Chancellor’s University Development Fund. We would also like to thank Ken Ho-Kee Kan and Nicholas Jones from Cecil for their assistance.
26
References Berenbrink, P., A. Brinkmann, C. Scheideler. 2001. Simlab - a simulation environment for storage area networks. 9th Euromicro Workshop on Parallel End Distributed Processing. 227–234. Cardwell, N., S. Savage, T. Anderson. 2000. Modeling TCP latency. 19th Annual Joint Conference of the IEEE Computer and Communications Societies. 1742–1751. Cisco. 2005a. www.cisco.com. [Online]. Cisco. 2005b. Catalyst 3500 xl switch architecture. www.cisco.com/en/us/products/hw/ switches/ps637/products white paper09186a00800925df.shtml. [Online]. Dealtime. 2005. http://www.dealtime.com/xPF-Cisco Catalyst 3550 24 WS C3550 24 EMI. [Online]. Gardner, L., D. Sheridan, D. White. 2001. Computer supported learning. a large-scale, web-based learning and assessment system to support flexible education. 34th Hawaii International Conference on System Science. 1–9. Gu, Y., Y. Liu, D. Towsley. 2004. On integrating fluid models with packet simulation. 23rd Annual Joint Conference of the IEEE Computer and Communications Societies. 2856– 2866. Molero, X., F. Silla, V. Santonja, J. Duato. 2000. Modeling and simulation of storage area networks. International Symposium on Modeling Analysis and Simulation of Computer and Telecommunications Systems 2000 . 307–314. Nicol, David M. 2001. Discrete event fluid modeling of TCP. Winter Simulations Conference. 1291–1299. Walker, C.G., M.J. O’Sullivan, T.D. Thompson. 2006. A mixed-integer approach to core-edge design of storage area networks. Computers and Operations Research, In Press, Corrected Proof. Available at http://www.sciencedirect.com/science/article/B6VC5-4HVW8MB3/2/89985fb492c0876b37c490b925e39dee. Ward, J., M. O’Sullivan., T. Shahoumian, J. Wilkes. 2002. Appia: automatic storage area network fabric design. Conference on File and Storage Technology (FAST’ 02). 203–217. 27