tures [5]: How accurately is a user able to detect his/her position in the virtual ... headphones, with and without head-tracking are accept- able but not preferred).
DAGA 2017 Kiel
Evaluation of Interactive Localization in Virtual Acoustic Scenes Daniel Rudrich, Franz Zotter, and Matthias Frank Institute of Electronic Music and Acoustics University of Music and Performing Arts Graz, Austria Email: {rudrich, zotter, frank}@iem.at Introduction
Procedure
Technologies for virtual sound field reproduction and motion tracking enable accessing virtual acoustic scenes with the increased sensation of being there (see Fig. 1). In such a virtual acoustic environment, one can move more freely as a virtual listener than as a human in the physical world, e.g. one can stand behind the drummer during a concert. Apart from the typical requirement of high audio quality [1, 2, 3], interactive localization is an important feature. The experience only feels convincing to listeners if the localization stays consistent during the time they explore the virtual scenery. In this paper, this consistency is understood as interactive quality [4]. We break its quality aspect down into two quality features [5]: How accurately is a user able to detect his/her position in the virtual scene (self localization)? How well is a user able to determine the location of sound objects in the virtual scene (object localization)? We propose a set of interactive listening tests for evaluation of variable-perspective virtual acoustic environments in respect of accuracy and speed of both self and object localization. As a case study for the proposed quality features we compared virtual acoustic environments based on either variable-perspective room simulation or processing of distributed-microphone recordings.
The virtual scene under test should evoke several (at least three) static auditory objects with dispersed virtual positions. The layout of the scene is presented to the subject during the experiment. The subject’s virtual position gets chosen out of a predefined set of desired positions. Preferably, the rendered scene is played back via loudspeakers to prevent binaural effects (incompatible HRTFs, front-back-confusion) and to ensure a static scene during head-rotation. Therefore, the subject sits in the middle of a 3D loudspeaker setup (in case rendering does not support loudspeaker playback, playback via headphones, with and without head-tracking are acceptable but not preferred). The user’s task is to respond by indicating his or her position in the virtual scene with the aid of the given scene layout. This can be done with a GUI on a tablet (reporting on paper/map is also acceptable). For each trial, the response in terms of x/ycoordinates and the response time is stored. The virtual position of the next trial is selected randomly out of the predefined set.
vl
Measures and Data Analysis We propose the following measures for statistical analysis of different rendering methods. Absolute Mismatch: With the coordinates of the target positions ri and the position r reported by the user, the mismatch mi of each trial i can be calculated as follows: mi = r − ri . (1)
vso2 vso3
vso1
This measure provides information about a possible distortion of the scene. The absolute mismatch mi = kmi k can be used to evaluate the reproduction error with a statistical significance test (e.g. ANOVA) for different rendering methods.
Figure 1: Virtual listener (vl) moving freely within a virtual acoustic scene composed of virtual source objects (vso).
Variance: The variance of the reported positions r describes the precision of self-localization irrespective of a possible distortion. It can be obtained by calculating the trace of the covariance matrix of m (mismatch):
Self-Localization Test The self-localization test evaluates the variableperspective renderer’s ability to produce auditory objects localized according to a given scene layout. This is done by examining how well a user is able to determine her or his virtual position within the virtual scene. Although the cognitive understanding of the scene can be challenging to the user, the time to respond and the deviation from the target position provide information of the renderer’s performance.
σ 2 = trace(Cov(m)).
(2)
An F-test can be used to compare different rendering methods regarding their precision in localization. Response Time: The response time t provides information about how long it takes the user to derive her or his position in the virtual scene. The means of different rendering methods can be compared with an ANOVA.
279
DAGA 2017 Kiel
Object-Localization Test The object-localization test evaluates the consistency of the localization while interactively walking through the virtual scene. We evaluate this quality feature under the assumption that finding an auditory object’s position within the scene is more precise and faster if the localization is consistent.
5.5 5
Procedure 4.5
For the object-localization test, the virtual source objects can preferably be muted individually and/or relocated to one of the other positions (e.g. with the help of measured transfer functions). Hereby, only one virtual source object is active in each trial. At best, the same object is used at different positions to avoid interference and dependency on the audio signal. The playback has to enable an interactive walkthrough within the virtual scene. This can be achieved by a head/location-tracking of the user’s position controlling interactive playback via headphones. Alternatively, an omni-directional treadmill could be used as an interface controlling interactive loudspeaker playback. The user explores the scene with the task to find the location of a specified auditory object. The user indicates the completion of the task by acclamation or pressing a button on a remote control. During each trial the user’s trajectory is stored as well as the reported position and the response time. To reduce learning effects, the virtual scene should be randomly rotated and shifted prior to each trial.
4 3.5 3 2.5 2 1.5 1 0.5 0 0
1
2
3
4
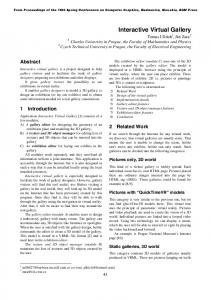
Figure 2: Layout of the virtual scenes including the four virtual source objects, several microphone arrays depending on either object- or self-localization test, and the positions for the self-localization task.
Data Analysis and Measures Absolute Mismatch and Variance: These two measures can be calculated and analyzed using the above mentioned methods of the self-localization task.
Direct Auralization (REF) As a reference rendering method, the sound sources are auralized directly with direction and distance information. Additionally, first and second order image-sources as well as a static reverb are added to create a basic room impression. This method is expected to perform best.
r30 : This measure represents the radius around the reported position r within which the user is located 30% of the response time t. We observed that in most cases the user fine-tunes her or his response within this radius. It can be obtained by analysis of the trajectories. However, due to a possible dependency on the user’s willingness to give a refined response, r30 should be considered cautiously.
Virtual Scene and Rendering Methods
Vector-based Intensity Panning (VBIP) Within this rendering method, the scene is triangulated using the microphone array positions. The selection of the active triangle depends on the virtual listeners position. The 1st -order Ambisonic signals of the three corresponding microphone array recordings are cross-faded with a VBIP-weighting [8] and decoded to four virtual loudspeaker objects (VLO) around the virtual listener (front, back, left, right). This represents a quite basic approach with a low performance expectancy.
The virtual scenes of the listening experiments consist of four virtual source objects, which are either auralized directly or virtually recorded with a varying number of microphones, see Fig. 2. The transfer functions from the sources to each microphone were simulated with McRoomSim [6]. Convolution and playback were carried out in the DAW Reaper [7] with an insertion of the following scene rendering methods:
Acoustic Scene Playback (ASP) This rendering method is a more elaborated variable-perspective reproduction of recorded scenes. For each microphone a VLO is created with a cardioid directionality and a predefined distance to the center of the corresponding array. Delay and gain of each VLO depend on the virtual listeners position. A more precise description can be found in [9]. We expected this method to perform better than VBIP.
t30 : Time the user finally crossed the r30 -circle around the reported position. This is used as a fine-tune compensated time measure under the assumption that finetuning happens after the r30 -circle is crossed.
Case Study
280
DAGA 2017 Kiel
All objects (virtual source objects, image sources, and reverb for REF; VLOs for the recording based methods) are encoded in 5th -order Ambisonics to enable both loudspeaker and head-tracked headphone playback [10].
5.5 5 4.5
Procedure 4
The self-localization task used four different sources: mandolin, violin, cello, and bongos1 . VBIP and ASP employed a homogeneous distribution of microphones in order to not emphasize any specific direction or area. Playback employed a 24 loudspeaker hemisphere in the IEM Cube using AllRAD [11]. Loudspeakers were preferred over headphones to provide natural listening conditions and to avoid artifacts due to possible HRTF mismatch and tracking latency. Each of the nine listeners was sitting in the center of the hemisphere and indicated her or his estimated virtual position within the scene on a tablet computer that showed the scene layout. The eight self-localization positions were evaluated twice for each of the three rendering methods resulting in 48 trials.
3.5 3 2.5 2 1.5 1 0.5
For the object-localization task, only the mandolin was active and was assigned to each of the four positions in random order. These four positions differed in the number of microphone arrays positioned around the source, as shown in Fig. 2. This variation facilitated the investigation of the influence of the number of arrays on the performance. The user’s initial position was randomly assigned to one of the three remaining positions. His or her head position and orientation was tracked with a Vicon camera tracking system. The stored trajectory was sampled with 10 Hz. In order to enable free movement of the user binaural headphone playback was employed. The binaural signals were generated by decoding to a regular ring of 12 virtual loudspeakers and subsequent convolution with the corresponding HRTFs. The ten participants reported their final position with pressing a designated button on a remote control. For each rendering method each of the four source positions was evaluated starting from three different initial user positions resulting in 36 trials.
0 0
0.5
1
1.5
2
2.5
3
3.5
4
4.5
Figure 3: Means, their deviations (slid lines) from the true virtual positions (black dots) and confidence-regions of the self-localization experiment four the three rendering methods.
45 40
2
35 30
1.5
25 20
1
15 10
0.5
5
All participants were staff of the Institute of Electronic Music and Acoustics and experience in spatial audio.
VBIP ASP REF
VBIP ASP REF
VBIP ASP REF
VBIP ASP REF
0 VBIP ASP REF
0
Figure 4: Means and confidence intervals of t, r30 , t30 and absolute mismatch m of the self-localization (SL) and objectlocalization (OL) task for each rendering method.
Self-Localization Results Figure 3 shows the results of the self-localization tasks. As expected, the scattering of the reported positions is smallest for the reference rendering method (REF, black solid line). For VBIP (gray, dashed) the confidence regions are the largest and overlapping, indicating a higher uncertainty. The performance of the ASP method lies in between. This behavior was also confirmed by an FTest (see Table 1). Significant differences were found for each pairwise comparison of the rendering methods, with REF performing best. The same significant ranking yielded the analysis of the response time and the absolute mismatch (see Fig. 4).
Table 1: Results of the F-Test for same variance for the selflocalization (SL) and object-localization (OL) task. p-values are Bonferroni-Holm corrected. Significant values are printed in bold.
1 taken from the song Rachel by Southern Sirens available at http://www.cambridge-mt.com/ms-mtk.htm
281
task
H0
dF
F
p
SL SL SL OL OL OL
σV BIP ≤ σASP σV BIP ≤ σREF σASP ≤ σREF σV BIP ≤ σASP σV BIP ≤ σREF σASP ≤ σREF
159 159 159 107 107 107
2.68 8.70 3.24 2.47 3.21 1.30
< 0.001 < 0.001 < 0.001 < 0.001 < 0.001 0.089
DAGA 2017 Kiel 5.5
5.5
5.5
5
5
5
4.5
4.5
4.5
4
4
4
3.5
3.5
3.5
3
3
3
2.5
2.5
2.5
2
2
2
1.5
1.5
1.5
1
1
1
0.5
0.5
0.5
0
0 0
0.5
1
1.5
2
2.5
3
3.5
(a) VBIP
4
4.5
0 0
0.5
1
1.5
2
2.5
3
3.5
4
(b) ASP
4.5
0
0.5
1
1.5
2
2.5
3
3.5
4
4.5
(c) REF
Figure 5: Results of the object-localization experiment. Black points represent the target positions, solid ellipses show confidence regions of the reported positions, dashed circles represent the r30 value for each position. Gray circles in the background represent the users’ normalized duration of presence.
References
Object-Localization Results Figure 5 shows the means of the reported final positions with their deviation from the target positions. The r30 circles (dashed) fairly represent the region with the highest concentration of presence. The scattering is highest for the VBIP method and lowest for REF. The results of the F-Test (see Table 1) as well as those of the analysis of r30 , t30 , and mismatch m (see Fig. 4) show a similar behavior, although there was no significant difference between ASP and REF when comparing the variances (FTest). Moreover, the mismatch m for the VBIP approach using three microphones is significantly larger than the same approach with four microphones.
[1] Rumsey, F.: Spatial quality evaluation for reproduced sound: Terminology, meaning, and a scenebased paradigm. Journal of the Audio Engineering Society 50.9 (2002): 651-666.
Conclusion
[5] Jekosch, U.: Voice and speech quality perception: assessment and evaluation. Springer, 2006.
[2] Silzle, A.: Quality taxonomies for auditory virtual environments. 122nd Audio Engineering Society Convention, 2007. [3] Lindau, A., et al.: A spatial audio quality inventory (SAQI). Acta Acustica united with Acustica 100.5 (2014): 984-994. [4] Beyer J., M¨oller S.: Gaming. M¨oller S., Raake A. (eds): Quality of Experience. Springer, 2014.
With the proposed set of interactive listening tests and quality measures it is possible to evaluate and compare different rendering methods for virtual acoustic scenes. Furthermore, within one method also different parameters can be compared (e.g. number of microphones). The results clearly showed the expected performance ranking of the three compared rendering methods. Within the group of recording-based methods with distributed microphone arrays, ASP clearly outperforms VBIP. In general, direct auralization (REF) yields better results than the recording-based methods. However, the difference between direct auralization and ASP is not significant for all quality measures.
[6] McRoomSim, URL: http://ee.usyd.edu.au/carlab/mcroomsim.htm [7] Reaper Digital Audio Workstation, URL: http://www.reaper.fm [8] Pernaux, J.-M., Boussard, P., and Jot, J.M.,: Virtual sound source positioning and mixing in 5.1 implementation on the real-time system genesis. Proc. Conf. Digital Audio Effects (DAFx-98). 1998. [9] Sch¨orkhuber, Ch., et al.: Method and apparatus for acoustic scene playback. Patent, 10 2016. PCT/EP2016/075595. [10] Noisternig, M., Sontacchi, A., Musil, T., and H¨oldrich, R.,: A 3D Ambisonic Based Binaural Sound Reproduction System, 24th Audio Engineering Society Int. Conference, 2003.
Acknowledgement The authors thank all listeners for their participation in the experiments. This research was supported by the Plenacoustic Sound Scene project funded by Huawei Technologies European Research Center GmbH.
[11] Zotter, F., Frank M.: All-round ambisonic panning and decoding. Journal of the audio engineering society 60.10 (2012): 807-820.
282