used on a number irrigation systems (Bos and. Nugteren, 1974 ... (m/s). Total precipitation. (mm). Sunshine. (h). ET0. (mm/day). January. 4.1. 79.1. 2.2. 14.7. 3.5.
Tekirdağ Ziraat Fakültesi Dergisi Journal of Tekirdag Agricultural Faculty
Şener ve ark., 2007 4(1)
Evaluation of Hayrabolu Irrigation Scheme in Turkey Using Comparetive Performance Indicators M. Şener
A.N. Yüksel
F. Konukcu
Namık Kemal University, Agricultural Faculty, Agricultural Structures and Irrigation Department, Tekirdag.
Performance of Hayrabolu Irrigation Scheme of the Thrace district in Turkey was evaluated using some selected comparative indicators, classified into five groups, namely, agricultural, economic, water-use, physical and environmental performance by International Water Management Institute (IWMI). Agricultural performance, evaluated in different type of Gross Value of Production, was determined lower than that of the other respective national average. Analyses of water-use performance showed that relative water and relative irrigation supply were calculated 1.91 and 1.55 respectively, indicating that water distribution is not tightly related to crop water demand. Economic performance indicators showed that the scheme had a serious problem about the collection of water fees. Physical performance, evaluated in terms of irrigation ratio and sustainability of irrigated land, were poor. Under environmental performance studies, no damages such as waterlogging and salinity were detected in the irrigated area through excessive water use. Keywords: performance evaluation, comparative indicators,irrigation project
Karşılaştırmalı Performans Göstergeleri Kullanılarak Hayrabolu Sulama Şebekesinin Değerlendirilmesi Uluslararası Su Yönetimi Enstitüsü (IWMI) tarafından geliştirilen bazı karşılaştırmalı göstergeler yardımı ile Hayrabolu Sulama Şebekesine ait tarımsal, ekonomik, su kullanımı, fiziksel ve çevresel performans değerlendirmesi yapılmıştır. Farklı tipte toplam üretim değerlerine bağlı olarak belirlenen Tarımsal performans değeri ülke ortalamasının altında saptanmıştır. Su kullanım performansı göstergelerinden nispi su sağlama ve nispi sulama suyu sağlama değerleri sırasıyla, 1.91 ve 1.55 olarak hesaplanmıştır ki bu su dağıtımı ile bitki su ihtiyacı arasında sıkı bir ilişki olmadığını göstermiştir. Ekonomik performans göstergeleri, şebekenin su toplama konusunda ciddi bir probleme sahip olduğunu göstermiştir. Sulama oranı ve sürdürülebilir sulama alanı olarak değerlendirilen fiziksel performans değeri, zayıf olarak belirlenmiştir. Çevre performans çalışmaları altında tuzluluk ve göllenme gibi zararların oluşmadığı saptanmıştır. Anahtar Kelimeler: performans değerlendirilmesi, karşılaştırmalı göstergeler, sulama projesi
Introduction Within the next two decades, many countries are expected to face insufficient water resources to satisfy their current agricultural, domestic, industrial and environmental water demands. The world population is forecasted to grow by about 30 % by the year 2025, reaching 8 billion people. As a result of improved communications, globalization and more urbanization, the living standarts are also expected to increase. This means competition
among the agricultural, industrial, domestic and other users will increase in unprecedented levels (Takeshi and Abdelhadi, 2003; Konukcu et al., 2004a and b). The Thrace Region ( European part ) of Turkey, where the largest city of Turkey Istanbul is located, is the most populated part of the country. Although almost 20 % of Turkey’s population live in the region, its soil and water resoruces are limited to only about 3 % ( DIE,
43
Tekirdağ Ziraat Fakültesi Dergisi Journal of Tekirdag Agricultural Faculty
2004). Diffusion of agricultural pollutant into surface and underground fresh water resources, unsustainable urbanisation and industrial development into the water supplying basins worsen the sources impairment. The rivers and surface water resources of the region have already been polluted seriously while local constamination and shrinkings has started in the underground water resources (Konukcu et al. 2004a and b). Therefore, sustainable use of water and land resources in the region is vital. Almost 70 % of accessible fresh water resources is utilized in agriculture (mainly in irrigation) with about 35 % water use efficiency. Even 10 % saving in this sector is more than required for domestic use (Konukcu et al. 2004a and b; Prinz, 2004). Therefore, we have to find effective and sustainable methods in using very precious water resources in agricultural production. Sustainable production increase can be achieved by two ways in irrigated agriculture. Either new irrigation projects can be developed or existing schemes can be evaluated and their performance can be improve. Because, the performance of many irrigation systems is significantly under their potential due to a number of shortcomings, such as poor design, construction and operation and maintenance. In recent years improving irrigation systems performance is more preferable than developing new irrigation areas due to investment in irrigation has failed to produce the expected result in many countries. Moreover water resources are too limited to open new schemes in the region. Therefore improving the
Şener ve ark., 2007 4(1)
performance of the existing schemes seems to be a sustainable and attractive way for the region. Many researcher have proposed indicators to measure irrigation systems performance and used on a number irrigation systems (Bos and Nugteren, 1974; Levine, 1982 and Molden et al., 1998). Most authors propose to use different indicators and different methodologies or tools to measure the same indicators (Bos et al., 1994). This causes many confusion in evaluation. To avoid this, studies have concentreted on classifying indicators recently. Two types of indicators are determined to evaluate irrigation systems: process and comparative. The aim of applying comparative indicators is to evaluate outputs and impacts of irrigation management practices, interventions across different systems and systems levels, as well as to compare various irrigation seasons and technologies with one another while process indicators are used to assess actual irrigation performance relative to systemspecific management goals and operational target (Kloezen et al., 1998). The aim of this study is to determine irrigation performance with comparative indicators. No such investigation has been done in the region so far. Therefore, system manager can develope new strategies and new adjustment for long-term objectives under determined system performance. This will provide a chance of comparing this system with another system that has different environment, infrastucture and climate in the region and in Turkey or any part of the world.
Material and Methods The study was conducted in Hayrabolu Irrigation Scheme, constructed in 1983. It is located in the Thrace Region beetween 400 56'– 410 20' East longitude and 270 00'-270 12' North latitude at 105 m altitude. The climate is characterised by terristrial type with annual mean precipitation of 575 mm and mean temperature of 13.8 0C (Table 1). The scheme has a command area of about 7720 hectares. The predominantly cultivated crops are wheat and sunflower, However, rice, watermelon, maize and sugarbeet have also been produced within a limited area. The soils are changing
44
from heavy to light but significiantly clay loam. Research area consists of base and hillside area with moderate fluctuation. General slope 0 %-1 % in base area and 2 %-10 % in hillside area. Research area bordered by small mountains which are 250-350 m in Nort and 100-150 m in South. Hayrabolu brook is main water source for Karaidemir dam which supply water for irrigation scheme. Hayrabolu brook has 403 km2 drainage area and average lenght is 33,320 km. Total storage capacity of Karaidemir dam is 111,6x10⁶ m3 and active volume for irrigation is 107,76x10⁶ m3.
Tekirdağ Ziraat Fakültesi Dergisi Journal of Tekirdag Agricultural Faculty
Şener ve ark., 2007 4(1)
Table 1. Meteorological data for the project area for 2002 year (ETo: reference evapotranspiration) Months January February March April May June July August September October November December
Average tempeture (0C) 4.1 8.9 9.9 11.1 16.6 22.0 25.9 24.5 20.5 16.6 13.1 5.9
Humidity (%) 79.1 78.7 76.2 74.0 68.6 66.7 66.6 69.7 79.4 76.0 82.9 77.5
Windspeed (m/s) 2.2 1.8 2.8 2.4 2.4 2.3 2.3 2.7 2.0 2.3 1.9 3.2
Performance of the Scheme was evaluated using some selected comparative indicators, classsified into five groups, namely, agricultural, economic, water-use, physical and environmental performance by International Water Management Institute (IWMI) (Molden et., 1998). Agricultural performance: Four indicators related to the output of different units were used for the evaluation of agricultural performance. These indicators were calculated as follows (Molden et al., 1998 ):
Total precipitation (mm) 14.7 35.9 55.0 37.9 5.6 43.8 42.9 31.9 141.8 35.7 76.1 33.3
Sunshine (h) 3.5 5.3 4.2 4.8 9.4 9.6 10.1 8.3 6.3 6.3 4.4 2.8
ET0 (mm/day) 0.73 1.23 1.82 2.35 3.98 4.90 5.41 4.53 2.81 2.04 1.03 0.87
Where, SGVP is the output of the irrigated area (US$) in terms of gross or net value of production measured at local or world prices. Irrigated copped area (ha) is the sum of areas under crops during the time period of analysis. Command area (ha) is the nominal or design area to be irrigated. Diverted irrigation supply (m3) is the volume of surface irrigation water diverted to the command area, plus net removals from groundwater. In our case, groundwater contribution was not taken into account. Volume of water consumed by ET (m3) is the actual evapotranspiration of crops. ET was calculated with following equation:
Output per unit of land cropped (US$/ha) = SGVP Irrigated cropped area
(1)
Output per unit command area (US$/ha) = SGVP Command area
(2)
Output per unit of irrigation supply (US$/m3) = SGVP Diverted irrigation sup ply
(3)
ET= ET0*kc
(5)
Where, ET0 is reference evapotranspiration (mm) calculated with Cropwat program (FAO, 1992) and kc is the crop cofficient developed for the main crops using FAO guidelines (Doorenbos and Kassam, 1986) and adjusted for regional conditions (Sener, 2004). Volume of water consumed (m3) calculated multiple of each ET values with their cultivated area. Standartized Gross Value of Production (SGVP) was developed for cross-system comparisons regardless of where they were or what kinds of crop were grown. SGVP was calculated as described in Molden et al. (1998 ).
Output per unit of water consumed (US$/m3) = SGVP Volume of water consumed by ET
(4)
Ai Pi
SGVP= crops
Pi Pworld Pb
(6)
45
Tekirdağ Ziraat Fakültesi Dergisi Journal of Tekirdag Agricultural Faculty
Şener ve ark., 2007 4(1)
Where, Ai is the area cropped with crop i (ha), Yi is the yield of crop i (kg/ha), Pi is the local price of crop i (US$/kg), Pb is the local price of the base crop (the predominant locally grown and internationally traded crop) (US$/kg), and Pworld is the value of base crop traded at world prices (US$/kg). The average world price for wheat was US $ 130/ton ( Abare Outlook, 2002; Fabri Outlook, 2002: MAF, 2002). Area and yield data was taken Turkish Republic State Hydraulic Work (DSI) 11th Regional Directorate (Anonymous, 2002a). Economic performance: Economic indicators deal with how much fee collected from water user, yearly maintenance and operation expenditure and whether system self–sufficient or not (Vermillion, 2000). The economic performance indicators used in the evaluation were: The effectiveness of fee collection (EFC) =
Collected fee Total fee Financial
self-sufficiency
Annual fee revenue Total anual exp enditure
(7)
(FSS)
=
(8)
Where, effectiveness of fee collection represents how portion of fee collected from water users whereas financial self sufficiency represents the collected fee from water users either suficient or not sufficient for operationmaintanence (O&M) cost in each year. Water use performance: Two type of indicators, realative water supply (RWS) and relative irrigation supply (RIS), were used for evaluation of water use performance ( Levine, 1982 and Perry, 1996): Relative water supply =
Total water sup ply Crop water demand
(9)
Relative irrigation supply =
Irrigation sup ply Irrigation demand 46
(10)
Where, total water suply (m3) is diverted water for irrigation plus rainfall, crop water demand (m3) is the potential crop evapotranspiration (ETp), or the real evapotranspiration (ETc) when full crop water requirement is satisfied. Deep percolation and seepage losses have to be considered for rice crop demand. Irrigation supply (m3) is surface diversions and net groundwater drafts for irrigation, irrigation demand (m3) is the crop ET minus effective rainfall. Net crop water requirement and irrigation requirement calculated by Cropwat program (FAO, 1992). The reference evapotranspiration (ET0) is calculated on a monthly basis using the Penman-Monteith (Allen et al. 1998). The monthly value of effective rainfall (Pe) was calculated using the US Bureau of Reclamation's method (Smith, 1992). RWS and RIS values indicate whether there is an adequate supply done or not to cover the demand. RWS and RIS values of 1 or higher indicates adequate while the values smaller then 1 indicate inadequate supply of irrigation.
Environmental performance: Two indicators were used to assess the environmental impacts of irrigation (Kloezen et al., 1998): Irrigated area losses (ha) and groundwater fluctuation. Where, the loss of irrigated area represents irrigated area losses due to negative environmental conditions such as salinity or waterlogging. Irrigation water and groundwater should be monitored for reasons: salinity and waterlogging have to be known to avoid the damage to sensitive crops and groundwater fluctuation can adversely affect crop production if the water table rises into the rootzone. Irrigation water was classified using U.S. Salinity Laboratory (1954) method taking salinity and sodium adsorbsion raito (SAR) into account. Watertable depth and salinity effects on crop yield and abandoned irrigation area were investigated for 5 years from 1998 to 2002 (Anonymous, 1998-2002). Irrigation water quality were determined in different times and groundwater quality were investigated monthly in 83 observation wells during the research years. Critical level for groundwater depth and salinity were taken 1.0 m from soil surface and
Tekirdağ Ziraat Fakültesi Dergisi Journal of Tekirdag Agricultural Faculty
Şener ve ark., 2007 4(1)
5 dS/m, respectively (Van Hoorn and Van Alphen, 1994; Fouss et al., 1999a and 1999b). Physical performance: Physical indicators are related with the changing or losing irrigated land in the command area by different reasons. Irrigation ratio=
Irrigated land Irrigable land
(10)
Sustainability
of
irrigated
land
Irrigated land Initial irrigated land
=
(11)
Where, irrigated land (ha) refers to the portion of the actually irrigated land (ha) in any given irrigation season. Irrigable land (ha) is the potential scheme command area (Vermillion, 2000). Irrigation ratio was calculated beetwen 1987 and 2002 years (Anonymous, 1987-2002).
Results and discussion Agriculturalperformance: SGVP values were calculated for the year 2002 by local prices (Table 2). The cropped area was 2441 ha in the winter season of 2002 in the study area. 10 main cash crops were taken into account among which wheat was taken as the base crop because it was the most tradable and cultivated crop in the region. Standardized SGVP were calculated for different units (Table 3). SGVP per unit of cultivated area (US$/ha): The annual SGVP per unit command was determined US$2325/ha for
2002, which could be considered as the average of Turkey when compared with the other investigations for different irrigation area of Turkey (Table 3). Cakmak (2001) reported a range between US$359/ha and $ 6179/ha SGVP on 7 different irrigation schemes for Konya Irrigation Assocation. This low value could be associated with the high rate of rice-growing area with 35 % of cultivated land in 2002. Molden et al. (1998) reported that non-rice producing irrigation systems could be more productive than the rice producing irrigation systems by 100 to 200 %.
Table 2. Standartized gross value of production (SGVP) values of different crops by 2002 local prices in Hayrabolu Scheme Crops Cropped area Yield Prices SGVP (ha) (ton/ha) (US$/ton) (US$) Legume family 13.0 6.06 197 15 520 Water melon 262.0 21.77 39 222 446 Sugarbeet 614.0 87.33 44 2 359 307 sunflower 99.0 2.07 275 56 356 Maize 351.0 9.68 84 285 405 Rice 847.0 8.06 360 2 457 655 Vegetable 39.0 24.71 71 68 422 Potatos 70.0 17.50 135 165 375 Onion 41.0 20.00 36 29 520 Fodder crops 105.0 7.52 18 14 213 Total 2441.0 Table 3. Agricultural performance indicators of project area for 2002 year (SGVP: Standardised gross value of production) SGVP per cultivated SGVP per unit SGVP per unit irrigation SGVP per unit water area command area water delivered consumed (US$/ha) (US$/ha) (US$/m3) (US$/m3) 2325
709
0.33
0.29
47
Tekirdağ Ziraat Fakültesi Dergisi Journal of Tekirdag Agricultural Faculty
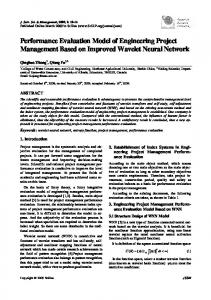
SGVP per command area (US$/ha): SGVP was determined 709 US$/ha. When compared with other schemes in Turkey, Hayrabolu irrigation had a low value among the other systems, for instance it was US$6233/ha for Bergama Kestel Irrigation, US$1469 for Manisa-Turgutlu Irrigation (Avcı et al., 1998; Girgin et al. 1999). SGVP per command area is much lower than the other indicators, which are mentioned above because of low cropping intensity. SGVP per unit irrigation supply (US$/m3): Value for the year 2002 was US$0.33/m3, which was consistent with the Relative Water Supply (Table 3). SGVP per unit irrigation supply was calculated beetwen US$0.12/m3 and $2.16/m3 in Southeastern Anatolian Project by Degirmenci et al. (2003) for the period 19972001, US$0.04/m3 and $0.56/m3 for 239 irrigation scheme by Merdun (2004) for 2001. SGVP per unit irrigation tends to be higher in humid regions where irrigation needs area generally lower. To increase the value of SGVP per unit irrigation supply, much more area cultivated with orchards, industrial crops and vegetable is needed. SGVP per unit consumed water (US$/m3): Consumed water is the actual ET from irrigated crops. SGVP per unit consumed water value is calculated US$0.29/m3 (Table 3). Molden et al. (1998) reported the SGVP per unit consumed value US$0.19/m3 for Seyhan Irrigation System in Turkey for the year 1996/97 and beetwen US$0.15/m3and $1.55/m3 by Cakmak (2002) in the Kızılırmak Basin irrigation scheme for 1999-2000. The differences are attributable to the cropping paterns and the abilities of farmers and system manager. Economic performanceThe effectiveness of fee collection (EFC): As can be seen from Fig. 1., the effectiveness of fee collections (EFC) were beetween 5.6-61.1 % (Anonymous, 19892001), which were not at a satisfactory level when compared to the systems either managed by government or by Water User Allocation (WUA) in over all the world. After turning the system over in 1998, EFC values were decrease further although management of the scheme was transfered to increase the performance. This was because there were not sanctions for the water users. EFC was not at a satisfactory level when compared with the average of other
48
Şener ve ark., 2007 4(1)
system’s in Turkey. The average of Turkey in general, for instance, was 78 % at the end of 1997 (Svenden and Nott, 1999; Yercan et al.2004). Financial self-sufficiency (FSS): Table 4 presents the ratio of financial self sufficiency for 13 years of the study area (Anonymous, 1989-2001). The Table shows that a low percentage of operation and maintance (O&M) expenditure is supported by fee collection from water users. FSS is changing in a large variety such as 6 % and 179 %. FSS values decrease after transfer process (1998) of the system management to Water User Allocation (WUA). Average FSS under government management was 70 % while 29 % after turn over the WUA. FSS value was found to be insufficient for O&M expenditure. Irrigation management transfer to Water User Allocation (WUA) is failed from this point of view. On the contrary of general expection, system couldn’t achieve self-sufficiency. This Low revenue values can be related with there is no serious sanction to water user on paying water fee. Similar lower results were also obtained for many irrigation projects in Turkey by different autors, among which it is 28 % for Eskisehir irrigation projects (Benli and Beyribey, 1998). Water use performance: Two indicators, Relative Water Supply (RWS) and Relative Irrigation Supply (RIS) were used in the evaluation of water use performance. Net crop water requirement and irrigation requirement gived in (Table 5). Diverted water amount was taken 98.3 m3/ha in 2002 season (Anonymous,2002b). RWS and RIS values were calculated as 1.91 and 1.55 respectively. This values implies that there is not a constraining water availability situation during the 2002 irrigation season for total demand of all the scheme. Evaluation of water use performance with the average values may lead incorrect output. For instance, RWS and RIS values alone in this study indicate that water demand of the crops in the scheme is satisfied. However RWS and RIS values should be decreased in order to meet the requirement in the project area where crops suffer from the lack of water due to increasing riceland. Similar results were also obtained from many research
Tekirdağ Ziraat Fakültesi Dergisi Journal of Tekirdag Agricultural Faculty
Şener ve ark., 2007 4(1)
around the world (Ray et al., 2002; Bandara, 2003). This values also imply relationship between the water supply and crop water demand was poor from the point of water distribution in the scheme. Environmental performance: Electrical conductivity (EC) of irrigation water was 0.5
dS/m and SAR was 2.1, which may cause no demanges to the prevailing crops in the project area (U.S. Salinity Laboratory, 1954). It means that irrrigation water quality was classified second and first class in terms of salinity and sodicity (C2S1), respectively, which may have no harmfull effect on the main crops of the region (U.S. Salinity Laboratory, 1954).
60 50 40 30 20 10
2001
2000
1999
1998
1997
1996
1995
1994
1993
1992
1991
1990
0
1989
Effectiveness of fee collection (%)
70
Years Figure 1. Effectiveness of fee collection in Hayrabolu Scheme Table 4. Financial self-sufficiency beetween years the 1989-2001 in Hayrabolu Irrigation scheme Financial selfTotal Revenue sufficiency operation&maintanance Years (US$) (O&M) expenditure (US$) (%) 1989
247 503
226 666
109
1990
445 282
249 269
179
1991
226 866
293 037
77
1992
137 340
288 676
48
1993
96 924
290 801
33
1994
49 114
140 556
35
1995
53 480
142 786
38
1996 1997 1998 1999 2000 2001
58 480 98 869 74 676 28 021 10 273 3 949
108 279 185 725 1 236 561 34 309 60 392 39 498
54 53 6 82 17 10
49
Tekirdağ Ziraat Fakültesi Dergisi Journal of Tekirdag Agricultural Faculty
Şener ve ark., 2007 4(1)
Table 5. Evapotranspiration (ET) and irrigation requirement of different crops in reserach area ET Irrigation requirement Crops Area (ha) (mm/season) (mm/season) Legume 13.0 442.9 341.8 Watermelon 262.0 360.6 267.5 Sugarbeet 614.0 712.4 514.9 Sunflower 99.0 399.0 306.1 Maize 351.0 418.5 321.4 Rice 847.0 1292 1082 Vegetable 39.0 342.1 254.8 Potato 70.0 542.6 424.9 Onion 41.0 358.5 248.1 Fodder crops 105.0 775.3 460.1 Total 2441.0
Other criterias of environmental performance analysis are given in Table 6 and Table 7. Only 1 % of the total area is under critical groundwater level and salinity effect. The relative cropping area of rice has been increasing year by year (Sener, 2004), which may lead water logging and salinization due to high water lost by deep percolation. Physical Performance: i) Irrigation ratio: The highest and lowest irrigation ratio ( the ratio of irrigated area to the irrigable area for a particular year) were 54.47 % in 1989 and 15.77 % in 1992 respectively (Fig. 2.). Irrigation ratio is considered low according to Vermillion (2000). This is becasue: i) some
farmers consider that spring precipitations are sufficient for crop water requirement, ii) water resources are not sufficient to satisfy full demand of irrigation since excessive water consuming crops such as rice are cultivated. ii) Sustainability of irrigated area: The data of sustainability is the current irrigated land divided by the initial irrigated land when the system is first fully developed. There is no changing between initial and command area up to now due. This shows that there is no losses in the study area due to different reasons such as use of irrigation area for other purposes. Beyribey (1997) indicated the ratio of average sustainable irrigated area is 97 % in Turkey.
Conclusion The performance of Hayrabolu irrigation scheme were evaluated using some agricultural, economical, pyhsical, water-use and environmental indicators. Results showed that project has been working under the capacity of real performance and has not been improved when compared to the years under government management. Some observation and recommendation to improve system performance are given below: Outputs values were lower than that of the other research results from Turkey and world. Infact, average output value of Turkey is also lower due to cultivation of low value crops such
50
as wheat in a large amount of area. Besides, rice crop has good output but it is taking high amount of water. So output per unit water is much lower than for the other crops. To increase output, crop-pattern should include orchard, industrail crops and vegetables and increase crop intensity. Effectiveness of fee collection was poor. The reasons for this may be listed as follow: i) water fees is not collecting acording to the used water amount by farmers, ii) no penalties for nonpayment of fees is applied, iii) lack of farmer participitation in planning and management of the project.
Tekirdağ Ziraat Fakültesi Dergisi Journal of Tekirdag Agricultural Faculty
Şener ve ark., 2007 4(1)
Table 6. Groundwater levels in the most critical month ( i.e. the month which the highest irrigation is applied) (DSI, 1998-2002). Groundwater levels and percentage Years
0-0.5 m
0.5-1.0 m
1.0-2.0 m
3.0