72]
Evaluation of Project Duration Uncertainty using the Dependency Structure Matrix and Monte Carlo Simulations
Evaluación de la incertidumbre en la duración de proyectos usando la Matriz de Estructura Dependiente y Simulaciones de Monte Carlo Edelmira Delfina Gálvez (Main and Contact Author)
Universidad Católica del Norte, Department of Mining and Metallurgy Engineering. Av. Angamos 0610, Antofagasta- Chile.
[email protected]
Salvador Fernando Capuz-Rizo
Universitat Politècnica de València, Department of Engineering Projects.
[email protected]
Joaquin Bienvenido Ordieres
Universidad Politécnica de Madrid, Department of Industrial Engineering, Business Administration and Statistics.
[email protected] Abstract The sequence of tasks is vital to the development of any project. The order of tasks is influenced by the information flow among them. The dependency structure matrix (DSM) can be used to model information flow. However, the information used by the DSM, including task duration, time required for communication, and task overlap, can have uncertain values. The aim of this paper is to analyze the effect of uncertainty on the scheduling of tasks using the DSM. Monte Carlo Simulation is applied to represent uncertainty in time estimates for projects using DSM. Conventional project duration, normal project duration with communication times, and normal project duration containing natural overlapping were considered for project time estimations. Several distribution functions were used to represent the uncertainty. It is concluded that project duration has normal distribution behavior that is independent of the type of input parameter distribution functions; that mean values of the input parameters give a good estimation of mean project duration; that interval and inner interval arithmetic give overestimation and underestimation of project duration times respectively.
Keywords: DSM, Project Duration, Managing Project, Monte Carlo Simulation, Interval Arithmetic.
Manuscript Code: 538 Date of Reception/Acceptance: 11.03.2014/01.06.2015 Resumen La secuencia de actividades es vital para el desarrollo de cualquier proyecto. El orden de las actividades está influenciado por el flujo de información entre ellas. La matriz de la estructura de dependencias (DSM) se puede utilizar para modelar el flujo de información. Sin embargo, la información utilizada por la DSM puede tener valores inciertos. El objetivo de este trabajo es analizar el efecto de la incertidumbre sobre la programación de actividades utilizando la DSM. La simulación de Monte Carlo se aplica para representar la incertidumbre en las estimaciones de tiempo para proyectos que utilizan DSM. Para las estimaciones de duración de proyecto se consideraron la duración convencional del proyecto, la duración normal de proyecto con tiempos de comunicación, y la duración normal de proyecto con superposición natural. Las incertidumbres se representaron con varias funciones de distribución. Se concluye que la duración de proyecto presenta distribución normal que es independiente del tipo de funciones de distribución de los parámetros de entrada; valores medios de los parámetros de entrada dan una buena estimación de la duración media del proyecto; las aritméticas de intervalo e intervalos interior dan una sobreestimación y subestimación de los tiempos de duración de proyecto respectivamente. Palabras Claves: DSM, Duración de Proyectos, Administración de Proyectos, Simulación de Monte Carlo, Aritmética de Intervalo.
Introduction The Dependency Structure Matrix (DSM) is a widely used tool because it allows the different parts of the project or product to be broken down or to be put together. The complexity is simplified by breaking down the project into smaller tasks, identifying the relationship between them, assessing their impact on the project, and assigning resources to individual tasks (Browning 2001). DSM has been applied to a large number of systems (Pektaş and Pultar, 2006; Cronemyr et al. 2001; Smith and Morrow 1999), including construction projects (Srour et al., 2013). Moreover, the scheduling of projects is based on finding resources and scheduling activities with the goal of optimizing the efficiency of the project (Ponz et al., 2011). Overlapping of sequential activities occurs on most construction projects (Srour et al, 2013), which requires a two-way exchange of information among dependent design disciplines (Wang et al., 2006). The conventional tool for scheduling is the PERT/ CPM, however, the PERT/CPM is not an appropriate tool for analyzing a project with overlapping because it is unable to model information flow (Wang and Lin 2009, Węglarz et al. 2011). Therefore, it cannot be used to model interdependent tasks and loops (Maheswari and Varghese, 2005). As a result of the factors previously mentioned, recent efforts to reconcile project scheduling and DSM have sought to produce a tool that serves two purposes: analysis and project scheduling (Maheswari and Varghese, 2005). Researchers have demonstrated that DSM is a powerful tool in planning 2015, 14(2), August 2015
[
the sequence of tasks. It depicts the interaction between the tasks, allows exchanges of information to be identified and administered (Yassine et al. 1999; Chen et al. 2003), and allows knowledge management (Tang et al. 2010). In addition, DSM has been applied to planning and scheduling tasks and to calculating critical path and assigning the “amount of effort/ work undertaken” for the duration of the activity. Recently, Srour et al. (2013) presented a methodology for scheduling the design phase of fast-tracked construction projects taking into consideration information exchange among project activities. The DSM was used to generate the shortest schedule by adapting the method proposed by Maheswari and Varghese (2005). However, tasks in a project are subject to many unknown factors (Herroelen and Leus 2005; Perminova et al. 2007) that can lead to changes in scheduling. These uncertainty-causing factors include: tasks taking more or less time than was originally estimated, resources not being available, required materials being ready before they are scheduled to arrive, tasks being introduced or withdrawn, and weather conditions. These changes or uncertainties can cause the schedule to be delayed, increase stock, or require major work, all of which lead to higher costs than those originally planned. For example, González et al. (2010) studied the situation of construction planning in Yucatan and found that very frequently construction firms face problems caused by delays
Gálvez, E. - Ordieres, J. B. - Capuz-Rizo, S.F.
]
Revista de la Construcción Journal of Construction
in completion time, prompt supply of materials, and lack of labor or machinery. Because there are many unknown factors the verification of methods used to determine scheduling has been questioned (Goldratt, 1997). One of the limitations of the research conducted by Maheswari and Verhese is the difficulty of obtaining a firm estimate of how long each task, the communication among tasks, and the overlap of tasks will take. Gálvez et al. (2012) studied the effect of uncertainty of task programming using DSM and grey theory or interval arithmetic. Shi and Blomquist (2012) extended the DSM method proposed by Maheswari and Varghese (2005) using fuzzy numbers. The aim of this study is to analyze the effect of uncertainty on the estimation of project duration times. Monte Carlo simulation was applied to estimate the conventional project duration time, normal project duration time with communication times, and normal project duration time with natural overlapping. Uncertainty was considered in the task duration times, communication times, and time factor (for natural overlapping) using uniform, normal, and triangular distribution functions. The remaining sections of this paper will be organized in the following manner. The second section provides brief descriptions of five important topics related to this paper, namely DSM, task planning under uncertainty, Monte Carlo simulation, interval arithmetic, and the estimation of project duration. The third section describes the Monte Carlo numerical experiment that was conducted and analyzes the results. Additionally, the applications of interval arithmetic (standard and inner) are compared with the values obtained by the Monte Carlo simulation. The fourth section provides conclusions.
73]
Background This section provides brief descriptions of DSM, task planning under uncertainty, Monte Carlo simulation, interval arithmetic, and the estimation of project duration. DSM shows the relationship between the components of a system in a format that facilitates visual analysis. DSM is a square matrix that has the same number of rows as columns. The elements that lie outside the diagonal signify the dependence of one element upon the others. The content of the columns can be understood as “information given to” and by row as “information received from”. In other words, the entries can be seen by reading the columns, and the dependent factors can be seen by reading the rows (Browning 2001). Examined from the point of view of task scheduling, there are 3 types of configurations (see figure 1): parallel, sequential, or coupled. When tasks are parallel, they do not interact with each other. For example, tasks A, B, and C in figure 1b do not require any exchange of information; whereas in figure 1a, when the tasks are sequential, one information element of task A influences the behavior of or decisions made concerning the other task B in a single direction. Consequently, the parameters of task C are selected on the basis of B, and B on the basis of A. If tasks are coupled, the flow of information is related, due to the fact that element C influences A or vice versa (A influences B, and B influences C), as shown in figure 1c. DSM can also represent tasks which are interrelated (Eppinger et al. 2010). The process of organizing the order of tasks can be achieved by moving a column left or right or a row up or down with the aim of obtaining a matrix that does not have marks over the diagonal cells or marks near the diagonal cells. This is known as partitioning.
Figure 1. Graphic and DSM representation of possible configurations in the project process. Self Elaboration, 2014
The literature on the scheduling of projects focuses on the generation of tangible tasks that allow the objective to be optimized, usually within the project’s duration. This scheduling is used as a basis for planning or programming and fulfills a number of important functions (Aytug et al. 2005). These functions include locating the resources for different tasks, coordinating tasks with outside organizations, having a communication base, and allowing for agreements and subcontracting. However, as previously mentioned, there are a number of uncertain factors that make scheduling projects difficult. In general, there are five different ways of approaching uncertain factors when scheduling projects (Herroelen and
2015, 14(2), August 2015
[
Leus, 2005): reactive scheduling, stochastic scheduling, fuzzy scheduling, proactive (robust) scheduling, and sensitivity analysis. Reactive scheduling does not attempt to incorporate uncertainty into the base planning, but rather revises and re-optimizes the original scheduling when an unexpected event takes place (Vieira et al. 2003; Sabuncuoglu and Bayiz, 2000). Stochastic scheduling focuses on tasks with uncertain durations with the aim of minimizing the expected length of time that a project will take, while also taking into account restrictions on resources and tasks with random lengths. This method does not use a base plan and requires significant computer effort. The programming of fuzzy tasks indicates
Gálvez, E. - Ordieres, J. B. - Capuz-Rizo, S.F.
]
Revista de la Construcción Journal of Construction
that the probability distribution of a task’s duration is unknown due to a lack of historical data. For this reason, the length of time is usually estimated by human resources experts whose judgments can be imprecise. As a result, instead of probable distributions, member functions based on fuzzy sets are used, and these member functions translate into start and finish times of fuzzy tasks (Slowinski and Hapke, 2000). Another method is to represent human experts as normally distributed variables (such as Cox, 1995), but allow task durations to have other continuous distributions, such as triangular or uniform distributions (Lee, 2005).
74] cover the entire range. Finally, conventional times for the duration of a project, normal duration of a project with time for communication, and normal duration of a project with natural overlaps are briefly explained. Conventional time (CT) only take into account the length of time required to carry out tasks, and can be determined using DSM in the following manner. [8], [9], [10]
[8]
Monte Carlo simulation involves sampling the model using the parameters’ probability distribution functions, such as normal or uniform, to provide parameter values. Usually, a random number is used to obtain a value based on the parameters of the distribution function. When a value for each parameter has been calculated, the model is quantified to obtain an answer. This answer is then placed into a frequency table. The entire calculation process is then repeated until the desired number of iterations is reached. In addition to the Monte Carlo simulation, we explore the use of interval arithmetic to estimate the range of project duration times. Standard interval arithmetic and inner interval arithmetic will be compared with the maximum and minimum values given by Monte Carlo simulation. Standard interval arithmetic operates with real intervals
[1]
where and are real numbers. For any real arithmetic , the corresponding interval arithmetic operation operation is defined where the result is an interval containing every possible number produced by . The standard interval arithmetic operations needed here are (in our applications, all the numbers are positive numbers) [2],[3],[4]. [2] [3]
[4] [5] [6]
With these equations the full range of possible function values in the defined region are always included. A disadvantage of standard interval arithmetic is the dependency problem: when a given variable occurs more than once in interval computation it is treated as a different variable at each occurrence. Inner interval arithmetic assumes that all operands are dependent. The inner interval operations needed here are (see Zilinskas and Bogle, 2004). [5], [6], [7] However, the estimates obtained for a range of function values using inner interval arithmetic are not guaranteed to be enclosed in the function´s range, and therefore, will not 2015, 14(2), August 2015
[
[7]
[9] [10] [11]
Where is the conventional project duration, represents the time of duration for task i. Additionally, n refers to the number of tasks; i refers to all previous tasks (intermediary tasks) of j; j refers to the currently selected task identified by the partitioned DSM matrix. ES refers to Early Start and EF refers to Early Finish. Normal time (NT) for project duration is the duration of the project, including the times for the duration of each task as well as the time for communication. Maheswari and Varghese (2005) have determined the normal time for the duration of a project with DSM using the communication times that occur between tasks and their duration. Communication time is the time spent obtaining information before or after completing a task, as well as time spent in meetings, organizing those meetings, sending and receiving emails, and other duties. The NT can be determined using Eqs. [8] and [10] and changing Eq. [9] for the following equation (for more details see Maheswari and Varghese, 2005). [11] Where the elements outside the diagonal, are equivalent to the communication times of each task. The meanings of n, i, and j are the same as previously stated. When one task depends on another, there are two possibilities: they may overlap, or they may not. Situations in which there is no overlap are of interest to administrators and carry a comparative minimum of risk. In situations where there is overlap, the upstream task may communicate available preliminary information to the downstream task and enable the downstream task to begin earlier (Wang and Lin 2009). The relationship from Finish to Start (FS) is a conventional representation of the relationship between tasks in DSM, which by itself does not completely represent the overlap of projects. It is also possible to estimate the duration of overlap by taking into account the time taken to transfer information between tasks through a relationship Start to Start (SS). In the case of tasks that do not overlap, it is assumed that the following, or successor, task will not start until the previous task or tasks have been completed. Tasks that overlap assume that a successor task can start before receiving information about tasks that took place previously and that these tasks are able to provide information before they have been finalized.
Gálvez, E. - Ordieres, J. B. - Capuz-Rizo, S.F.
]
Revista de la Construcción Journal of Construction
The times that allow for overlap are represented by the time factor, which is defined as the ratio between the time taken to exchange information and the time taken to carry out a task (Maheswari and Varghese, 2005). These times are represented by the factors Tp and Ts, where Tp represents the time factor to send information from a previous task, and Ts is the time factor required to receive information for the successor task.
75] Table 1: List of tasks in the example with the mean duration time (Aii) and standard deviation for each task. Self Elaboration, 2014 Task Identification
-
5.9
0.1
D
8.2
0.45
C
A
6.85
0.33
D
A, F
3.9
0.05
E
B
8.85
0.28
F
A, C
1.0
0.0
G
F, J
2.05
0.03
H
I
10.05
0.325
I
D, G, E
4.95
0.225
J
F, B
3.0
0.0
Table 2: The mean and standard deviations for communication times (Aji) between tasks, time factors Tp (Bji), and time factors Ts (Cji). Self Elaboration, 2014
j
i
Communication mean time (Days), Aji mean
Description of the case study This section presents the procedure for solving the conventional time for the duration of a project, the normal time for the duration of a project including the time for communication, and the normal time for project duration when the project has overlapping tasks. To provide a clearer understanding, this solution procedure is applied to a modified version of an example given by Maheswari and Varghese (2005), but including uncertainty in task duration, communication times, and time factors. This example consists of 10 tasks (A through J), as shown in table 1. Information is also provided about the previous tasks, the mean duration times, and standard deviations. Table 2 presents the mean and standard deviation of communication times and the values of the matrices B and C, where Bji represents the values of Tp (information required prior to carrying out the task). For example, 0.78 in BCA implies that A can send the required information through C at the end of 0.78 times its duration. Cji represents the values of Ts (time factor for receiving information). For example, 0.095 in CDA implies that it is essential that to continue, D receive information from A, but only at 0.095 of the time of its duration, instead of at the beginning of the task. For the calculation of the conventional project duration, the normal project duration with communication times, the normal overlap project duration, probability distribution functions of task duration are needed. Therefore, communication times and time factor values were sampled from normal, uniform, and triangular distribution functions. Figure 2 provides an example of the distribution function of task A duration time.
Standard Deviation
A
[13]
Monte Carlo Numerical Experiments
Mean Duration (Days)
B
[12]
To determine the time for the duration of a project with overlapping tasks (NTO), the Eq. [10] can be used, but replacing Eqs. [8] and [9] by Eqs. [12] and [13]. Where and are two matrices representing time factors, represents all the values of Tp, and represents all the values of Ts. The significance of the remaining elements is the same as previously indicated.
Previous Information
Standard Deviation
Time Factors Tp, Bji mean
Standard Deviation
Time Factors Ts, Cji mean
Standard Deviation
C
A
1.00
0.0
0.78
0.01
0.10
0.0
F
C
1.90
0.05
0.585
0.008
0.310
0.0050
D
A
0.80
0.0
0.795
0.003
0.095
0.0025
D
F
0.30
0.0
0.685
0.007
0.200
0.0050
B
D
4.05
0.18
0.885
0.008
0.375
0.0125
J
F
1.50
0.0
0.895
0.003
0.195
0.0075
J
B
0.0
0.0
0.960
0.020
0.0
0.0
G
F
0.10
0.0
0.480
0.010
0.480
0.010
G
J
0.40
0.0
0.980
0.010
0.310
0.005
E
B
4.25
0.125
0.865
0.018
0.100
0.0
I
D
3.45
0.075
0.580
0.010
0.195
0.0075
I
G
2.00
0.05
0.795
0.003
0.560
0.0350
I
E
3.05
0.175
0.980
0.010
0.0
0.0
H
I
4.90
0.150
0.665
0.018
0.405
0.0125
Results Values of task duration, communication times, and time factors were generated randomly from the probability distribution functions. Then using equations 1 to 12, values of conventional project duration, normal project duration with communication times, and normal overlap project duration were calculated, respectively. These values were placed in a frequency table, 1000 calculations were completed, and the data from this table were analyzed. MS Excel was used in all computations. Histograms and descriptive statistics were constructed for each type of project duration time and distribution function. The conventional project duration results are given in table 3. All distribution functions gave similar results. From the values of kurtosis and skewness, it is clear that the conventional project duration has a normal distribution. This result is the same whether the input data have a uniform, normal, or triangular distribution. The mean and median of a conventional project are also similar because the distribution is normal. If the mean values of each duration task are used to calculate the conventional
2015, 14(2), August 2015
[
Gálvez, E. - Ordieres, J. B. - Capuz-Rizo, S.F.
]
Revista de la Construcción Journal of Construction
project duration, a value of 49.70 is obtained, which is close to the mean values obtained in the Monte Carlo simulations. If the minimum and maximum values of each task duration are used to calculate the conventional project duration using standard interval arithmetic, values of 46.20 and 53.20 are obtained, which are overestimations of the values obtained in the Monte Carlo simulations. On the other hand, if inner interval arithmetic is used, values of 49.50 and 49.90 are obtained, which are underestimations of the values obtained in the Monte Carlo simulations.
76] table 3). On the other hand, if inner interval arithmetic is used, values of [68.70 and 69.60] and [30.96 and 32.83] are obtained, which are underestimations of the values obtained in the Monte Carlo simulations.
Table 3. Project duration for uniform, normal and triangular input distribution functions. (SD=standard deviation). Self Elaboration, 2014. Input Distribution Function Uniform
Normal
Triangular
Conventional project duration Figure 2. Task A distribution functions included in the Monte Carlo simulation. Self Elaboration, 2014.
Mean
49.412
49.666
49.873
Median
49.425
49.647
49.853
SD
0.782
0.763
0.527
Kurtosis
-0.286
0.096
-0.043
Skewness
-0.013
-0.015
0.142
Minimum
47.031
47.024
48.346
Maximum
51.856
52.067
51.730
Normal project duration with communication times
Uniform distribution
Mean
68.869
69.108
69.404
Median
68.901
69.108
69.387
SD
0.871
0.812
0.571
Kurtosis
-0.151
0.193
-0.043
Skewness
-0.070
-0.049
0.119
Minimum
66.084
66.472
67.701
Maximum
71.419
71.884
71.520
Normal overlap project duration
Normal distribution
31.871
32.028
32.048
Median
31.873
32.033
32.045
SD
0.485
0.543
0.493
Kurtosis
-0.338
0.030
0.034
Skewness
0.008
0.006
0.059
Minimum
30.508
30.187
30.322
Maximum
33.198
33.766
33.530
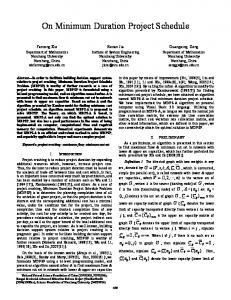
Figures 3 shows distribution functions of normal overlap project duration when uniform, normal and triangular distributions are used as input distribution functions for the task duration, communication times and time factors. It may be observed that normal distribution functions are obtained independently of the kind of input distribution functions used. Similar results are observed for the distribution function of conventional project duration and normal project duration.
Triangular distribution The normal project duration and normal overlap project duration results are also given in table 3. If the mean values of each task duration and communication time are used to calculate the normal project duration and normal overlap project duration, values of 69.15 and 32.05 are obtained respectively, which is near the mean values obtained in the Monte Carlo simulations. If the minimum and maximum values of each task duration are used to calculate the normal project duration and normal overlap project duration, using standard interval arithmetic, values of [64.3 and 74.0] and [29.48 and 34.68] are obtained respectively, which are overestimations of the values obtained in the Monte Carlo simulations (see 2015, 14(2), August 2015
Mean
[
Table 4 reports the interval values of the project duration. The values under the column heading “Monte Carlo Simulation” are the minimum and maximum values, including normal, uniform, and triangular distributions. Overestimations are obtained using standard interval arithmetic, whereas underestimations are obtained if inner interval arithmetic is used. The last column of Table 4 gives the average values of standard and inner interval arithmetic, which are better estimations of the minimum and maximum project duration times. Monte Carlo simulations were performed using uniform and normal distributions for the input parameter, with standard distribution value equal to two times the values of the previous simulations. The results are given in table 5, columns headed “SD” represent the Monte Carlo simulation performed with a standard deviation equal to the values given in the previous simulations, and columns headed “2SD” represent the Monte Carlo simulation performed with a standard deviation equal to two times the values in the previous simulations. The mean
Gálvez, E. - Ordieres, J. B. - Capuz-Rizo, S.F.
]
Revista de la Construcción Journal of Construction
77]
and median values are similar, but as expected, the standard deviation increased to a value nearly equal to two times that in the previous results.
Conclusions The following may be concluded from this research: 1) Monte Carlo simulation allows the uncertainty in the project duration to be quantified by taking into account how long it takes to carry out each task in relation to overlapping time factors. 2) The project duration has a normal distribution independent of the distribution of the task duration, communication times, and time factors. This is observed for normal project duration, conventional project duration with communication times and conventional overlap project duration. 3) A good estimation of project duration can be obtained with the mean values of task duration, communication times, and time factors. 4) Standard interval arithmetic produces an overestimation of project duration, and inner interval arithmetic gives an underestimation of project duration. 5) Good estimations of minimum and maximum project duration times are obtained using the average values of standard and inner interval arithmetic.
Figure 3. Normal project duration with overlapping distribution functions.
uniform distribution functions
normal distribution functions
triangular distribution functions
2015, 14(2), August 2015
[
Gálvez, E. - Ordieres, J. B. - Capuz-Rizo, S.F.
]
Revista de la Construcción Journal of Construction
78] Table 4. Interval values of project duration. Self Elaboration, 2014 Project Duration
Monte Carlo Simulation
Standard Interval Arithmetic
Inner Interval Arithmetic
Average value of Interval Arithmetic
Conventional time
47.02-52.07
46.20-53.20
49.50-49.90
47.85-51.55
Normal with communication times
66.08-71.88
64.30-74.00
68.70-69.60
66.50-71.80
Normal time with overlapping
30.19-33.77
29.48-34.68
30.96-32.83
30.22-33.76
Table 5. Project duration with different values of standard distribution. Self Elaboration, 2014 Distribution function Uniform SD
Normal 2SD
SD
2SD
Conventional project duration Mean
49.412
49.663
49.666
49.718
Median
49.425
49.617
49.647
49.652
Standard deviation
0.782
1.681
0.763
1.541 0.390
Kurtosis
-0.286
0.406
0.096
Skewness
-0.013
0.091
-0.015
0.096
Minimum
47.031
45.173
47.024
42.705
Maximum
51.856
54.973
52.067
55.113
Mean
68.869
69.123
69.108
69.175
Median
68.901
69.142
69.108
69.148
Standard deviation
0.871
1.820
0.812
1.693 0.496
Normal project duration with communication times
Kurtosis
-0.151
0.312
0.193
Skewness
-0.070
0.029
-0.049
0.069
Minimum
66.084
64.043
66.472
60.856
Maximum
71.419
75.220
71.884
75.737
Normal overlap project duration Mean
31.871
31.885
32.028
32.012
Median
31.873
31.870
32.033
32.028
Standard deviation
0.485
0.783
0.543
0.952
Kurtosis
-0.338
0.245
0.030
0.244
Skewness
0.008
0.080
0.006
0.057
Minimum
30.508
29.788
30.187
28.518
Maximum
33.198
34.231
33.766
35.925
2015, 14(2), August 2015
[
Gálvez, E. - Ordieres, J. B. - Capuz-Rizo, S.F.
]
Revista de la Construcción Journal of Construction
79]
References Aytug, H., Lawley, M. A. , McKay, K., Mohan, S. & Uzsoy, R. (2005). Executing production schedules in the face of uncertainties: A review and some future directions, European Journal of Operational Research, 161 (1), 86-110. Browning, T.R. (2001). Applying the design structure matrix to system decomposition and integration problems: A review and new directions. IEEE Transactions on Engineering management, 48 (3), 292-306.
Ponz, J. L., Benlloch, J., Andres, C. & Gil, D. (2011). Un algoritmo matricial RUPSP / GRUPSP “sin interrupción” para la planificación de la producción bajo metodología Lean Construction basado en procesos productivos. Revista de la Construcción, 10 (2), 90-103. Sabuncuoglu, I. & Bayiz, M. (2000). Analysis of reactive scheduling problems in a job shop environment. European Journal of Operational Research, 126, 567-586.
Chen, C.H., Ling, S.F. & Chen, W. (2003). Project scheduling for collaborative product development using DSM. Int. J. Project Management, 21 (4), 291-299.
Shi, Q. & Blomquist, T. (2012). A new approach for project scheduling using fuzzy dependency structure matrix. International Journal of Project Management, 30, 503-510.
Cox, M.A. (1995). Simple normal approximation to the completion times distribution for a PERT network. International Journal of Project Management, 13(4), 265–70.
Smith, R.P. & Morrow, J.A.. (1999). Product development process modeling. Design studies, 20, 237-261.
Cronemyr, P., Rönnbäck, A.O. & Eppinger, S.D. (2001). A decision support tools for predicting the impact of development process improvements, J. Eng. Design, 12 (3), 177-199. Eppinger, S.D., Whitney, D.E. & Yassine, A.A. (2008), The design structure matrix – DSM Home page, (http://www.dsmweb. org/) [visited on 18.09.2010] Gálvez, E.D., Capuz-Rizo, S.F. & Ordieres, J.B. (2012). Study of the uncertainty of task programming using the dependency structure matrix. Información Tecnológica, 23(1), 19-34. González, J.A., Solis, R. & Alcudia, C. (2010). Diagnóstico sobre la Planeación y Control de Proyectos en las PYMES de Construcción. Revista de la Construcción, 9 (1), 17-25.
Slowinski, R. & Hapke, M. (Eds.). (2000). Scheduling under fuzziness. Heidelberg: Physica – Verlag. Srour, I.M., Abdul-Malak, M.U., Yessine, A.A. & Ramadan, M. (2013). A methodology for scheduling overlapped design activities based on dependency information. Automation in Construction, 29, 1-11. Tang, D., Zhu, R., Tang, J., Xu, R. & He, R. (2010). Product design knowledge management based on design structure matrix. Advanced Engineering Informatics, 24, 159-166. Vieira, G.E., Herrmann, J.W. & Lin, E. (2003). Rescheduling manufacturing systems: A framework of strategies, policies and methods. Journal of Scheduling, 6, 39-62.
Goldratt, E.M., (1997), Critical Chain. Great Barrington, MA: The north river press.
Wang, J. & Lin, Y. (2009). An overlapping process model to assess schedule risk for new product development. Computer & Industrial Engineering, 57, 460-474.
Herroelen, W. & Leus, R. (2005). Project scheduling under uncertainty: survey and research potentials. European J. of operational research, 165, 289-306.
Wang, C.W., Liu, J.J. & Liao, T.S.. (2006). Modeling of design iterations through simulation. Automation in Construction, 15, 589-603.
Lee, D.E. (2005). Probability of project completion using stochastic project scheduling simulation (SPSS). Journal of Construction Engineering and Management, ASCE, 131(3), 310–318.
Węglarz, J., Józefowska, J., Mika, M. & Waligóra, G. (2011). Project scheduling with finite or infinite number of activity processing models-A survey. European Journal of operational research, 208 (3), 177-205.
Maheswari, J.U. & Varghese, K. (2005). Project scheduling using dependency structure matrix. International Journal of Project Management, 23 (3), 223-230.
Yassine, A., Falkenburg, D. & Chelst, K. (1999). Engineering design management: an information structure approach. International Journal of Production Research, 37(13), 2957–2975.
Perminova, O., Gustafsson, M. & Wikström, K. (2007). Defining uncertainty in projects-a new perspective. Int. J. Proy. Management, 26, 73-79. Pektaş, S. & Pultar, M. (2006). Modelling detailed information flows in building design with parameter-based design structure matrix. Design Studies, 27, 99-122
2015, 14(2), August 2015
[
Zilinskas, J. & Bogle, I.D.L. (2004). Balanced random interval arithmetic. Computers and Chemical Engineering 28, 839-851.
Gálvez, E. - Ordieres, J. B. - Capuz-Rizo, S.F.
]
Revista de la Construcción Journal of Construction