Evaluation of Pedotransfer Functions for Predicting the Soil Moisture Retention Curve Wim M. Cornelis,* Jan Ronsyn, Marc Van Meirvenne, and Roger Hartmann ABSTRACT
Since every PTF is developed on the basis of a database of a limited number of soil samples, it is not always clear to what extend these functions can be used in the case of soil conditions other than those under which they were developed. The aim of our study was, therefore, to evaluate (i) the general applicability and (ii) the prediction accuracy of some of the most commonly cited and some recently developed PTFs that use soil properties such as particle-size distribution (sand, silt, and clay content), organic matter or organic C content, and dry bulk density to predict the MRC. Pedotransfer functions that did not perform very well in previous studies or that needed more detailed information were not considered for evaluation. Three main approaches to estimate the MRC are generally considered, which we combined in three groups. The Group 1 PTFs estimate the water content of the soil at certain matric potentials using multiple linear regression (Gupta and Larson, 1979; Rawls and Brakensiek, 1982) or artificial neural networks (Pachepsky et al., 1996). The Group 2 PTFs predict the parameters of a closed-form analytical equation such as the model of Brooks and Corey (1964) (Rawls and Brakensiek, 1985) or the van Genuchten equation (1980). This is done through multiple linear regression (Vereecken et al., 1989; Scheinost et al., 1997; Minasny et al., 1999; Wo¨sten et al., 1999) or artificial neural networks (Pachepsky et al., 1996; Schaap and Leij, 1998; Minasny et al., 1999; Schaap et al., 1998, 1999). The Group 3 PTFs are based on a physical-conceptual approach of the water retention phenomenon (Arya and Paris, 1981; Haverkamp and Parlange, 1986) and use fractal mathematics and scaled similarities (Tyler and Wheatcraft, 1989; Comegna et al., 1998).
The soil moisture retention curve (MRC) is time consuming and expensive to measure directly. Several attempts have been made to establish a relation between readily available soil properties, like particle-size distribution, organic matter content, and bulk density, and the soil moisture retention curve. Those relationships are referred to as pedotransfer functions (PTFs). The objective of this study was to evaluate some PTFs with respect to their accuracy in predicting the soil moisture retention curve. Five widely used and four more recently developed PTFs were selected for evaluation. Seven of the selected PTFs predict moisture retention function parameters, whereas the other two predict the moisture content at certain matric potentials. In order to quantify the prediction accuracy, the mean of the absolute value of mean differences (MAMD), the mean and the standard deviation of the root of mean squared differences (MRMSD and SDRMSD, respectively), and the mean of the Pearson correlation coefficient (Mr) were used. The evaluated PTFs were finally ranked based on these validation indices. The PTFs showed good to poor prediction accuracy with MAMD values ranging from 0.0312 to 0.0603 m3 m⫺3 and with MRMSDs between 0.0412 and 0.0774 m3 m⫺3. The SDRMSDs and Mrs ranged from 0.0212 to 0.0349 m3 m⫺3, and from 0.9468 to 0.9980, respectively. The validation indices computed by the PTF of Vereecken and coworkers gave the best results. Moreover, it predicts moisture retention function parameters, and therefore, this PTF is recommended most to predict the moisture retention curve from readily available soil properties.
K
nowledge of the soil hydraulic properties is indispensable to solve many soil and water management problems related to agriculture, ecology, and environmental issues. These properties are needed to describe and predict water and solute transport, as well as to model heat and mass transport near the soil surface. One of the main soil hydraulic properties is the moisture retention curve (MRC), as it expresses the relationship between the matric potential and the water content of the soil. It can be considered as a soil’s fingerprint, since the shape of the curve is related to various physical and chemical soil properties, which are unique for each soil. Although the MRC is of great importance in presentday agricultural, ecological, and environmental soil research, it is not a readily available soil property. The main reason is that its measurement is expensive, time consuming, and labor intensive. Therefore, models have been developed to predict the MRC from more easily measurable and more readily available soil properties, like particle-size distribution, organic matter content, and dry bulk density. These models are referred to as pedotransfer functions (PTFs) (Bouma, 1989).
MATERIALS AND METHODS The Retained Pedotransfer Functions Group 1 Pedotransfer Functions In the category of functions that predict the water content at certain matric potentials, two PTFs were retained. They both use a series of multiple linear regression equations, linking the water content at a certain matric potential to sand, silt, and clay content; organic matter content; and bulk density. Gupta and Larson (1979) used 43 different soil materials originating from 10 locations in the eastern and central USA to develop their PTF. The 12 regression equations that estimate soil moisture content at matric potentials ranging from ⫺4 up to ⫺1500 kPa were developed on disturbed samples, con-
W.M. Cornelis, M. Van Meirvenne, R. Hartmann, Ghent University, Dep. Soil Management and Soil Care, Coupure links 653, B-9000 Gent, Belgium; and J. Ronsyn, Belgian Nuclear Research Centre, Boeretang 200, B-2400 Mol, Belgium. Received 5 June 2000. *Corresponding author (
[email protected]).
Abbreviations: MAMD, mean of the absolute value of mean differences; MD, mean difference; Mr, mean of the Pearson correlation coefficient; MRC, moisture retention curve; MRMSD, mean of the root of mean squared differences; PTF, pedotransfer function; RMSD, root of mean squared difference; SDRMSD, standard deviation of the root of mean squared differences.
Published in Soil Sci. Soc. Am. J. 65:638–648 (2001).
638
CORNELIS ET AL.: PEDOTRANSFER FUNCTIONS FOR THE SOIL MOISTURE RETENTION CURVE
taining mixtures of dredged sediment and productive soil in different proportions. Rawls and Brakensiek (1982) estimated moisture content within the same matric potential range using the same soil properties. Their data originate from 2543 horizons from across the USA. To increase the accuracy of the regression equations, the moisture content at ⫺1500 kPa or at both ⫺33 and ⫺1500 kPa was introduced and added to the regression equations. However, the latter equations were not retained in our study, since these extra data are mostly not available. Group 2 Pedotransfer Functions Pedotransfer functions that estimate retention function parameters have a greater ability to be used in flux models than PTFs that predict water content at certain matric potentials because of the continuous result (Tietje and Hennings, 1993; van den Berg et al., 1997). Rawls and Brakensiek (1985) developed one of the few PTFs that use the Brooks and Corey model (1964)
() ⫽ s () ⫽ r ⫹ (s ⫺ r)
for ⱖ b
冢 冣
b
for ⬍ b
[1]
where is the moisture content (m3 m⫺3 ), s is the moisture content at saturation (m3 m⫺3 ), r is the residual moisture content (m3 m⫺3 ), is the matric potential (kPa), b is the bubbling pressure (kPa), and is a pore-size distribution index (dimensionless). Their regression equations were formulated for natural soils and use porosity, clay content, and sand content as input variables. Alternatively, the van Genuchten equation (1980),
() ⫽ r ⫹ (s ⫺ r)
1 冢1 ⫹ (␣||) 冣
m
n
[2]
where ␣ (kPa⫺1 ), and n and m (dimensionless) are regression coefficients, has an inflection point that allows better performance than the Brooks and Corey model, particularly near saturation (van Genuchten and Nielsen, 1985). Therefore, the latter is the most frequently used model for the MRC. Vereecken et al. (1989) used multiple linear regression with sand and clay content, organic C content, and bulk density data from undisturbed samples of 182 horizons of 40 Belgian soil series to solve for the parameters of the van Genuchten equation. Wo¨sten et al. (1994) developed a class PTF, referred to as the Staring series. Although these series are not a PTF in a strict sense—the van Genuchten parameters are not predicted from a function as such, but their calculated values are given in tabular format for different soil units—it was retained here as it is often referred to. The Staring series is based on 620 soil moisture retention curves from 36 different Dutch soil units. The required information is soil unit, which can be obtained from clay, silt, sand, and organic matter content or directly from soil maps, and from location within the profile (i.e., topsoil or subsoil). More recently, Scheinost et al. (1997) developed a PTF that is particularly designed for a highly variable landscape. Their functions are based on 87 undisturbed soil samples collected in northern Germany and needs particle-size distribution, organic C content, and porosity. The van Genuchten parameters s, r, and m are predicted by the multiple linear regression equations found by Vereecken et al. (1989). The parameters ␣ and n, however, are related to the geometric mean particle diameter and its standard deviation, in an attempt to include some physical meaning to the PTF. These two parameters
639
were predicted using nonlinear regression to all data, and this is referred to by Minasny et al. (1999) as extended nonlinear regression. Schaap et al. (1999) predicted the parameters of the van Genuchten equation by using an artificial neural network. Their PTF was based on 1209 soil samples, originating from 30 sources in the USA. One-half of them were used as a calibration set, the others as a validation set. The input variables of the Schaap et al. (1999) PTF retained in this study are clay, silt, and sand content, and dry bulk density. The other PTFs proposed by Schaap et al. (1999), which enable the prediction of the MRC with less or more input variables, were not evaluated here. Finally within Group 2, the PTFs of Wo¨sten et al. (1999) were evaluated. These authors used multiple linear regression to predict the parameters of the van Genuchten equation with data from 4030 horizons from all over Europe. A class as well as a continuous PTF was developed. The class PTF, referred to as the HYPRES series, was obtained by subdividing the database into 11 soil textural classes, and it gives the van Genuchten parameters in tabular format, whereas the continuous PTF does not consider any grouping. Input data needed are sand, silt, and clay content; bulk density; organic matter content; and a qualitative variable, indicating whether topsoil or subsoil is considered. Note that the terms class and continuous PTF used here have different definitions from those used by Minasny et al. (1999). Group 3 Pedotransfer Functions The physical-conceptual PTFs were not retained in this study because of the following reasons. First, the PTFs in this group require a particle-size distribution as detailed as possible. The use of only three classes reduces their performance considerably (Tietje and Tapkenhinrichs, 1993). Second, the model of Arya and Paris (1981) has been developed on a limited database, and hence the accuracy decreases significantly when extrapolating to other soils (Tietje and Tapkenhinrichs, 1993). Third, Bird et al. (1996) and Bird and Dexter (1997) noted that the errors present in PTFs based on the fractal dimension, as is the case with, for example, the PTF of Tyler and Wheatcraft (1989), can be quite significant. Finally, this group of PTFs performed poorly in the evaluation of Tietje and Tapkenhinrichs (1993), due to the reasons mentioned above. Table 1 gives an overview of the input data needed for the different PTFs retained in this study. The data ranges of the PTF’s calibration data sets are shown in Table 2.
Evaluation Data Set and Soil Sample Analysis The evaluation of the PTFs retained in this study was based on a data set of 298 undisturbed 100-cm3 soil samples, collected from 69 different soils covering a wide range of textures within Flanders, Belgium (see Fig. 1). The samples’ MRC was determined in at least two replicates (but mostly in four and six replicates) at nine matric potentials. This was done with the sand box apparatus (Eijkelkamp Agrisearch Equipment, Giesbeek, the Netherlands) for matric potentials between ⫺0.25 and ⫺10 kPa, and with pressure chambers (Soilmoisture Equipment, Santa Barbara, CA) for matric potentials between ⫺20 and ⫺1500 kPa.1 Once the () data set was obtained, the replicates were mixed, and organic matter content and particle-size distribution in three fractions were determined on the mixed soil samples. Particle-size distribution was deter1 Mention of company names is for the convenience of the reader and does not constitute any endorsement from the authors.
640
SOIL SCI. SOC. AM. J., VOL. 65, MAY–JUNE 2001
Table 1. Required input parameters for the evaluated pedotransfer functions (PTFs). Particle-size distribution PTF
Clay
Silt
Sand
Gravel
Organic matter
Bulk density
Porosity
Topsoil/ subsoil
Gupta & Larson (1979) Rawls & Brakensiek (1982) Rawls & Brakensiek (1985) Vereecken et al. (1989) Wo¨sten et al. (1994) Scheinost et al. (1997) Schaap et al. (1999) Wo¨sten et al. (1999) (class) Wo¨sten et al. (1999) (continuous)
0–2 0–2 0–2 0–2 NA 0–2 0–2 0–2 0–2
m 2–50 2–50 no no NA 2–63 2–50 no 2–50
50–2000 50–2000 50–2000 50–2000 NA 63–2000 50–2000 50–2000 no
mm no no no no no 2–63 no no no
yes yes no yes NA yes no yes yes
yes yes no yes no yes yes no yes
no no yes no no no no no no
no no no no yes no no yes yes
† Not applicable. The Staring series use soil classes that can be directly obtained from soil maps; hence, particle-size distribution is not a prerequisite.
mined with the pipette method (Gee and Bauder, 1986). Since the German classification, as used by Scheinost et al. (1997), considers a boundary of 63 m as the separation between silt and sand, our silt and sand content values had to be converted. This was done by loglinear interpolation (Scheinost et al., 1997). Organic matter was determined by means of the Walkley and Black (1934) method.
Evaluation Methods Overall Applicability Initially, we determined whether the samples in the evaluation data set fit within the ranges of the calibration data sets of the different PTFs (see Table 2). Although some soil property values from our data set fell outside these ranges, the evaluation of each PTF was not only conducted on soils within these ranges. It was also done on all sampled soils, since one of the objectives of the study was to evaluate PTFs for a whole range of soils in the study area. These evaluations will be referred to as the range-dependent and the complete evaluation, respectively. Comparison of Measured and Predicted Moisture Retention Curves To compare the measured and predicted retention curves, two approaches can be considered. In a first approach, the chosen validation indices are numerically calculated based on predicted and measured water contents at certain matric potentials. In a second approach, measured and predicted functions are integrated between top and bottom boundaries. However, this requires a continuous function to be fitted to the measured () data pairs. In this study, only the second approach was retained for reasons as outlined below. First, it smooths the sometimes irregular data points, which can occur even if the MRC is based on two to six replications. Second, the matric potentials applied in our measurements were different
from those at which the moisture content was predicted in the Group 1 PTFs. Third, integration is more objective than simple summation, because the latter depends on the choice of the matric potentials that were applied to determine the corresponding moisture content experimentally. A PTF can perform very well in only one part of the MRC, and when the chosen matric potentials fall mainly in that part (which is not known a priori), this will result in a better validation. Finally, for modeling purposes a continuous function is required anyhow. The van Genuchten equation was selected, for reasons mentioned earlier. As it is a smooth continuous function, it is useful for numerical modeling purposes and can be combined analytically with pore-size distribution models of hydraulic conductivity (e.g., Mualem, 1976). It is, therefore, used in many soil water and solute transport computer-simulation models like HYDRUS (Vogel et al., 1996), WAVE (Vanclooster et al., 1996), and SWAP (van Dam et al., 1997). The prediction accuracy of the PTFs for a given soil was determined by three complementary indices: the mean difference MD (m3 m⫺3 ) and the root of the mean squared difference RMSD (m3 m⫺3 ) between the measured and predicted MRC, and the Pearson correlation coefficient r. Let ()mi be the measured moisture retention function for soil i [i.e., a continuous van Genuchten curve fitted to the discrete set of measured () values], and ()Pi the predicted moisture content function for soil i (i.e., a continuous Brooks and Corey or van Genuchten curve as predicted by the PTF or obtained by curve fitting in case of the Group 1 PTFs), where i ⫽ 1, 2, . . . n, with n the total number of soils in the evaluation data set. Then the MD (m3 m⫺3 ) for soil i was calculated as
MDi ⫽
1 b⫺a
b
冮 [()
pi
⫺ ()mi]d
[3]
a
Use of the MD allows evaluating the bias of the MRC and its absolute value should be as small as possible. However,
Table 2. Soil property ranges of the calibration data sets used to develop the evaluated pedotransfer functions (PTFs).
Evaluation data set PTF Gupta & Larson (1979) Rawls & Brakensiek (1982) Rawls & Brakensiek (1985) Vereecken et al. (1989) Wo¨sten et al. (1994) Scheinost et al. (1997) Schaap et al. (1999) Wo¨sten et al. (1999) (class) Wo¨sten et al. (1999) (cont.)
Clay (0–2 m)
Silt Sand (2–50m) (50–2000 m)
1–64 (14)† 0–65 1–93 (18) 5–60 0–55 (11) unknown 3–54 (22) 0–89 unknown unknown
1–79 (31) 1–72 1–93 (26) – 0–81 (37) unknown 3–68 (36) 6–89 – unknown
† Arithmetic means are given in parentheses.
% 4–97 (55) 5–98 1–99 (56) 5–70 6–98 (52) unknown 2–88 (35) 0–100 unknown –
Gravel (2–63 mm)
Organic matter
Bulk density
Porosity
Topsoil/ subsoil
Applicable to soils
0–7 (2) 0–23 0–7 (1) – 0–13 (2) unknown 0–15 (2) unknown unknown unknown
Mg m⫺3 1.05–1.77 (1.47) 0.74–1.74 0.70–2.09 (1.42) – 1.04–1.83 (1.47) – 0.80–1.79 (1.49) 0.46–1.79 – unknown
% – – – unknown – – – – – –
– yes – – – – yes – – yes yes
%
– – – – – – 0–64 (8) – – –
91 100 58 96 unknown 70 87 unknown unknown
CORNELIS ET AL.: PEDOTRANSFER FUNCTIONS FOR THE SOIL MOISTURE RETENTION CURVE
641
Fig. 1. Clay (0–2 m), silt (2–50 m), and sand (50–2000 m) content of the evaluation data set.
underestimation or overestimation of the MRC may cancel out resulting in a low absolute value, even if the fit is poor. The RMSD (m3 m⫺3 ) for soil i was calculated as
RMSDi ⫽
冪
1 b⫺a
b
冮 [()
pi
⫺ ()mi] d 2
[4]
a
The RMSD is always positive and the model’s performance increases the more it approaches zero. It is an indication for the overall error of the evaluated function. The Pearson correlation coefficient r (dimensionless) for soil i was calculated as b
ri ⫽
冮 [()
mi
⫺ mi][()pi ⫺ pi] d
a
冪冮
b
[()mi ⫺ mi]2 d
a
冮
b
[5] [()pi ⫺ pi]2 d
a
b
where mi ⫽ [1/(b ⫺ a)]冮 ()mid is the mean moisture content a
b
of the measured MRC for soil i, and pi ⫽ [1/(b ⫺ a)]冮 ()Pid a
is the mean moisture content of the predicted MRC for soil i. This index is a measure for the linearity between measurements and predictions. An r value that approaches 1 means that the measured and predicted data pairs are linearly located around the line of perfect agreement (or 1:1 line). Hence, the predicted curve is of comparable shape as the measured curve. The integration boundaries a and b are set here to log(0.25 kPa) and log(1500 kPa), respectively, which is within the range of the measured MRC. The use of log|| was preferred to avoid assigning too much weight to more negative matric potentials (Tietje and Hennings, 1993). The van Genuchten parameters in ()mi were obtained by means of the MS Windows version of the RETC-code (van Genuchten et al., 1991), which uses the nonlinear least-squares analysis algorithm of Marquardt (1963) minimizing the sum of squared residuals. The five van Genuchten parameters were calculated without imposing any restrictions on the unknown parameters, as this gives superior fits (van Genuchten et al., 1991). In order to determine ()Pi in the case of the two Group 1 PTFs, s was kept constant and it was given a value equal to the total pore volume calculated from bulk density (which is an input parameter of both PTFs). When total pore volume was lower
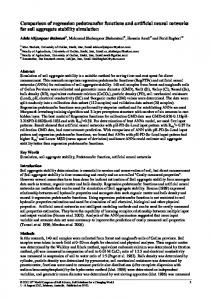
Fig. 2. Measured, fitted, and predicted moisture retention curves (MRCs) of a sandy loam soil.
than the moisture content at ⫺4 kPa matric potential, s was set equal to a value slightly higher than ⫺4kPa. The computation of the van Genuchten function by means of the artificial neural network of Schaap et al. (1999) was executed with Rosetta 1.0, a MS Windows program developed by M.G. Schaap. To illustrate the complementary character of these indices, the MRCs as calculated from the PTFs of Rawls and Brakensiek (1982), Vereecken et al. (1989), and Scheinost et al. (1997), and the MRC obtained by curve fitting Eq. [2] to the measured data are given for a sandy loam soil (Fig. 2). When comparing the PTFs of Vereecken et al. (1989) and Scheinost et al. (1997), the absolute value of MD calculated for the Vereecken PTF was somewhat higher than the Scheinost PTF’s absolute value of MD (0.0189 and 0.0154 m3 m⫺3, respectively). Nevertheless, the RMSD of the Vereecken PTF was more than twice as low as the RMSD of the Scheinost PTF (0.0272 and 0.0547 m3 m⫺3, respectively). The r values were of the same order of magnitude (0.9948 and 0.9899, respectively). On the other hand, the Rawls and Brakensiek (1982) and the Vereecken et al. (1989) PTF have comparable RMSD values (0.0283 and 0.0272 m3 m⫺3, respectively), but differ substantially in r value (0.9764 and 0.9948, respectively). Thus, although the global error is more or less the same, the MRC predicted by the Vereecken et al. (1989) PTF follows the shape of the measured MRC better than does the Rawls and Brakensiek (1982) PTF. This is important for many purposes, for example, to calculate the differential water capacity C(d/dh ), a parameter that is often used to solve the well-known Richards equation for water transport numerically. The MD of the Rawls and Brakensiek (1982) PTF was 0.0118 m3 m⫺3, which is lower than the MD of the Vereecken et al. (1989) PTF. It may be clear from this example that the three validation indices are complementary and that use of only one index can lead to erroneous conclusions as regards the behavior of a PTF. In order to facilitate the comparison between the different PTFs, the mean of the absolute values of MD, the mean of RMSD values, and the mean of r values over the n soil samples were determined for each PTF. It is obvious that the smaller the means of the absolute values of MD and of RMSD values, and the more the mean of r values approaches 1, the better
642
SOIL SCI. SOC. AM. J., VOL. 65, MAY–JUNE 2001
will be the performance of the PTF. The advantage of taking the absolute value of MD instead of the MD as such is that it depends only on the error or possible bias within a given MRC (corresponding to a given soil). The mean of MDs on the other hand is also dependent on a possible bias between different MRCs (corresponding to different soils); that is, a low mean of MDs can be due to low MDs, but also to compensation of high positive and negative MDs of the different MRCs. To have an idea about the overall bias of a given PTF, the mean of the absolute values of MD can be compared with the absolute value of the mean of MDs. When both are equal, the PTF shows a 100% overestimation or underestimation for all MRCs, and hence produces no bias at all. Finally, as the standard deviation of the validation indices illustrates the precision and regularity of a PTF, it was also introduced here. Some PTFs can perform well for a certain type of soil, while for other soils their accuracy is very low. In order to avoid giving too much weight to the standard deviation as a validation index, it was only calculated for the RMSD. The validation indices described above enabled us to rank the PTFs. A final ranking was based on the mean of the rankings given to the PTFs for each validation index separately. Each validation index was given an equal weight; however, the mean of MD was not considered. A ranking was introduced since the evaluation of PTFs should not be based on one validation index only, but should take into account the different indices simultaneously (Whitmore, 1991; Boucneau et al., 1998). A low mean of RMSDs, for example, only indicates a good correspondence between measured and predicted MRCs, but does not say anything about underestimation or overestimation within the MRC. Finally, the accuracy of the different PTFs can be depicted graphically by plotting measured vs. predicted water contents at certain matric potentials. In analogy with the different validation indices, the measured values correspond with water contents calculated from a fitted van Genuchten equation at the given matric potentials. Plots were drawn at values of ⫺0.3, ⫺3, ⫺10, ⫺31, ⫺98, and ⫺1500 kPa. Note that ⫺0.3 kPa corresponds with near saturation conditions. The values ⫺10 and ⫺31 kPa are often considered as close to field capacity conditions of many soils, whereas ⫺1500 kPa is close to the permanent wilting point of many crops (Cassel and Nielsen, 1986). The critical matric potentials at which many crops undergo water stress are in the order of magnitude of ⫺98 kPa for too dry conditions and close to ⫺3 kPa for too wet conditions (Tayler and Ashcroft, 1972; Wesseling, 1991).
RESULTS AND DISCUSSION Applicability When considering the overall applicability of the retained PTFs, Table 2 reveals that only the PTF of Rawls
and Brakensiek (1982) covers the whole range of our evaluation data set. The PTFs of Vereecken et al. (1989), Gupta and Larson (1979), and Schaap et al. (1999) cover, respectively, more than 95, 91, and 87% of our soil samples. The Schaap et al. (1999) PTF does not include soils with very low silt content (⬍6%). The Gupta and Larson PTF (1979) excludes soils with very low sand content or very high bulk density, whereas in case of the Vereecken et al. PTF (1989) the soil samples with very low sand content and very low bulk density fall out of the range of the calibration data set. As both the PTF of Rawls and Brakensiek (1985) and Scheinost et al. (1997) were developed on soils with a sand content lower than 70 and 88%, respectively, they do not cover the sandiest soils of our data set. Also soils with high silt and clay content and very low sand content are excluded. Hence only 58 and 70% of the evaluated soil samples fall within the calibration data set of the PTF of Rawls and Brakensiek (1985) and Scheinost et al. (1997), respectively. Since no information about the range of the applied soil properties was available for the PTFs developed by the Wo¨sten group (1994, 1999), their applicability could not be tested.
Evaluation of the Pedotransfer Functions As was mentioned above, the measured MRCs correspond with a continuous van Genuchten curve fitted to the discrete set of measured () data pairs. The R2 of all fitted curves was between 0.976 and 0.999 with a mean of 0.994 and a standard deviation of 0.005. These measured curves therefore represent the actual MRCs very well. Although most of the PTFs were not applicable to all the soil samples of the evaluation data set, the PTFs were evaluated on both the range-dependent and the complete data set. The values calculated for the different validation indices are presented in Tables 3 and 4. Note that narrowing the evaluation data set did not alter the PTFs performance considerably when considering all validation indices, except for the PTF of Scheinost et al. (1997). This model showed some improvement in prediction accuracy if only those soil samples that fall within the original data set were used, which is 70% of our soil samples. Hence it moves one rank. The PTF of Rawls and Brakensiek (1985) and Schaap et al. (1999) on the other hand showed even higher values of the mean of the absolute values of MD and the mean of
Table 3. Validation indices and final ranking of the pedotransfer functions (PTFs) as computed on the complete evaluation data set.† PTF
mean MD
mean abs. MD 3
Gupta and Larson (1979) Rawls and Brakensiek (1982) Rawls and Brakensiek (1985) Vereecken et al. (1989) Wo¨sten et al. (1994) Scheinost et al. (1997) Schaap et al. (1999) Wo¨sten et al. (1999) (class) Wo¨sten et al. (1999) (cont.)
0.0228 0.0187 ⫺0.0582 ⫺0.0226 ⫺0.0058 0.0280 ⫺0.0531 ⫺0.0163 ⫺0.0293
mean RMSD
m⫺3
m 0.0416 0.0392 0.0603 0.0312 0.0333 0.0373 0.0553 0.0388 0.0389
(7)‡ (6) (9) (1) (2) (3) (8) (4) (5)
† MD, mean difference; RMSD, root of mean squared difference. ‡ The values in parentheses are the rankings for each validation index.
0.0602 0.0653 0.0774 0.0412 0.0521 0.0573 0.0724 0.0527 0.0518
(6) (7) (9) (1) (3) (5) (8) (4) (2)
mean r – 0.9600 0.9703 0.9468 0.9880 0.9876 0.9493 0.9675 0.9805 0.9773
SD RMSD 3
(7) (5) (9) (1) (2) (8) (6) (3) (4)
m⫺3
m 0.0316 0.0349 0.0318 0.0212 0.0234 0.0332 0.0277 0.0285 0.0235
(6) (9) (7) (1) (2) (8) (4) (5) (3)
Final rank – 6 8 9 1 2 5 6 4 3
643
CORNELIS ET AL.: PEDOTRANSFER FUNCTIONS FOR THE SOIL MOISTURE RETENTION CURVE
RMSD values, despite the canceling out of respectively 42 and 13% (see Table 2) of the soil samples in case of the range-dependent evaluation. Note, however, that the increase of the error could also be due to a fewer number of samples. When considering the mean of MDs, it can be observed that only the PTFs of Gupta and Larson (1979), Rawls and Brakensiek (1982), and Scheinost et al. (1997), tend to overestimate the MRC (Tables 3 and 4). The other PTFs show a tendency to underestimate. Fig. 3 and 4 reveal that, in the case of the PTFs of Rawls and Brakensiek (1985), Schaap et al. (1999), and the class and continuous PTF of Wo¨sten et al. (1999), this underestimation occurs across the whole range of matric potentials, that is, from low to high values. The same is true for the overestimation of the Scheinost et al. (1997) PTF. The Wo¨sten et al. (1994) PTF underestimates mainly at moisture contents below ⫺31 kPa. This was also observed for the Vereecken et al. (1989) PTF, which is in contradiction with findings of Kern (1995). He reported a slight tendency to overestimate water content at ⫺1500 kPa matric potential in case of the Vereecken et al. (1989) PTF. The overestimation of the PTFs of Gupta and Larson (1979) and Rawls and Brakensiek (1982) is only pronounced near saturation, that is, at a matric potential of ⫺0.3 kPa. However, the Gupta and Larson (1979) PTF also overestimates considerably at the dry end of the MRC, that is, at a matric potential of ⫺1500 kPa. When comparing the mean of the absolute values of MD with the absolute value of the mean of MDs, and from Fig. 3 and 4, it is clear that the PTFs of Rawls and Brakensiek (1985), Scheinost et al. (1997), and Schaap et al. (1999) almost systematically underestimate or overestimate for all soils. The relative differences between the mean of the absolute values of MD and the absolute value of the mean of MDs are low. The PTF of Vereecken et al. (1989) and the continuous PTF of Wo¨sten et al. (1999) show slight bias between the soils, whereas the bias observed for the three other PTFs is considerable. As regards the mean of the absolute values of MD, the Vereecken et al. (1989) PTF has the smallest value, which is mainly due to a low prediction error. The relatively low mean of the absolute values of MD that can be observed for the Wo¨sten et al. (1994) PTF is to a higher extent attributed to a bias within the different
MRCs. The largest means of the absolute values of MD can be observed for the Rawls and Brakensiek (1985) and the Schaap et al. (1999) PTFs, which were almost twice as high as those calculated for the Vereecken et al. (1989) functions. They hence show little bias within a given MRC. As regards the mean of RMSDs, again the Vereecken et al. (1989) PTF shows the lowest values, meaning that the predicted MRC follows the measured MRC relatively well. By far the highest values result from the Rawls and Brakensiek (1985) and Schaap et al. (1999) PTFs. The other PTFs have intermediate values. Note that the Scheinost et al. (1997) PTF shows a considerable decline in the mean of RMSDs when restricting the ranges of the evaluation data set to those of the calibration data set. The mean of r values reveals a somewhat different pattern in terms of the model’s ranking. The correspondence between measured and predicted MRCs is still highest for the Vereecken et al. (1989) function and lowest for the Rawls and Brakensiek (1985) PTF. However, poor correspondence is observed for the PTF of Scheinost et al. (1997). Narrowing the evaluation data set has the highest impact on the Scheinost et al. (1997) function, although it only moves one rank. The other PTFs appear to show an intermediate correspondence. As concerns the standard deviations of RMSDs, again the same trend can be perceived: the PTF of Vereecken et al. (1989) performs best, followed by the three Wo¨sten et al. (1994, 1999) PTFs. This means that their performance is the least dependent on the soil type. Also the Schaap et al. (1999) PTF performs quite well as regards the standard deviation, despite high RMSD values. When restricting the Scheinost et al. (1997) PTF to the ranges of its calibration data set, only a slight improvement is observed, although its RMSD is relatively low. Hence this PTF has a low regularity. From Fig. 3 and 4 it can be deduced that most of the models predict best near saturation ( ⫽ ⫺0.3 kPa). Only the two Group 1 PTFs do not perform very well at the very wet end of the MRCs. This must be attributed to the relatively low matric potential (⫺4 kPa) at which these PTFs start to predict moisture content. Relatively good predictions can also be observed at the dry end of the MRCs ( ⫽ ⫺1500 kPa). Compared with the other PTFs, the prediction error of the PTF of Schaap
Table 4. Validation indices and final ranking of the pedotransfer functions (PTFs) as computed on the range-dependent evaluation data set.† PTF
mean MD
mean abs. MD 3
Gupta and Larson (1979) Rawls and Brakensiek (1982) Rawls and Brakensiek (1985) Vereecken et al. (1989) Wo¨sten et al. (1994) Scheinost et al. (1997) Schaap et al. (1999) Wo¨sten et al. (1999) (class) Wo¨sten et al. (1999) (cont.)
0.0164 0.0187 ⫺0.0686 ⫺0.0240 ⫺0.0058 0.0196 ⫺0.0566 ⫺0.0163 ⫺0.0293
mean RMSD
m⫺3
m 0.0355 0.0392 0.0701 0.0302 0.0333 0.0318 0.0589 0.0388 0.0389
(4)‡ (7) (9) (1) (3) (2) (8) (5) (6)
† MD, mean difference; RMSD, root of mean squared difference. ‡ The values in parentheses are the rankings for each validation index.
0.0543 0.0653 0.0800 0.0400 0.0521 0.0498 0.0742 0.0527 0.0518
(6) (7) (9) (1) (4) (2) (8) (5) (3)
mean r – 0.9617 0.9703 0.9567 0.9872 0.9876 0.9684 0.9720 0.9805 0.9773
SD RMSD 3
(8) (6) (9) (2) (1) (7) (5) (3) (4)
m⫺3
m 0.0221 0.0349 0.0348 0.0196 0.0234 0.0301 0.0269 0.0285 0.0235
(2) (9) (8) (1) (3) (7) (5) (6) (4)
Final rank – 6 8 9 1 2 4 7 5 3
644
SOIL SCI. SOC. AM. J., VOL. 65, MAY–JUNE 2001
Fig. 3. Measured vs. predicted soil moisture contents at matric potentials of ⫺0.3, ⫺3, and ⫺10 kPa.
et al. (1999) is quite high at this dry end. All PTFs show, however, the highest errors at ⫺10 and ⫺31 kPa matric potential, which correspond with moisture conditions near field capacity. The exception here is the Rawls and Brakensiek (1982) PTF that performs worst near saturation. The low prediction accuracy that was observed for the Rawls and Brakensiek (1985) PTF when considering the different validation indices is not specifically due to the lower performance of the Brooks and Corey (1964) function. If this had been the case, prediction errors would only be large in the near-saturation range of the MRC. Figure 4 reveals that the discrepancies between
measured and predicted moisture contents are also quite considerable in the drier range of the MRC.
Effect of Soil Properties on the Function’s Performance In order to determine the effect of organic matter content and bulk density on the performance of the PTFs, the soil samples were sorted according to the USDA soil classes. As Fig. 5 shows, a distinct relation between organic matter content and RMSD and between bulk density and RMSD could not be observed
CORNELIS ET AL.: PEDOTRANSFER FUNCTIONS FOR THE SOIL MOISTURE RETENTION CURVE
645
Fig. 4. Measured vs. predicted soil moisture contents at matric potentials of ⫺31, ⫺98, and ⫺1500 kPa.
for the Vereecken et al. (1989) model. When applying a linear regression to the data, the R2 values were 0.002 for organic matter and 0.019 for bulk density. Comparable conclusions could be drawn with the other PTFs and the other validation indices. In Table 5 the mean of RMSD values and the standard deviations over the number of samples per soil class are given for each PTF. It was found that the Vereecken et al. (1989) PTF performs best for the coarser soil classes like sand, loamy sand, sandy loam, and silt loam. This is not surprisingly since more than 88% of the soil samples used to develop this PTF had a clay content
lower than 17.5% (Vereecken et al., 1989). For loam soils, the lowest mean of RMSD values are observed for the Scheinost et al. (1997) PTF. The latter PTF is also the best for the clayey soils, closely followed by the PTF of Wo¨sten et al. (1994) and Vereecken et al. (1989). The two Group 1 functions perform relatively well for the coarsest soil classes (i.e., sand, loamy sand and sandy loam). For these soil classes the moisture content at ⫺4 kPa matric potential was always lower than the total pore volume as calculated from bulk density. Since this was not always the case in the other soil classes, the means of RMSD values were higher there.
646
SOIL SCI. SOC. AM. J., VOL. 65, MAY–JUNE 2001
CONCLUSIONS
Fig. 5. Root of mean squared difference (RMSD) as a function of (a) organic matter content and (b) bulk density for the Vereecken et al. (1989) pedotransfer function.
Narrowing the evaluation data set did not alter the values significantly, except in the cases of the Gupta and Larson (1979), Vereecken et al. (1989), and the Scheinost et al. (1997) models for a silt loam, the clayey soils, and a loamy sand, respectively. The loamy sand and the sand soils are, however, cancelled out for the Rawls and Brakensiek (1985) PTF, whereas sand soils are omitted for the Scheinost et al. (1997) PTF.
The evaluation and comparison of the nine pedotransfer functions that were considered in this study enabled us to draw following conclusions about the PTFs. The PTF of Vereecken et al. (1989) was the most accurate. It had the highest ranking for the four validation indices that were computed in this study. It had also a very high applicability to our soils, since it is based on a very wide range of the required soil properties. The highest prediction errors were observed at matric potentials near field capacity. These errors were, however, relatively low as compared with the errors of the other PTFs evaluated. Prediction errors were also somewhat higher for the finer textured soils. The second best PTF was the Staring series (Wo¨sten et al., 1994). They perform only slightly poorer than the Vereecken et al. (1989) PTF. Their ranking was quite consistent for the four validation indices, and was between one and four when also considering the range-dependent evaluation. An important drawback of these series is that the retention curve parameters are given in tabular format for 36 soil units, which can be problematic for some modeling purposes. The results obtained from the Wo¨sten et al. (1999) continuous PTF were also acceptable. This continuous function behaves better than the HYPRES series (Wo¨sten et al., 1999), which was developed on the same huge European data set. This class PTF gives the MRC parameters in tabular format for 11 soil textural classes. The Scheinost et al. (1997) PTF showed an intermediate accuracy in predicting the MRC. Although the MDs and the RMSDs were relatively low, its Pearson correlation coefficient was rather poor. It also showed a poor consistency when comparing the predicted MRCs of the different soils, resulting in a relatively high standard deviation. However, a clear trend in this PTF’s accuracy as related to soil type could not be observed. Narrowing the evaluation data set to the original calibration data set and thus canceling out the sand soils did improve the performance of this PTF slightly. Also the PTFs of Gupta and Larson (1979) and Rawls and Brakensiek (1982) showed an intermediate performance. This was mainly due to the large prediction errors in the wet range of the MRC, particularly for soils finer than loam. These PTFs predict moisture contents at given matric potentials, which is a serious drawback for modeling
Table 5. Mean of root of mean squared difference (RMSD) per soil class for each evaluated pedotransfer functions (PTF) as computed on the complete evaluation data set. Mean RMSD
Soil class
n†
Sand Loamy sand Sandy loam Loam Silt loam Clayey soils§
– 13 10 14 11 13 8
Gupta and Larson (1979) 0.049 0.053 0.053 0.045 0.082 0.086
(0.016)‡ (0.014) (0.022) (0.017) (0.045) (0.044)
Rawls and Brakensiek (1982) 0.043 0.056 0.045 0.060 0.103 0.095
(0.013) (0.026) (0.020) (0.019) (0.034) (0.045)
Rawls and Brakensiek (1985) 0.070 0.073 0.081 0.079 0.055 0.124
(0.024) (0.026) (0.030) (0.021) (0.027) (0.031)
Vereecken et al. (1989) 0.037 0.042 0.039 0.040 0.036 0.060
(0.019) (0.018) (0.019) (0.018) (0.012) (0.039)
Wosten et al. (1994) m3 m⫺3 0.054 (0.029) 0.051 (0.030) 0.054 (0.021) 0.042 (0.015) 0.053 (0.019) 0.058 (0.027)
Scheinost et al. (1997) 0.078 0.082 0.056 0.031 0.044 0.054
(0.031) (0.038) (0.034) (0.011) (0.021) (0.034)
Schaap et al. (1999) 0.077 0.074 0.072 0.078 0.069 0.085
Wosten et al., Wosten et al., class cont. (1999) (1999)
(0.028) (0.029) (0.028) (0.034) (0.016) (0.050)
† n is the number of soils per soil class. ‡ Values in parentheses are standard deviations. § Clayey soils include the soil classes sandy clay loam (n ⫽ 2), silty clay loam (n ⫽ 1), silty clay (n ⫽ 1), and clay (n ⫽ 4).
0.049 0.053 0.072 0.036 0.038 0.071
(0.021) (0.022) (0.039) (0.027) (0.008) (0.027)
0.063 0.054 0.052 0.041 0.040 0.067
(0.020) (0.018) (0.022) (0.018) (0.015) (0.041)
CORNELIS ET AL.: PEDOTRANSFER FUNCTIONS FOR THE SOIL MOISTURE RETENTION CURVE
purposes, since a curve needs to be fitted first to the computed data set. A problem arises in that the highest matric potential at which the moisture content is predicted is ⫺4 kPa, and hence the uncertainty in the very wet range, between saturation and ⫺4 kPa, is very large. Therefore, these functions should not be used in nearsaturation conditions. The validation indices obtained from the Schaap et al. (1999) PTF were more or less comparable with those of the Gupta and Larson (1979) and Rawls and Brakensiek (1982) PTF. It has, however, a relatively high regularity. The poorest results were obtained from the Rawls and Brakensiek (1985) PTF. This is in contradiction with findings of Tietje and Tapkenhinrichs (1993). They concluded that this PTF shows results comparable with those of Vereecken et al. (1989). In general, most PTFs predict moisture content well near saturation and at the dry end of the PTF, near permanent wilting point. The highest prediction errors are observed at moisture conditions close to field capacity. It is worthwhile noting here that at least those PTFs that were developed and calibrated on soil samples collected in the Low Lands (Belgium and the Netherlands) perform the best. An explanation could be that the soil samples from our evaluation data set came from the same Low-Land population. The soils from the Low Lands that were considered in this study were formed under more or less the same conditions. One should, therefore, be careful when applying a PTF in a geographical area different from the one where the samples of the calibration data set were taken. Nevertheless, the Vereecken et al. (1989) PTF, for example, has proven to perform very well in studies where large data sets were used that were derived from different geographical areas (Tietje and Tapkenhinrichs, 1993; Kern, 1995; Schaap et al., 1998). Finally, it can be concluded from this study that the simple multiple regression functions developed more than a decade ago by Vereecken and coworkers (1989) are still the best to predict the soil moisture retention curve from easily available soil properties. None of the evaluated pedotransfer functions that have been developed in recent years performs better. ACKNOWLEDGMENTS The authors would like to express their gratitude to Jan Feyen and Lode Hubrechts from the Institute for Land and Water Management, Catholic University Leuven, Belgium, for providing us with their database, part of which has been used in our study. We would like to stress, however, that this part of our evaluation database was completely independent from the calibration and validation database as used by Vereecken et al. (1989).
REFERENCES Arya, L.M., and J.F. Paris. 1981. A physico-empirical model to predict the soil moisture characteristic from particle-size distribution and bulk density data. Soil Sci. Soc. Am. J. 45:1023–1030. Bird, N.R.A., F. Bartoli, and A.R. Dexter. 1996. Water retention models for fractal soil structures. Eur. J. Soil Sci. 47:1–6. Bird, N.R.A., and A.R. Dexter. 1997. Simulation of soil water retention using random fractal networks. Eur. J. Soil Sci. 48:633–641. Boucneau, G., M. Van Meirvenne, and G. Hofman. 1998. Comparing
647
pedotransfer functions to estimate soil bulk density in northern Belgium. Pedologie-Themata 5:67–70. Bouma, J. 1989. Using soil survey data for quantitative land evaluation. Adv. Soil Sci. 9:177–213. Brooks, R.H., and A.T. Corey. 1964. Hydraulic properties of porous media. Hydrology Paper 3. Colorado State Univ., Fort Collins, CO. Cassel, D.K., and D.R. Nielsen. 1986. Field capacity and available water capacity. p. 901–926. In A. Klute (ed.) Methods of soil analysis. Part 1. 2nd ed. Agron. Monogr. 9. ASA and SSSA, Madison, WI. Comegna, V., P. Damiani, and A. Somella. 1998. Use of a fractal model for determining soil water retention curves. Geoderma 85:307–323. Gee, G.W., and J.W. Bauder. 1986. Particle-size analysis. p. 383–411. In A. Klute (ed.) Methods of soil analysis. Part 1. 2nd ed. Agron. Monogr. 9. ASA and SSSA, Madison, WI. Gupta, S.C., and W.E. Larson. 1979. Estimating soil water retention characteristics from particle size distribution, organic matter percent and bulk density. Water Resour. Res. 15:1633–1635. Haverkamp, R., and J.-Y. Parlange. 1986. Predicting the water-retention curve from particle-size distribution: 1. Sandy soils without organic matter. Soil Sci. 142:325–339. Kern, J.S. 1995. Evaluation of soil water retention models based on basic soil physical properties. Soil Sci. Soc. Am. J. 59:1134–1141. Marquardt, D.W. 1963. An algorithm for least-squares estimation of non-linear parameters. J. Soc. Ind. Appl. Math. 2:431–441. Minasny, B., A.B. McBratney, and K.L. Bristow. 1999. Comparison of different approaches to the development of pedotransfer functions for water-retention curves. Geoderma 93:225–253. Mualem, Y. 1976. A new model for predicting the hydraulic conductivity of unsaturated porous media. Water Resour. Res. 12:513–522. Pachepsky, Y.A., D. Timlin, and G. Varallyay. 1996. Artificial neural networks to estimate soil water retention from easily measurable data. Soil Sci. Soc. Am. J. 60:727–733. Rawls, W.J., and D.L. Brakensiek. 1982. Estimating soil water retention from soil properties. J. Irrig. Drainage Div. ASCE 108:166–171. Rawls, W.J., and D.L. Brakensiek. 1985. Prediction of soil water properties for hydrologic modelling. p. 293–299. In E. Jones and T.J. Ward (ed.) Watershed Management in the Eighties. Proc. Symposium of Irrig. Drainage Div. ASCE. Denver, CO. 30 Apr.–1 May 1985. ASCE, New York. Schaap, M.G., and F.J. Leij. 1998. Using neural networks to predict soil water retention and soil hydraulic conductivity. Soil Tillage Res. 47:37–42. Schaap, M.G., F.J. Leij, and M.Th. van Genuchten. 1998. Neural network analysis for hierarchical prediction of soil hydraulic properties. Soil Sci. Soc. Am. J. 62:847–855. Schaap, M.G., F.J. Leij, and M.Th. van Genuchten. 1999. A bootstrapneural network approach to predict soil hydraulic parameters. p. 1237–1250. In M.Th. van Genuchten et al. (ed.) Proc. Int. Workshop on Characterization and Measurements of the Hydraulic Properties of Unsaturated Porous Media. Univ. California, Riverside, CA. 22–24 Oct. 1997. Univ. of California, Riverside, CA. Scheinost, A.C., W. Sinowski, and K. Auerswald. 1997. Regionalization of soil water retention curves in a highly variable soilscape: I. Developing a new pedotransfer function. Geoderma 78:129–143. Taylor, S.A., and G.M. Ashcroft. 1972. Physical edaphology. Freeman and Co., San Francisco, CA. Tietje, O., and V. Hennings. 1993. Bewertung von Pedotransferfunktionen zur Scha¨tzung der Wasserspannungskurve. Z. Pflanzenerna¨hr. Bodenkd. 156:447–455. Tietje, O., and M. Tapkenhinrichs. 1993. Evaluation of pedo-transfer functions. Soil Sci. Soc. Am. J. 57:1088–1095. Tyler, S.W., and S.W. Wheatcraft. 1989. Application of fractal mathematics to soil water retention estimation. Soil Sci. Soc. Am. J. 53:987–996. Vanclooster, M., P. Viaene, K. Christiaens, and S. Ducheyne. 1996. WAVE, a mathematical model for simulating water and agrochemicals in the soil and the vadose environment. Reference and user’s manual, release 2.1. Inst. for Land and Water Management, Catholic Univ. Leuven, Belgium. van Dam, J.C., J. Huygen, J.G. Wesseling, R.A. Feddes, P. Kabat, P.E.V. van Walsum, P. Groenendijk, and C.A. van Diepen. 1997. Theory of SWAP version 2.0. Simulation of water flow, solute transport and plant growth in the soil–water–plant–atmosphere environment. Techn. Doc. 45. Staring Centre, Agric. Res. Dep., Wageningen, the Netherlands.
648
SOIL SCI. SOC. AM. J., VOL. 65, MAY–JUNE 2001
van den Berg, M., E. Klamt, L.P. van Reeuwijk, and W.G. Sombroek. 1997. Pedotransfer functions for the estimation of moisture retention characteristics of Ferralsols and related soils. Geoderma 78:161–180. van Genuchten, M.Th. 1980. A closed-form equation for predicting the hydraulic conductivity of unsaturated soils. Soil Sci. Soc. Am. J. 44:892–898. van Genuchten, M.Th., and D.R. Nielsen. 1985. On describing and predicting the hydraulic properties of unsaturated soils. Ann. Geophys. 3:615–628. van Genuchten, M.Th., F.J. Leij, and S.R. Yates. 1991. The RETC code for quantifying the hydraulic functions of unsaturated soils. EPA Rep. 600/2-91/065. U.S. Salinity Lab., USDA-ARS, Riverside, CA. Vereecken, H., J. Maes, J. Feyen, and P. Darius. 1989. Estimating the soil moisture retention characteristic from texture, bulk density and carbon content. Soil Sci. 148:389–403. Vogel, T., K. Huang, R. Zhang, and M.Th. van Genuchten. 1996. The HYDRUS code for simulating water flow, solute transport, and
heat movement in variably-saturated porous media. Version 5.0. Research Rep. 140. USSL, Riverside, CA. Walkley, A., and I.A. Black. 1934. An examination of the Degtjareff method for determining soil organic matter and a proposed modification of the chromic acid titration method. Soil Sci. 37:29–38. Wesseling, J.G. 1991. Meerjarige simulaties van grondwateronttrekking voor verschillende bodemprofielen, grondwatertrappen en gewassen met het model SWATRE. Rep. 152. Winand Staring Centre, Wageningen, the Netherlands. Whitmore, A.P. 1991. A method for assessing the goodness of computer simulation of soil processes. J. Soil Sci. 42:289–299. Wo¨sten, J.H.M., A. Lilly, A. Nemes, and C. Le Bas. 1999. Development and use of a database of hydraulic properties of European soils. Geoderma 90:169–185. Wo¨sten, J.H.M., G.J. Veerman, and J. Stolte. 1994. Waterretentieen doorlatendheidskarakteristieken van boven- en ondergronden in Nederland: de Staringreeks. Techn. Doc. 18. Staring Centre, Agricultural Research Dept., Wageningen, the Netherlands.
Correcting Laboratory Retention Curves for Hydrostatic Fluid Distributions Marc Jalbert and Jacob H. Dane* ABSTRACT Many experimental methods for obtaining capillary pressure– volumetric fluid content relations in porous media are affected by the occurrence of hydrostatic pressures that create nonuniform fluid content distributions throughout the sample of interest. Such conditions exist, for example, in suction apparatuses and pressure cells, which are widely used in vadose zone hydrology, agronomy and environmental engineering, and for Hg intrusion porosimetry routinely applied in the petroleum industry. We show how to correct experimental data for nonuniform pressure and fluid content distributions, which leads to retention or pore-size distribution curves applicable to physical points. This is necessary to make the retention information consistent with the differential equations modeling fluid flow in porous media. The advantage of the proposed method is that it does not require an a priori assumption of any given model describing the retention relation. The proposed correction formula is validated both numerically and experimentally and is compared with an existing correction procedure. By deconvoluting retention relations from the averaging taking place in the sample, the correction method presented should enhance the description of porous media–immiscible fluids systems at low capillary pressure values.
M
odeling the flow of immiscible fluids in a porous medium requires knowledge of the capillary pressure head (hc )–volumetric fluid content () relation with maximal precision. Many experimental methods have been developed for obtaining this relation. Most methods, however, use samples of a certain height, zs, and neglect changes in fluid pressures and contents with elevation. Ignoring these changes can lead to substantial errors. This is especially true for coarse porous media, relatively high samples, fluids with low interfacial tensions, and dense fluids, such as Hg. In this paper we present the development and discuss the application of Dep. of Agronomy and Soils, Auburn Univ., Auburn AL 36849-5412. Received 19 May 2000. *Corresponding author (jdane@acesag. auburn.edu). Published in Soil Sci. Soc. Am. J. 65:648–654 (2001).
a mathematical formula that accounts for nonuniform fluid distributions due to hydrostatic fluid pressures, and thus enables the correction of experimentally obtained hc– relationships. The advantage of the proposed method over previously published correction procedures (Liu and Dane, 1995; Schroth et al., 1996) is that it does not assume any model for the retention relation. Consequently, it is applicable to porous media that are not well described by the commonly used retention models of Brooks and Corey (1964) and van Genuchten (1980). Furthermore, it guides one towards a correct modeling of the porous medium, if a closed-form expression for the retention relation is needed. THEORY Consider a homogeneous porous medium sample of constant horizontal cross-sectional area and height zs for which we would like to determine the drainage relation in a twophase fluid system. The sample is initially saturated with the wetting fluid, for example, water in an air–water system, Hg vapor in a liquid Hg–Hg vapor system, or water in a tetrachloroethylene–water system. The sample is in contact with the nonwetting fluid, whose pressure is gradually stepwise increased. Static equilibrium is allowed to occur after each pressure increment and the in- or outflow volumes of the nonwetting or wetting fluid, respectively, are measured as they are needed to calculate the average volumetric nonwetting fluid content, n, and/or the average volumetric wetting fluid content, w, upon the completion of the experiment. The pressures in the wetting and nonwetting fluids are measured at elevations zw and zn, respectively. We will refer to these pressures as Pw and Pn because they are generally considered as average values of the pressures over the extent of the sample. At a physical point, the volumetric nonwetting and wetting fluid content are referred to as n and w, respectively. They are related by
n ⫹ w ⫽
[1]
Abbreviations: DNAPL, denser-than-water nonaqueous phase liquid; hc, capillary pressure head; , volumetric fluid content.