Grand Sierra Resort and Casino. Reno, Nevada. June 21 â June 24, 2009. Abstract. The relationship between volumetric soil water content and pressure head, ...
An ASABE Meeting Presentation Paper Number: 097431
Evaluation of Pedotransfer Functions for Predicting the Soil Water Characteristic Curve for U.S. Soils Ahmed M. Abdelbaki Civil Engineering Dept., Faculty of Engineering, Fayoum University, Egypt. Biological and Agricultural Engineering Dept. North Carolina State University, USA Irrigation and Hydraulic Dept. Faculty of Engineering, Cairo University, Egypt
Mohamed A. Youssef Biological and Agricultural Engineering Dept. North Carolina State University, USA
Esmail F. Naguib Irrigation and Hydraulics Dept., Faculty of Engineering, Cairo University, Egypt
Mohamed E. Kiwan Irrigation and Hydraulics Dept., Faculty of Engineering, Cairo University, Egypt
Emad I. Elgiddawy Civil Engineering Dept., Faculty of Engineering, Fayoum University, Egypt.
Written for presentation at the 2009 ASABE Annual International Meeting Sponsored by ASABE Grand Sierra Resort and Casino Reno, Nevada June 21 – June 24, 2009 Abstract. The relationship between volumetric soil water content and pressure head, known as the soil water characteristic (SWC) curve, is a key input to many hydrological and water quality models that simulate water movement and solute transport in the vadose zone. The SWC data are needed for a large number of soils in order to apply these models at large scale. The laboratory methods for measuring SWC are time consuming and relatively expensive. Alternatively, Pedotransfer functions (PTFs) have been developed to estimate the SWC using readily available soil properties such as particle size distribution, bulk density, and organic matter. Over the past two decades, a considerable number of PTFs have been developed to
predict SWC. The goal of this study was to conduct a comprehensive evaluation of twenty two PTFs, five discrete functions and seventeen continuous functions. The SWC predicted by different PTFs was statistically compared to SWC measured for 2046 of US soils; SWC measured for each soil has 1 to 12 data points, making a total of 5000 data points. The performance of each function was evaluated for soils of different textural classes and at three matric potentials; 10kPa, 33 kpa, and 1500 kpa. The results showed that, the PTFs developed by Rawls et al. (1982) and Adhikary et al. (2008) showed the best performance among the five discrete functions and the four PTFs developed by Cosby et al. (1984), Rawls and Brakensiek (1985), Schaap et al. (2001) (Rosetta SSC), and Mayer and Jarvis (1999) showed the best performance among the seventeen continuous PTFs. Results of this study can be very useful to hydrologic modeling as it identifies the most accurate PTF for each soil textural class and across the matric potential ranges.
Keywords. Soil water characteristics, Pedotransfer functions, Evaluation, Potential head, texture classes.
1 Introduction Soil hydraulic properties are among the most important factors that regulate the movement of groundwater and the fate and transport of solutes. Soil hydraulic properties are important inputs to hydrologic and water quality models, which simulate the fate and transport of pollutants in the soil media from both point and non-point sources. One of the most important hydraulic properties of soils is the relationship between soil water content and soil matric potential, commonly referred to as soil water characteristic curve (SWCC) or soil water release curve(van Genuchten, 1980). However, SWCC is not a readily available soil property primarily because of the cost and time of measurement. Instead of the direct measurement of SWCC, which is practically impossible for large scale studies, pedotransfer functions (PTFs) (Bouma, 1989) have been developed to indirectly predict the SWCC from more readily available soil properties such as, particle size distribution, organic matter, and bulk density. These soil properties are widely available in several soil databases (Leij et al., 1996). Over the last two decades, several approaches have been used to develop PTFs including multi-linear regression (MLR) (e.g. Rawls et al., 1982; Vereecken et al., 1990; Wosten et al., 1999; Saxton and Rawls, 2006), artificial neural network (ANN) (e.g. Schaap et al., 1998; Merdun et al., 2005; Baker et al., 2008) and group method of data handling (GMDH) (e.g. Ungaro et al., 2005; Nemes et al., 2005). Two main groups of PTFs for predicting SWCC have been developed: discrete or point PTFs and continuous PTFs. The discrete PTFs predict the soil water content at a specific matric potential (e.g. Gupta and Larson, 1979; Rawls and Brakensiek, 1982; H. el Majou et al., 2007; Adhikary et al., 2008; Homaee et al., 2008). Continuous PTFs are closed-form equations that predict a continuous relationship between soil water content and matric potential (e.g. Brooks and Corey, 1964; Campbell, 1974; Van Genuchten, 1980; Mualem, 1984; Saxton et al., 1986; Hutson and Cass, 1987). Regardless of the approach used in developing the PTFs, the majority of them have been developed using a limited number of soil samples and are expected to perform differently, especially when applied to soil conditions that are significantly different from those under which the functions were developed. Several studies have been conducted in the past two decades to compare the performance of PTFs. Tietje and Tapkenhinrichs (1993) tested thirteen PTFs using a data set of 1116 soil water content-matric potential data points measured for German soils . they concluded that (1) the PTFs have poor performance in predicting the parameters of the closed form equation developed by Van Genuchten (1980) (2) the PTFs developed by Brakensiek and Rawls (1984) shows comparable results to those developed by Vereecken et al. (1989) and, (3) the PTFs developed by Saxton et al. (1986) and Cosby et al. (1984) give poor results, especially for soils with large organic matter content. Another study conducted by Cornelis et al. (2001), they compared nine PTFs to estimate the soil water characteristics curve using 69 SWCC covering a wide range of textures within Flanders (Belgium); they concluded that the PTF developed by Vereecken et al. (1989) was the most accurate whereas the PTF developed by Brakensiek and Rawls (1984) showed a poorer results. Recently, Schaap et al. (2004) used a wide dataset of 47 435 records containing 113 970 observed water contents to test eleven PTFs. They found that all PTFs underestimate the soil water content and the PTF developed by Schaap et al. (1998) that requires inputs of sand, silt and clay contents, bulk density, and water contents at 33kpa and 1500 kpa was the most accurate model with the minimum root mean square error (RMSE). Over the last two decades, a considerable number of PTFs have been proposed for predicting SWCC to be a useful tool to provide the hydrological models with the required input parameters (e.g. Cosby et al., 1984; Vereecken et al., 1989; Schaap et al., 1998; Wosten et al., 1999; Rajkai et al., 2004; Rubio et al., 2008). These functions have been developed under different
conditions and using many different datasets either in volume of the dataset or in its source (see Table 1). Studies showed that the accuracy of predictions of PTFs depends on the soil texture class at which the water content is predicted (Tietje and Tapkenhinrichs, 1993; Cornelis et al., 2001; Thakur et al., 2007). Other studies showed that the accuracy of PTFs depends on the pressure head at which the water content is predicted (Kern et al., 1995; Ungaro et al., 2001; Givi et al., 2004; Schaap et al., 2004; Nemes and Rawls 2006). The aim of this study is to evaluate the accuracy of twenty two Pedotransfer functions for predicting the soil water content for United States soils, where climatic and geological conditions are different from those used for developing the PTFs.
2 Materials and Methods 2.1 Pedotransfer Functions of soil water content. 2.1.1 Point Pedotransfer Functions This type of Pedotransfer functions predicts the soil water content at specific matric potentials as discrete points. Five point PTFs are evaluated in this study. Gupta and Larson (1979) used 43 different soil materials originating from 10 locations in eastern and central USA to develop 12 regression equations that estimate soil water content at matric potentials ranging from -4 to 1500 kpa. The PTFs developed by Gupta and Larson (1979) require particle size distribution, organic matter content, and bulk density data (Eq. 1). θ = a ∗ SA + b ∗ SI + c ∗ CL + d ∗ OM + e ∗ BD
(1)
where θ is the volumetric soil water content (cm3/cm3), a, b, c ,d and e are regression coefficients, SA is the sand content(%), SI is the silt content (%), CL is the clay content (%), OM is the organic matter content (%), and BD is the bulk density (gm/cm3). Rawls et al. (1982) developed 10 regression equations using data originating from 2543 horizons from across the USA to estimate volumetric water content at matric potentials ranging from -10kpa to -1500 kpa. The PTFs of Rawls et al. (1982) require only particle size distribution and organic matter content (Eq. 2). 𝜃 = 𝑎 + 𝑏 ∗ 𝑆𝐴 + 𝑐 ∗ 𝑆𝐼 + 𝑑 ∗ 𝐶𝐿 + 𝑒 ∗ 𝑂𝑀
(2)
H. Al Majou et al. (2007) developed point PTF using a dataset of 320 soil horizons from France. Their dataset comprising 90 top soils and 230 subsoil horizons. They established the PTF according to the texture (textural class PTFs) in the CEC triangle and then according to both the texture and bulk density (texturo-structural class PTFs). The point PTF developed by H. Al Majou et al. (2007) (Eqn. 3) predicts the soil water content at seven matric potential ranging from -1 to -1500 kpa using inputs of particle size distribution, bulk density, and organic matter content. 𝜃 = 𝑎 + 𝑏 ∗ 𝐶𝐿 + 𝑐 ∗ 𝑆𝐼 + 𝑑 ∗ 𝑂𝑀 + 𝑒 ∗ 𝐵𝐷
(3)
Adhikary et al. (2008) developed point PTF for predicting SWCC using 800 measured soil water content-matric potential data points of Indian soils. They developed seven regression equations to predict soil water content at seven matric potentials ranging from -10 to -1500 kpa. The PTFs were developed by Adhikary et al. (2008) (Eqn. 4) require only particle size distribution. 𝜃 = (𝑎 + 𝑏 ∗ 𝑆𝐴 + 𝑐 ∗ 𝑆𝐼 + 𝑑 ∗ 𝐶𝐿)/100 (4) Using 185 measured SWCC of Iranian soils, Homaee et al. (2008) developed two types of parametric and point functions. Some of the developed PTFs require the gypsum content as an input while the other functions require only the particle size distribution. Only, the last PTF were evaluated in this study due to the availability of its inputs (Eqn. 5). The Point PTFs developed by Homaee et al. (2008) predict the soil water content at six matric potentials ranging from -10 to 1500 kpa. θ = a + b ∗ SA + c ∗ log(CL) (5)
2.1.2 Continuous Pedotransfer Functions Continuous PTFs for predicting soil water content are closed form equations to simulate the relationship between SWC and matric potential. Continuous PTFs are more reliable to be applied in hydrological models than point PTFs due to its continuous results. Several equations have been suggested to simulate the soil water characteristic curve. Brooks and Corey (1964) suggested Eqn. (6) to simulate the relationship between soil water content (θ) vs. matric potential head (h). θ−θr θs −θr
H
= [ hb ]
λ
(6)
Where θ is the volumetric soil water content (m3/m3), θs is the saturated soil water content (m3/m3)(water content at zero matric potential), θr is the residual soil water content (m3/m3), Hb is the bubbling pressure kpa, λ is the pore size distribution index (dimensionless). The parameters of Brooks-Corey equation were determined by Rawls and Brakensiek (1985). Their regression equations were formulated using 2543 measured soil water content-matric potential data points for American and international soils. The PTFs developed by Rawls and Brakensiek (1984) require the soil porosity, clay content, and sand content as an inputs. Recently, Campbell (1974) modified Brooks and Corey (1964) equation by neglecting the term of residual water content (Eqn. 7). Using 1448 measured soil water content- matric potential data points for American soils, Cosby et al. (1984) developed PTFs for predicting the parameters of Campbell’s equation in terms of sand and clay contents θ θs
H
= [ b] h
λ
(7)
One of the most used equations for predicting soil water characteristic curve is the equation of Van Genuchten (1980) Eqn. (8). This equation has better performance to predict soil water content especially at matric potentials near saturation.
θ−θr θs −θr
1
=
1− 1 n [1+(αh)n ]
(8)
Vereecken et al. (1989) used 182 horizons of 40 Belgium soil series to solve for the parameters of the van Genuchten equation. They developed their PTFs using multiple linear regressions technique. The PTFs developed by Vereecken et al. (1989) require sand, clay, and organic matter content, and bulk density. Wosten et al. (1999) used multi linear regression to develop class and continuous PTFs to predict the parameters of Van Genuchten equation. They used dataset from 4030 horizons from all over Europe. The PTFs developed by Wosten et al. (1999) require sand, silt, clay and organic matter contents and bulk density. Rubio et al. (2008) developed two site-specific Pedotransfer Functions to predict the parameters of van Genuchten equation for two vegetation covers. The first function for forest land and requires inputs of sand content and bulk density. The second function for grass land and requires inputs of organic matter content and bulk density. Schaap et al. (2001) developed artificial neural network program with graphical user interface called (Rosetta) for predicting the parameters of Van Genuchten equation. Rosetta can be used for predicting saturated hydraulic conductivity and Van Genuchten equation’s parameters. The program has five different levels of input requirements. In this study, the models Rosetta-SSC (needs inputs of %sand, %silt, and %clay) and Rosetta SSC-BD(needs inputs of %sand, %silt, %clay, and bulk density) were evaluated. Recently, Mualem-van Genuchten, modified the equation of Van-Genuchten (1980) by removing the term of residual soil water content (θr) to produce the following equation ( Eqn. 9) θ=
θs 1 (1− ) n
(9)
[1+(αh)n ]
Many studies have been conducted to develop PTFs for predicting the parameters of Eqn. 9. Rajkai et al. (2004) used 305 SWCC from the Hungarian soil database to determine the parameters of Mualem-van Genuchten equation. They developed four PTFs. Due to the Lacking of input requirements, two of these PTFs were evaluated in this study. The PTFs developed by Rajkai et al. (2004) require sand, silt, clay and organic matter contents and bulk density. Using a dataset of 320 horizons (90 top soil and 230 sub soils) from France, H. Al Majou et al. (2007) developed continuous PTFs to predict the parameters of Mualem-Van-Genuchten equation. The functions require inputs of sand, clay, organic matter, and bulk density. Zacharias et al. (2007) used dataset of 676 measured SWCC (353 top soils, 323 sub soils) to develop continuous PTFs for predicting the parameters of Mualem-Van-Genuchten Eqn. Their dataset was selected from two large international databases: the IGBP-DIS soil database for Pedotransfer function development and the Unsaturated Soil Hydraulic Database (UNSODA). Zacharias et al. (2007) divided the dataset into two ranges according to the sand content and developed two sets of PTFs; one for sand content less than 66.5% and the other set for sand content greater than or equal 66.5%. These PTFs require inputs of sand and clay contents, and
bulk density. Using 63 measured soil water characteristic curves from China, Li et al. (2007) used multiple regressions to develop PTFs for predicting the parameters of Mualem-VanGenuchten Eqn.. They used these functions in the regional simulation of a wheat and maize cropping agro ecosystem for the 1998–1999 rotation year. The PTFs developed by Li et al. (2007) require sand, silt, clay, and organic matter contents, and bulk density. Saxton et al. (1986) simplify the Brooks-Corey (1964) model by dividing the soil water characteristic curve into three ranges from 0 to hb, from hb to 10 kpa, and from 10kpa to 1500 kpa. (Eqn. 10). They developed PTFs to predict the coefficients A and B using 44 soil water characteristics curves in terms of sand and clay contents. θs
for 0 < h < hb
θ10 +
𝜃= h
−1 B
{(A)
(10−h)(θs −θ10 ) (10−hb )
for hb to10 kpa (10)
for 10 < h < 1500 kpa
Recently, Saxton and Rawls (2006) modified the model of Saxton et al. (1986) by dividing the SWCC into three different ranges from 0 to hb, from hb to 33 kpa, and from 33 kpa to 1500 kpa. The developed computer program called SOIL WATER CHARACTERISTICS, which predict the SWCC based on Eqn. 11 in terms of sand, clay, and organic matter content. This program is available online at http://hydrolab.arsusda.gov/soilwater/Index.htm. θs
for 0 < h < hb
θ33 +
𝜃=
(33−h)(θs −θ33 ) (33−hb )
for hb to33 kpa (11)
−1
h B
{(A)
for 33 < h < 1500 kpa
Adhikary et al. (2008) used 600 measured SWCC from India to develop PTFs for predicting the coefficients A and B in the Eqn. of Saxton et al. (1986) (Eqn. 10). Finally, Hutson and Cass (1987) introduced Eqn. (12) as a modified Brooks–Corey type model (Brooks and Corey, 1964), in which water characteristics curve is described as; −1
θs ∗ θ=
h b (a )
θs −
For θ < θi
θ θs ∗h2 ∗(1− i⁄θ ) s
{ Where θi =
For θ ≥ θi
(12)
−2b
θ a2 ∗( i⁄θ ) s
2bθs 2b −b And hi = a ( ) 1 + 2b 1 + 2b
Mayer and Jarvis (1999) used 286 measured SWCC from England to develop PTFs for predicting the parameters of the Hutson and Cass 1987 hydraulic functions. The PTFs developed by Mayer and Jarvis (1999) require particle size distribution, bulk density and organic matter content.
Table 1. Basic characteristics of Pedotransfer functions were evaluated in this study.
No. 1 2 3 4 5 6 7 8 9 10
PTF Gupta & Larson (1979) Rawls & Brakensiek (1982) H. Al Majou et al (2007) 1 Adhikary et al (2008) Homaee et al. (2008) Brakensiek &Rawls (1984) Cosby et al. (1986) Vereecken et al. (1989) Wosten et al.(1999) Rosetta SSC
11 Rosetta SSCBD 12 13 14 15 16 17 18 19 20 21 22
Rubio et al.(2008) 1 Rubio et al.(2008) 2 Rajkai et al. (2004) 1 Rajkai et al. (2004) 2 H. Al Majou et al(2007) 2 Zacharias et al. (2007) Li Y.et al. (2007) Saxton et al. (1986) Saxtom & Rawls (2006) Adhikary et al. (2008) Mayer &Jarvis (1999)
Clay %
Input Parameters Silt Sand OM Porosity BD Out Put % % %
x x x x x x x x x x
x x x x
x
x x
x
x
x
x
x x x x x x
x x x
x x x x
x x x x x x x x x x
x x x x
x
x x x x x x x x
x x
x x x x x
x x
x
VG
x x x x x x x
VG VG M-VG M-VG M-VG M-VG M-VG SAX SAX SAX HC
x x
Θ(h) Θ(h) Θ(h) Θ(h) Θ(h) BC CAM VG VG VG
x
Number of samples Source of development Used in dataset developmen t43 USA 2543 USA, Nation wide 320 France 800 India 185 Iran 2543 USA, Nationwide 1448 USA, Nationwide 182 Belgian 4030 Europe 2134 USA+ Europe + UNSODA database 2134 USA+ Europe + UNSODA database 36 Spain 36 Spain 305 Hungary 305 Hungary 320 France 676 IGBP-DIS + UNSODA databases 63 China 44 USA 3722 USDA/NRCS Database 600 India 286 England
BD, bulk density; OM, organic matter content; Rosetta SSC, artificial neural network needs inputs of % sand, %silt, %clay; Rosetta SSC-BD, artificial neural network needs inputs of % sand, %silt, %clay, bulk density; BC, Brooks & Corey(1964) parameters; CAM, Campbell (1974) parameters; VG, Van Genuchten(1980) parameters; M-VG, Mualem-Van Genuchten parameters; SAX, Saxton (1986) parameters; HC, Hutson and Cass(1987) parameters.
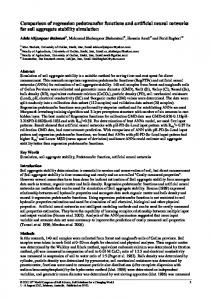
2.2 Soil Database Two large international soil databases were used for evaluation of Pedotransfer functions; SOILVISION database, ISRIC-WISE database. The soil database (SOILVISION) developed by Fredlund et al. (1996), (1998), is an international database collects more than 6000 records. SOILVISION database has measurements of soil water characteristics curves, saturated hydraulic conductivity and other soil physical properties like particle size distribution, bulk density, soil porosity and organic matter content. This database encompasses more than twelve soil databases including UNSODA, Walter Rawls database,…etc. SOILVISION database is available online at http://www.soilvision.com/soilvision_downloads.shtml. In SOILVISION database, soil water content is measured for 7 to 15 pressure heads for each record. A subset of 303 SWCC for United States soils contains 3246 measured soil water contents vs. pressure head were selected. Most of these samples (256 samples) are from the UNSODA database, which is included in the SOILVISION database. The second database used in this study is ISRIC-WISE harmonized global soil profile dataset (Version 3.1) (Batjes, 2008). This database contains 47,833 soil records collected from 149 countries all over the world. In ISRIC-WISE database, soil samples have measurements of particle size distribution, organic matter contents, bulk density and measured soil water content at one , two, or three matric potential heads of 10kpa , 33kpa ,and 1500 kpa. A dataset of 1743 soil samples of United States soils were selected. Most of the US samples contain measured soil water content at one pressure head only. Therefore, the 1743 soil samples have a total of 1754 measured soil water contents. This database is available online at. http://www.isric.org/UK/About+Soils/Soil+data/Thematic+data/Soil+Profile+Data/default.htm. The total number of samples was selected from both datasets is 2046 samples having 5000 measured soil water content vs. pressure head. Description of the database used in this study shown in figure 1 and Table 2.
Table 2. Number of soil water content measurements (N) and mean soil characteristics of data sets corresponding to FAO texture classes. SOILVISION Dataset Texture class
N
Very Fine
Sand
Silt
Clay
OM
ISRIC -WISE Dataset BD
N 3
Sand
Silt
Clay
OM
BD
%
%
%
%
gm/cm
%
%
%
%
gm/cm
89
19.0
20.4
60.6
2.03
1.25
119
6.5
31.6
62.0
0.81
1.73
Fine
140
30.2
31.3
38.4
0.27
1.46
383
18.2
38.8
43.1
0.80
1.63
Medium Fine
151
7.0
74.0
19.0
0.25
1.38
240
7.6
70.6
21.7
1.06
1.44
Medium
1324
50.4
29.2
20.3
0.29
1.42
840
41.9
38.8
19.3
1.23
1.49
Coarse
1542
87.1
7.8
5.1
0.14
1.54
172
80.6
12.2
7.3
0.50
1.57
Total
3246
64.1
21.0
14.9
0.26
1.48
1754
33.4
40.1
26.6
1.01
1.54
3
N, number of observed samples; OM, organic matter content (%); BD, bulk density (gm/cm )
3
100 90 80
Clay content (%)
70
60 50 40 30 20 10 0 0
10
20
30
40
50
60
70
80
90
100
Sand content (%) Figure 1. Distribution of sand and clay contents for the soil database used for evaluating Pedotransfer functions in this study
2.3 Statistical Evaluation Two approaches can be considered to compare the measured and predicted soil water characteristic curves, In the first approach, the chosen validation indices are numerically calculated based on predicted and measured water contents at certain matric potentials (Tombul et al., 2004; Schaap et al., 2004; Givi et al., 2004; Merdun et al., 2005; H. Al Majou et al., 2007). In the second approach, measured and predicted functions are integrated between top and bottom boundaries (Tietje and Tapkenhinrichs, 1993; Cornelis et al., 2001). However, this requires a continuous function to be fitted to the measured θ (h) data pairs. In this study, only the first approach was retained for reasons as outlined below. First, the measured soil water contents in the soil database are discrete and it is preferable to compare it with discrete predicted water content at the same matric potentials. Second, the predictions of the point PTFs are discrete and it is preferable to compare it with discrete measurements at the same matric potential heads. Third, the continuous PTFs can predict the water content as continuous and discrete points as well. Therefore, continuous PTFs can predict the water content at all matric potential as in the measurements. Accuracy of PTFs predictions was evaluated by calculating the coefficient of determination (R2) and the root mean square error (RMSE) between the measured or fitted and predicted soil water contents (Merdun et al., 2005) according to the following equations (Eqns. 13,14).
R2 = 1 −
2
∑N 1 (θ𝑚 −θp )
(13)
2
̅ ∑N 1 (θ𝑚 −θm )
2
∑N 1 (θ𝑚 −θp )
RMSE = √
N
(14)
Where θ𝑚 denotes the measured soil water content (cm3/cm3), θp is the predicted soil water ̅ m is the average of the measured values, and N is the total number of content (cm3/cm3), θ observations. In addition to these two criteria, mean error (ME) was used in the evaluation of prediction accuracy of Pedotransfer functions and calculated as: ME =
∑N 1 (θ𝑚 −θp ) N
(15)
Negative and positive values of ME indicate under- and over-estimation of the predictive model respectively. Also, visual evaluation was made by regressing measured against predicted values of each function.The function was ranked according to the criteria that the PTF has the best performance is the function that has minimum value of root mean square error (RMSE) and maximum value of coefficient of determination (R2).
2.4 Evaluation methods To compare the performance of PTFs under different conditions, the predictions of the 22 Pedotransfer functions were evaluated in three different ways. First, predictions of PTFs were compared to actual measurements for the entire dataset (2046 samples that makes 5000 data pairs of soil water content vs. potential head). Second, to test the performance of PTFs with the variability of soil texture classes, the soil dataset was divided into five texture classes according to the food and agriculture organization (FAO) classification (i.e. very fine, fine, medium fine, medium, coarse classes) then PTFs were evaluated using the soil samples of each texture class. Finally, to test the performance of PTFs with the variability of matric potential heads, PTFs were evaluated at three certain pressure heads (10 kpa, 33kpa, 1500kpa). These pressure heads were selected because all PTFs can predict the SWC at these points. Also, predicted SWC at these point are needed in many hydrological models that require inputs of permanent wilting point, field capacity and available water capacity in the soil.
3 Results and Discussions 3.1 Overall Evaluation of PTFs All Pedotransfer functions (point and continuous PTFs) were evaluated using the entire dataset. The results are summarized in Table 3, Fig. 2, and Fig. 3. Many PTFs showed similar results with a little difference in RMSE up to 0.01 specially in continuous PTFs. Due to little difference in PTFs predictions, the highest two results of point PTFs and the highest four results of continuous PTFs were selected (see Table 3). The result showed that the PTFs developed by Rawls et al. (1982) and Adhikary et al. (2008) showed the best performances from the point PTFs. Also, the models developed by Cosby et al. (1984), Rawls and Brakensiek (1985), Schaap et al. (1998) (Rosetta SSC) and Mayer and Jarvis (1999) showed the highest performance from continuous Pedotransfer functions. For the rest of the functions, some PTFs showed good performance (e.g. H. Al Majou et al., 2007; Rosetta SSC-BD; Zacharias et al.,
2007; Rubio et al., 2008) while the other functions showed poorer performance. Comparing the results of the continuous and point Pedotransfer functions, almost the two groups showed similar results. The similarity between point and continuous PTFs results return to the structure of the dataset, which has more than 70% of the measured water content that can be predicted by the point PTFs. Also, the results showed that the Pedotransfer functions that developed from US soils, performed better than others (e.g. Rawls et al., 1982; Cosby et al., 1984; Brakensiek and Rawls, 1984). Some PTFs developed from non US soils (e.g. Adhikary et al., 2008; H. Al Majou et al., 2007; Wosten et al., 1999; Mayer and Jarvis, 1999) showed good performance. In addition, the volume of development dataset effects the PTFs performance; PTFs that developed from large dataset showed better performance (e.g. Rawls et al., 1982; Wosten et al., 1999; Schaap et al. 2001 (Rosetta SSC, Rosetta SSC-BD); Rawls and Brakensiek, 1985) While the poorer results showed by PTFs that developed from small dataset (e.g. Li et al., 2007, Rubio et al., 2008). Part of results of this study can be compared to results of some previous studies (Table 4).
3.2 Evaluation the Performance of PTFs within the FAO Texture Classes. Table 3 represents the results of evaluation of the 22 PTFs within the FAO texture classes. To test the performance of PTFs with different soil textureclasses, soil database was divided into five subsets according to the FAO classification system. The PTFs predictions were compared to measured soil water content for each soil subset. The results showed that Many PTFs have similar performance with a little difference in RMSE up to 0.01 specially in continuous PTFs. Due to little difference in PTFs results, the highest two results of point PTFs and the highest four results of continuous PTFs were selected The results showed that the functions that had good performance in the overall evaluation also had good performance in different texture classes. for point Pedotransfer functions,the PTFs developed by Rawls et al. (1982), which had the highest performance with the entire dataset, had the best performance in medium fine, medium and coarse soils. The PTF developed by Adhikary et al. (2008) have the highest performance in very fine, fine, medium fine soils. The PTF developed by Gupta and Larson (1979) perform well in medium and coarse soils. The PTF developed by H. Al Majou et al. (2007) has good performance in fine soils and the PTF developed by Homaee et al. (2008) has good performance in very fine soils. For continuous PTFs, the functions that had the best performance with the entire dataset (Cosby et al. (1984), Brakensiek and Rawls (1984), Schaap et al. (1998) (Rosetta SSC) and Mayer and Jarvis (1999) almost had the pest performance in all texture classes. The PTFs developed by Cosby et al. (1984) had the best performance in all texture classes. The PTFs developed by Rawls and Brakensiek (1985) had a good performance in fine, medium fine and coarse soils. The PTFs developed by Zacharias et al. (2007) and by Schaap et al. (1998) (Rosetta SSC-BD) had good performance in medium and coarse soils. The PTFs developed by Saxton et al. (1986) and Saxton and Rawls (2006) had good performance in very fine soils. Finally, the PTFs developed by Mayer and Jarvis (1999) had good performance in very fine and fine soils. As mentioned before, the PTFs developed from US soils (Cosby et al., 1984;
Rawls and Brakensiek, 1985) performed better than other PTFs developed from non US soils. Also the PTFs developed from larger dataset (Rawls et al., 1982; Wosten et al., 1999; Saxton and Rawls, 2006) perform better than other PTFs developed using small datasets.
Table 3. Goodness of fit of point and continuous PTFs of soil water characteristics curve in different texture classes. Very Fine Soils 2 ME RMSE R
Fine Soils Medium Fine Soils Medium soils Coarse Soils Total dataset 2 2 2 2 2 RMSE R ME RMSE R ME RMSE R ME RMSE R ME RMSE R Point Pedotransfer Functions Gupta & Larson (1979) 0.093 0.134 -0.453 0.061 0.098 -0.113 0.086 0.106 0.344 0.034 0.087 0.415 0.022 0.077 0.283 0.043 0.091 0.452 Rawls et al. (1982) 0.063 0.097 0.154 0.028 0.066 0.493 0.006 0.063 0.751 -0.006 0.079 0.493 -0.005 0.073 0.309 0.005 0.075 0.622 H Al Majou et al. (2007) -0.003 0.081 0.426 -0.021 0.066 0.500 -0.043 0.083 0.607 -0.038 0.089 0.380 0.005 0.084 0.128 -0.024 0.083 0.557 Adhikary et al. (2008) -0.001 0.067 0.557 -0.018 0.061 0.577 -0.026 0.065 0.728 -0.046 0.091 0.336 -0.038 0.079 0.145 -0.035 0.080 0.570 Homaee et al. (2008) -0.007 0.076 0.437 0.014 0.070 0.445 0.095 0.122 0.043 0.009 0.088 0.385 -0.047 0.099 -0.345 0.010 0.091 0.443 Continuous Pedotransfer Functions Brak. & Rawls (1984) -0.013 0.106 0.234 -0.008 0.073 0.345 0.000 0.068 0.772 0.022 0.084 0.448 0.019 0.081 0.431 0.015 0.082 0.572 Cosby et al. (1984) 0.004 0.082 0.539 -0.015 0.066 0.472 -0.015 0.068 0.767 0.002 0.080 0.498 -0.016 0.080 0.454 -0.007 0.078 0.614 Vereecken et al. (1989) 0.003 0.088 0.471 0.050 0.092 -0.038 0.114 0.161 -0.303 0.107 0.143 -0.587 0.126 0.159 -1.159 0.104 0.144 -0.316 Wosten et al. (1999) 0.027 0.098 0.348 0.026 0.076 0.300 0.015 0.085 0.637 -0.008 0.082 0.474 -0.031 0.123 -0.289 -0.009 0.098 0.387 Rosetta SSC 0.057 0.100 0.319 0.046 0.084 0.127 0.031 0.071 0.747 0.023 0.084 0.449 0.005 0.083 0.413 0.022 0.083 0.557 Rosetta SSC-BD 0.075 0.118 0.055 0.065 0.096 -0.119 0.041 0.080 0.683 0.023 0.081 0.490 0.009 0.079 0.457 0.026 0.084 0.553 Rubio et al. (2008) (1) 0.069 0.105 0.253 0.054 0.088 0.060 -0.016 0.089 0.601 0.026 0.087 0.417 -0.027 0.098 0.181 0.009 0.092 0.466 Rubio et al. (2008) (2) 0.067 0.124 -0.049 -0.001 0.078 0.254 -0.043 0.104 0.456 -0.082 0.120 -0.117 -0.193 0.216 -2.991 -0.102 0.156 -0.543 Rajkai et al. (2004) (1) 0.023 0.111 0.164 0.003 0.066 0.471 0.025 0.068 0.771 -0.042 0.090 0.364 -0.171 0.222 -3.215 -0.073 0.147 -0.379 Rajkai et al. (2004) (2) 0.112 0.143 -0.379 0.112 0.132 -1.132 0.103 0.140 0.015 0.073 0.108 0.095 -0.043 0.139 -0.666 0.041 0.126 -0.011 H Al-Majou et al. 0.054 0.113 0.135 0.016 0.081 0.188 0.047 0.113 0.356 -0.033 0.114 -0.018 -0.102 0.199 -2.404 -0.042 0.147 -0.366 (2007) Zacharias et al. (2007) 0.122 0.151 -0.557 0.068 0.100 -0.222 0.010 0.081 0.673 0.011 0.080 0.502 -0.020 0.078 0.480 0.011 0.086 0.532 Li et al. (2007) 0.226 0.278 -4.263 0.085 0.153 -1.883 -0.030 0.162 -0.314 -0.127 0.182 -1.584 -0.196 0.238 -3.866 -0.106 0.204 -1.642 Saxton et al. (1986) -0.003 0.082 0.548 0.055 0.083 0.157 0.121 0.147 -0.076 0.087 0.119 -0.094 0.052 0.099 0.166 0.071 0.110 0.231 Saxtom , Rawls (2006) -0.019 0.088 0.472 0.020 0.081 0.202 0.082 0.119 0.288 0.037 0.111 0.038 -0.084 0.154 -1.036 -0.005 0.125 0.008 Adhikary et al. (2008) 0.033 0.105 0.258 -0.016 0.103 -0.291 -0.105 0.297 -3.405 -0.040 0.166 -1.146 -0.008 0.087 0.351 -0.029 0.152 -0.461 Mayer &Jarvis (1999) 0.008 0.088 0.472 0.003 0.075 0.316 0.004 0.082 0.664 -0.014 0.084 0.454 -0.006 0.082 0.421 -0.007 0.082 0.569 ME
Note: the marked cells show the first and second rank in the point PTFs, first four ranks in the continuous PTFs. ME, mean error; RMSE, root mean square error; R2, coefficient of determination
Figure 2. Measured versus predicted SWC of five point and six continuous PTFs represent the variation of soil water content predictions with different texture classes.
Figure 3. Measured versus predicted SWC of eleven continuous PTFs represent the variation of soil water content predictions with different texture classes.
Table 4. Comparison of nine PTFs results with results of previous studies: root mean square error (m3 m-3) for seven independent datasets. References
Tietje and Hennings et Schaap et Cornelis et Ungaro and Schaap et Current Tapk.(1993) al. (1997) al. (1998) al. (2001) Calzolari al. (2004) study
No. of samples Source of dataset No. of tested PTFs Gupta & Larson (1979) Rawls et al. (1982) Brakensiek &Rawls (1985) Cosby et al. (1984) Vereecken et al. (1989) Wosten et al. (1999) Rosetta SSC Rosetta SSC-BD Saxton et al. (1986)
1116 (Germany) 13 0.0591 0.0631 0.0751
1177
0.0668 0.0531 ------------------------0.0796
(2001)
------0.091 0.080
1209 (USA) 8 ------------0.101
69 Belgium 9 0.0602 0.0653 0.0774
139 (Italy) 9 -------0.092 0.0882
47435 (NRCS) 11 ----------------0.0634
5000 (USA) 22 0.091 0.075 0.082
-------0.036 ---------------------0.078
0.111 0.098 -------0.104 0.087 --------
--------0.0412 0.0518 -------------------------
--------0.0915 ---------------------------0.0698
0.0616 0.0657 0.0575 0.0635 0.0641 ---------
0.078 0.144 0.098 0.083 0.084 0.110
3.3 Evaluation the Performance of PTFs at certain Matric Potential Heads. Table 5 represents the statistical comparison between the measured and predicted soil water contents from the 22 PTFs at three matric potential heads; 10, 33, and 1500 kpa.. Three subsets were created from the soil database. These three subsets have water contents measured at 10 kpa, 33 kpa, and 1500 kpa matric potentials respectively. . These potential heads represent the near saturated water content (θ10), the field capacity (θ33), and the wilting point (θ1500) were selected due to the importance of these variables, which are needed as inputs to many hydrological models. As mentioned above, the highest two PTFs from the point Pedotransfer functions and the highest four PTFs from the continuous Pedotransfer functions in performance were selected (see Table 4). The water content at matric potential of 10 kpa is best predicted by PTFs developed by Adhikary et al. (2008) and Rawls et al. (1982) respectively as a point PTFs. better results can be obtained from Rosetta SSC, Cosby et al. (1984), Rosetta SSC-BD, Rawls and Brakensiek et al. (1985) as a continuous Pedotransfer functions -. However, the continuous PTFs show better performance than point PTFs especially in the wet part of the soil water characteristic curve. The water content at field capacity (θ33) can be predicted by PTFs developed by Gupta and Larson (1979) and Rawls et al. (1982) respectively as a point PTFs. Better performance showed by PTFs of Cosby et al. (1984), Mayer and Jarvis (1999), Adhikary et al. (2008) and Wosten et al. (1999) as a continuous Pedotransfer functions. The water content at wilting point (θ1500) can be predicted by PTFs of Rawls et al. (1982) and Homaee et al. (2008) respectively as a point PTFs. better results showed by PTFs of H. Al Majou et al. (2007), Vereecken et al. (1989), Brakensiek and Rawls (1984) and Cosby et al. (1984)as a continuous Pedotransfer functions. The results indicated that the PTFs perform better with the higher potential heads and this could be due to the little error in measurements of water content at these pressures.
Table 5. Goodness of fit of five point and seventeen continuous PTFs of soil water characteristics curve at different matric potentials. ME Gupta & Larson (1979) 0.032 Rawls et al. (1982) 0.025 H Al Majou et al. (2007) -0.016 Adhikary et al. (2008) -0.023 Homee et al. (2008) -0.013 Brak. and Rawls (1984) 0.017 Cosby et al. (1984) -0.009 Vereecken et al. (1989) 0.133 Wosten et al. (1999) -0.012 Rosetta SSC 0.005 Rosetta SSC-BD 0.015 Robio et al. (2008) (1) 0.018 Robio et al. (2008) (2) -0.103 Rajkai et al. (2004) (1) -0.099 Rajkai et al. (2004) (2) 0.051 H. Al-Majou et al. -0.050 (2007) Zacharias et al. (2007) 0.010 Li et al. (2007) -0.131 Saxton et al. (1986) 0.074 Saxtom , Rawls (2006) -0.077 Adhikary et al. (2008) -0.066 Mayer &Jarvis (1999) -0.003
10 Kpa 33 Kpa 2 2 RMSE R ME RMSE R Point Pedotransfer Functions 0.018 0.076 0.562 0.095 0.473 0.087 0.563 -0.003 0.078 0.538 0.093 0.493 -0.043 0.089 0.392 0.086 0.566 -0.031 0.083 0.465 0.115 0.231 0.017 0.099 0.243 Continuous Pedotransfer Functions
ME
1500 Kpa 2 RMSE R
0.076 0.011 -0.002 -0.040 0.002
0.102 0.058 0.066 0.072 0.063
-0.391 0.551 0.397 0.318 0.471
0.088 0.081 0.162 0.096 0.081 0.086 0.100 0.171 0.179 0.153 0.152
0.544 0.615 -0.533 0.458 0.620 0.571 0.419 -0.711 -0.860 -0.360 -0.350
0.048 0.019 0.122 0.039 0.051 0.068 0.036 -0.041 -0.031 0.092 0.051
0.094 0.081 0.146 0.089 0.089 0.100 0.100 0.128 0.117 0.136 0.102
0.318 0.497 -0.638 0.394 0.386 0.231 0.234 -0.252 -0.046 -0.426 0.204
0.003 -0.009 -0.002 0.014 0.053 0.055 -0.026 -0.091 -0.002 0.028 0.001
0.061 0.062 0.059 0.063 0.082 0.083 0.083 0.130 0.082 0.070 0.058
0.496 0.495 0.535 0.468 0.113 0.089 0.087 -1.265 0.113 0.340 0.551
0.094 0.220 0.119 0.128 0.140 0.090
0.481 -1.818 0.173 0.044 -0.147 0.524
0.061 -0.009 0.099 0.115 0.016 0.024
0.114 0.175 0.132 0.147 0.089 0.082
0.006 -1.342 -0.340 -0.649 0.398 0.481
0.019 0.006 0.047 0.050 0.048 -0.030
0.073 0.146 0.078 0.080 0.077 0.073
0.282 -1.845 0.195 0.151 0.215 0.292
Note: the marked cells show the first and second rank in the point PTFs, first four ranks in the continuous PTFs. ME, mean error; RMSE, root mean square error; R2, coefficient of determination.
Conclusions The evaluation and comparison of the twenty two Pedotransfer functions that were considered in this study enabled us to draw the following conclusions about the PTFs. The function developed by Rawls et al. (1982) showed the best performance among the five point Pedotransfer functions followed by the PTF developed by Adhikary et al. (2008). The Pedotransfer functions developed by Cosby et al. (1984), Brakensiek and Rawls (1985), Mayer and Jarvis (1999), and Schaap et al. (2001) (Rosetta SSC) showed the best performances among the seventeen continuous PTFs considered in this study. Also, the performance of the continuous Pedotransfer functions is almost better than the performance of the point PTFs due to its continuous results. Another conclusion, the performance of Pedotransfer functions changes with the variation of soil texture classes and with the variation of the potential heads. The Pedotransfer functions that showed a good performance when evaluated using the entire dataset are almost the PTFs that showed the good performance in different texture classes and in different matric potentials. The results indicated that the PTFs perform better with the higher potential heads and this could be due to the little error in measurements of water content at these pressures.
References Adhikary, P. P., D. Chakraborty, N. Kalra, C. B. Sachdev, A. K. Patra, S. Kumar, R. Tomar, P. Chandna, D. Raghav,, K. Agrawal, and M. Sehgal. 2008. Pedotransfer functions for predicting the hydraulic properties of Indian soils. Australian Journal of Soil Research, 46, 476–484. Baker, L., D. Ellison. 2008. Optimization of Pedotransfer functions using an artificial neural network ensemble method. Geoderma 144, 212–224. Baker, L. 2008. Development of class pedotransfer functions of soil water retention: A refinement. Geoderma 144, 225–230. Batjes NH 2008. ISRIC-WISE Harmonized Global Soil Profile Dataset (Ver. 3.1). Report 2008/02, ISRIC – World Soil Information, Wageningen, 59p (with dataset) Bouma, J. 1989. Using soil survey data for quantitative land evaluation. Adv. Soil Sci. 9:177– 213. Brakensiek, D. L., W. J. Rawls, G. R. Stephenson. 1984. Modifying SCS hydrologic soil groups and curve numbers for rangeland soils. ASAE paper no. PNR-84203, St. Joseph, MI. Brooks, R.H., and A.T. Corey. 1964. Hydraulic properties of porous media. Hydrology Paper 3. Colorado State Univ., Fort Collins, CO. Campbell, G.S. 1974. A simple method for determining nsaturated conductivity from moisture retention data. Soil Sci. 117, 311–314. Cornelis, W. M., J. Ronsyn, M. V. Meirvenne, and R. Hartmann. 2001. Evaluation of Pedotransfer functions for predicting the soil moisture retention curve. Soil Sci. Soc. Am. J. 65, 638–648. Cosby, B. J., G. M. Hornberger, R. B. Clapp, and T. R. Ginn. 1984. A statistical exploration of soil moisture characteristics to the physical properties of soils. Water Resources Research 20, 682–690. Givi, J., S.O. Prasher, and R.M. Pate. 2004. Evaluation of pedotransfer functions in predicting the soil water contents at field capacity and wilting point. Agricultural Water Management 70: 83–96. Gupta, S.C., and W.E. Larson. 1979. Estimating soil water retention characteristics from particle size distribution, organic matter percent and bulk density. Water Resour. Res. 15:1633– 1635. H. Al Majou et al., C. R. Geoscience 339 (2007). Variation of the water-retention properties of soils: Validity of class-pedotransfer functions. C. R. Geoscience 339: 632–639. Homaee, M., and A. F. Firouzi. 2008. Deriving point and parametric Pedotransfer functions of some gypsiferous soils. Australian Journal of Soil Research, 46, 219–227. Hutson, J.L., and A. Cass. 1987. A retentivity function for use in soil water simulation models. J. Soil Sci. 38, 105– 113. Kern, J.S. 1995. Evaluation of soil water retention models based on basic soil physical properties. Soil Sci. Soc. Am. J. 59:1134–1141. Leij, F.J., W.J. Alves, M.Th. van Genuchten, and J.R. Williams. 1996. Unsaturated soil hydraulic database, UNSODA 1.0 user’s manual. Report EPA/600/R-96/095. U.S. EPA, Ada, OK. Li, Y., D. Chen, R. E. White, A. Zhu, and J. Zhang. 2007. Estimating soil hydraulic properties of Fengqiu County soils in the North China Plain using pedo-transfer functions. Geoderma 138 : 261–271.
Mayr, T., N. J. Jarvis. 1999. Pedotransfer functions to estimate soil water retention parameters for a modified Brooks–Corey type model. Geoderma 91, 1–9. Merdun, H., O. Cınar, R. Meral, and M. Apan. 2005. Comparison of artificial neural network and regression pedotransfer functions for prediction of soil water retention and saturated hydraulic conductivity. Soil & Tillage Research 90 , 108–116. Mualem, Y. 1984. A modified dependent-domain theory of hysteresis. Soil Science, 137: 283– 291. Nemes, A., W. J. Rawls, and Y. A. Pachepsky. 2005. Influence of Organic Matter on the Estimation of Saturated Hydraulic Conductivity. Soil Sci. Soc. Am. J. 69:1330–1337. Nemes, A. and W. J. Rawls. 2006. Evaluation of different representations of the particle-size distribution to predict soil water retention. Geoderma 132 (2006) 47–58. Rajkai, K., S. Kabos, and M.Th. van Genuchten. 2004. Estimating the water retention curve from soil properties: comparison of linear, nonlinear and concomitant variable methods. Soil & Tillage Research 79, 145–152. Rawls, W.J., D.L. Brakensiek, and K.E. Saxton. 1982. Estimation of soil water properties. Trans. ASAE 25:1316–1320. Rubio, C. M. 2008. Applicability of Site-Specific Pedotransfer Functions and Rosetta Model for the Estimation of Dynamic Soil Hydraulic Properties under Different Vegetation Covers. J Soils Sediments 8 (2) 137–145. Rubio, C. M., P. Llorens, and F. Gallart. 2008. Uncertainty and efficiency of pedotransfer functions for estimating water retention characteristics of soils, European Journal of Soil Science, 59, 339–347. Saxton, K.E., W.J. Rawls, J.S. Romberger, and R.I. Papendick. 1986. Estimating generalized soil water characteristics from texture. Soil Sci. Soc. Am. J. 50, 1031–1036. Saxton, K. E. and W. J. Rawls. 2006. Soil Water Characteristic Estimates by Texture and Organic Matter for Hydrologic Solutions. Soil Sci. Soc. Am. J. 70:1569–1578. Schaap, M. G., A. Nemes, and M. Th. van Genuchten. 2004. Comparison of Models for Indirect Estimation of Water Retention and Available Water in Surface Soils. Vadose Zone Journal 3:1455–1463. Schaap, M. G., and F.J. Leij. 1998. Using neural networks to predict soil water retention and soil hydraulic conductivity. Soil Tillage Res. 47:37–42. Schaap, M. G., and F.J. Leij. M. Th. van Genuchten. 1998. Neural Network Analysis for Hierarchical Prediction of Soil Hydraulic Properties. Soil Sci. Soc. Am. J. 62:847-855. Schaap, M. G., F. G. Leij, and M. Th. Van Genuchten. 2001. ROSETTA: a computer program for estimating soil hydraulic parameters with hierarchical pedotransfer functions. Journal of Hydrology 251, 163–176. Thakur, V. K., S. Sreedeep, and D. N. Singh. 2007. Evaluation of Various Pedo-Transfer Functions for Developing Soil-Water Characteristic Curve of a Silty Soil. Geotechnical Testing Journal, Vol. 30, No. 1 Paper ID GTJ100455. Tietje, O., and M. Tapkenhinrichs. 1993. Evaluation of pedo-transfer functions. Soil Sci. Soc. Am. J. 57:1088–1095. Ungaro, F., C. Calzolari. 2001. Using existing soil databases for estimating retention properties for soils of the Pianura Padano-Veneta region of North Italy. Geoderma 99: 99–121.
Ungaro, F., C. Calzolari, and E. Busoni. 2005. Development of Pedotransfer functions using a group method of data handling for the soil of the Pianura Padano–Veneta region of North Italy: water retention properties Geoderma 124, 293–317. Van Genuchten, M.Th. 1980. A closed-form equation for predicting the hydraulic conductivity of unsaturated soils. Soil Sci. Soc. Am. J. 44:892–898. Vereecken, H., J. Maes, J. Feyen, and P. Darius. 1989. Estimating the soil moisture retention characteristic from texture, bulk density and carbon content. Soil Sci. 148:389–403. Wosten, J. H. M., A. Lilly, A. Nemes, and C. L. Bas. 1999. Development and use of a database of hydraulic properties of European soils. Geoderma 90, 169–185. Zacharias, S., G. Wessolek. 2007. Excluding Organic Matter Content from Pedotransfer redictors of Soil Water Retention. Soil Sci. Soc. Am. J. 71:43-50.