strategic goals of the organizations. Index TermsâProject Portfolio Method, PPM, Product Selection,. Comparative Methods, Strategic Planning Methods.
“National Conference on Trends in Mechanical Engineering (TIME-15), held at JNTUACE, Ananthapuramu, on 23rd September, 2015”
EVALUATION OF PRODUCT SELECTION METHODS USING PPM TECHNIQUES Sirivella Vijaya Bhaskar Principal & Professor in Mechanical Engineering DBS Institute of Technology, Kavali, SPSR Nellore, AP, India Abstract- Selecting the right product to sustain in highly volatile market environment with the given limited available resources such as limited budget, time, and human resources is both critical and imperative. This paper is aimed to evaluate and establish the application intensity and most widely used selection method(s) in selecting products with reference to strategic planning and comparative methods of PPM as part of production planning and control. It presents the research findings along with a comprehensive view on selecting projects in the project portfolio perspective. This exploratory research study endeavors its evaluation based on the data analysis and concludes statistical analysis using cumulative weighed average and chi-square analysis techniques. The results reveal that the application intensity of product selection methods especially strategic planning method is moderate and furthermore it notifies that the inevitability of changing the product selection process in order to balance the financial and non-financial benefits to meet the strategic goals of the organizations. Index Terms—Project Portfolio Method, PPM, Product Selection, Comparative Methods, Strategic Planning Methods
I. INTRODUCTION In today’s dynamic and belligerent highly technology used business environment, formulating the right investment decisions with the limited available resources is both imperative and obscure. Accelerated investments and innovations in the selection of products offer prospects for managing businesses in such a way that they differ from the past and leads to where organizations want or need to go. It is a real challenge to select the right product(s) that contributes the utmost value and ensures the alignment with the firms’ strategic business objectives. It is very common in the corporate world that they frequently propose more products than what can be implemented and moreover with the limited resources. This implies that top executives have to decide which products are to be implemented and in which sequence these products will be initiated. Given the limited availability of resources such as time, budget, production capacity and human resources, not all proposed products can be implemented concurrently. Each product has to be evaluated in order to determine its impact on business and set the priority. So companies are compelled to select the right products and prioritize among them to align with the business goals and eventually to increase the return on investment. Organizations’ strategies in the era of advanced information technology are focused on leveraging all alternatives to reduce the redundant products/projects, to allocate resources in high yielding projects, to minimize the risks and to rationalize the critical business processes in order
NC-TIME’15
to improve the productivity with better performance. In this situation, current products/projects are continually being monitored, and products/projects under consideration and sanctioned will be prioritized then added, changed, and removed from the projects inventory in response to business activity and changing market conditions and customers’ needs[1]. The traditional management techniques weren’t able to deal with these kinds of activities and thus a new Project Portfolio Management (PPM) paradigm has been emerged. A. Evaluation of Investments - PPM Project portfolio management (PPM) is a dynamic decision process, whereby a business’s list of active projects is constantly up-dated and revised. In his process, new products/projects are evaluated, selected and prioritized; existing projects may be accelerated, killed or de-prioritized; and resources are allocated and reallocated to the active projects. The portfolio decision process is characterized by uncertain and changing information, dynamic opportunities, multiple goals and strategic considerations, interdependence among projects, and multiple decision makers and locations[2]. Evaluating information technology investments has been a central concern in information systems research and practice for decades [3]. Determining the priorities of products/ projects is an essential step in the planning process, because the limited availability of resources prohibits the simultaneous execution of all proposed products/projects. Each project has to be evaluated using selection/prioritized method(s) in order to determine its value and priority. Working on the right projects at the right time is crucial to sustain a competitive advantage, yet many organizations struggle with allocating limited resources and assets wisely[4]. PPM helps organizations to select and manage an optimal portfolio of projects that maximizes the organization's revenues, and responsiveness while keeping the projects aligned with strategic business goals and objectives. In any organization, product selection is a significant and crucial decision making process in order to select the best-fit product to meet the organizational strategic objectives. According to Ghasemzadeh et al., [5] many organizations have been making serious efforts to analyze the project proposals in order to generate estimates and evaluations for choosing project portfolios. Selection methods facilitate in evaluating the qualitative and quantitative indicators of an individual project and/or a set of projects, whose results are consulted by the selection team for their decision making on project portfolio selection. Logically, the good selection methods, whether nonnumeric or numeric, should have six
800
“National Conference on Trends in Mechanical Engineering (TIME-15), held at JNTUACE, Ananthapuramu, on 23rd September, 2015”
basic characteristics: realism, capability, flexibility, ease of use, cost-effectiveness and ease of computerization. The literature reveals that a number of project selection methods have been developed to ensure a deliberate process of selection and determining priorities. The popularity of portfolio methods that industry uses provides insights and guides to others [6]. The current study attempts to assess and establish the application levels of four project portfolio selection methods: Financial Methods, Comparative Methods, Strategic Planning Methods and Optimization Methods. The study also appraises and establishes the most widely used selection method(s) with the help of data analysis of primary data that was collected through a questionnaire. II. PROJECT SELECTION METHODS Strategic planning and comparative methods play an important role in selecting products/projects that help in achieving the strategic business goals of the organizations. The portfolio matrices generally are used in decision making process with the help of predefined baselines of the strategies. Even though there are many methods available, decision trees, bubble diagrams and balance scorecard methods are selected for the study. A. Strategic Planning Methods There are many strategic planning methods available to select suitable products/projects, but the current research study is limited to Decision Trees, Bubble Diagrams and Balanced Scorecard methods. A.1 Decision Tree Decision tree is graphical representation of decision problem wherein the alternatives to decisions and possible outcomes to uncertainties are represented sequentially in a tree-like diagram. A decision tree can be used as an aid for optimizing projects that require a sequence of choices using a computational approach based on dynamic programming. In corporate finance, decision trees are used to describe how project management decisions influence the cash flows of the project [7]. A.2 Bubble Diagrams According to Cooper et al.[8], recently developed bubble diagrams for project mapping are mainly based on the concepts of BCG matrix as portfolio management and GE/McKinsey matrix as portfolio analysis, and used to present project portfolio for resource allocation (i.e. they are not decision models). Bubble diagrams, display projects on a twodimensional grid as bubbles (the size of the bubbles denotes the spending on each endeavor). The axes vary but the most popular chart is the risk-reward bubble diagram, where NPV is plotted versus probability of technical success. Then seek an appropriate balance in numbers of projects (and spending) across the four quadrants.
NC-TIME’15
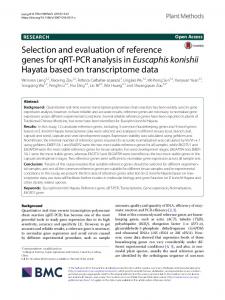
Fig. 1. Risk and Reward Bubble Diagram [8]
As shown in figure 1 for an example of the risk-reward diagram of a company, within the two dimensions, there are four quadrants for allocation of projects, namely pearls - upper left quadrant (i.e. potential start products, projects with high chance of success and high rewards; oysters - lower left quadrant (i.e. projects with high expected payoff, but low probability of technical success; bread and butter - upper right quadrant (i.e. small, simple projects with a high success probability but low reward); and white elephant- low right quadrant (i.e. low success and low reward projects). The bubble or circle represents projects. The size of the bubble or circle denotes the resource allocated to each project. When adding or deleting the new projects, resources strategically considered to share among projects make the size of the bubble or circle change as the total sum of the areas of the circles must be a constant. A.3 Balanced Score Card In 1996 Robert Kaplan and David Norton [9] have developed a business process called “Balanced Scorecard” for translating an organization's mission and strategy statements into a quantitative system for measuring organizational performance. Balanced scorecards collect diverse information intended to "balance" the traditional, but narrow, financial view of performance. The Balanced Scorecard goes beyond standard financial measures to include the following additional perspectives: the customer perspective, the internal process perspective, and the learning and growth perspective. Financial perspective - includes measures such as operating income, return on capital employed, and economic value added. Customer perspective - includes measures such as customer satisfaction, customer retention, and market share in target segments. Business process perspective - includes measures such as cost, throughput, and quality. These are for business processes such as procurement, production, and order fulfillment. Learning & growth perspective - includes measures such as employee satisfaction, employee retention, skill sets, etc. The Balanced Scorecard framework is depicted in the following diagram:
Fig. 2. The Balanced Scorecard Framework [9]
The balanced scorecard method presents a framework for top executives to use in linking the different types of measurements together. As shown in figure 2, there are four perspectives: the customer's perspective, an internal business perspective, an innovation and learning perspective, and the financial (or shareholder's) perspective. Using the global corporate strategy as a manual the managers derive three to five goals related to each perspective and then extend specific
801
“National Conference on Trends in Mechanical Engineering (TIME-15), held at JNTUACE, Ananthapuramu, on 23rd September, 2015”
measures to support each goal. Ideally, the scorecard helps managers to clarify their vision for the organization and translate that vision into measurable actions that employees can understand. B. Comparative Methods There are many methods available in comparative methods to select suitable products/projects, but the current research study is limited to Q-Sort, Delphi Model, Check-List Model, Un-Weighted Scoring Model, and Weighted Scoring Model. B.1. Q-Sort A method for analyzing the opinions of a group based on a series of rankings (sorts) produced by the individual group members. The Q sort was originally developed within the field of psychology as a means for measuring correlations among the views expressed by different people. The process for ranking projects via a Q sort involves a series of "rounds," with each round consisting of individual assessments followed by a group discussion. To prepare for a Q sort, a short description of each candidate project is written on a card. The resulting card deck is reproduced, and the copies are distributed to group members. Next, each member of the group individually ranks the projects by ordering his or her cards (alternatively, each individual may sort the cards into categories, e.g., highest priority, moderate priority, lower priority). A facilitator then tabulates the results and displays them to the group as a chart graph. B.2. Delphi Model Delphi may be characterized as a method for structuring a group communication process so that the process is effective in allowing a group of individuals, as a whole, to deal with a complex problem. This method used in groups to reduce biases in the group estimates or other group judgments. The Delphi method is typically conducted as an iterative process wherein a facilitator repeatedly obtains judgments from each member of the group interspersed with feedback of group responses and opinions. Group members typically remain anonymous with regard to the opinions expressed and interact through the facilitator in order to reduce biases in the estimates produced. B.3. Check-List Model With a checklist model, the criteria are expressed as yes/no statements (e.g., "Payback period less than 5 years", "Project involves no safety risk") listed in a table. Individuals then evaluate each project by indicating (checking) those criteria from the list that the project satisfies. The checks are counted for each project, and the totals are used as the measure for ranking the projects. Since a check counts as a score of "1" when totaling scores, the checklist model is sometimes referred to an un-weighted, 0/1 factor model. B.4. Un-Weighted Scoring Model Scoring models involve quantifying the relative importance of the attribute by assigning weights. An un-weighted scoring model is one of scoring models of PPM and is similar to a checklist model, but allows for gradations in project scores. Instead of expressing the criteria as yes/no statements, a scale is used. Often, a 5-point scale is selected, where 5 means the
NC-TIME’15
project is very good with respect to the criterion, 4 means good, 3 means fair, 2 means poor, and 1 means very poor. The scores are summed, and the totals are used as the measure of project attractiveness. B.5. Weighted Scoring Model A scoring model is a weighted scoring model if it allows weights to be assigned to the criteria. A weighted scoring model has the mathematical form:
where Sj is the total score for the jth project, N is the number of criteria, wi is the weight assigned to the ith criterion, and sij is the score of the jth project on the ith criterion. The weights are typically assumed to represent some concept of the relative importance of each criterion. Methods used for assigning weights include paired comparison, AHP and the swing weight method. III. DATA COLLECTION AND METHODS A pre-tested, well structured questionnaire was prepared and distributed to selected respondents. The questionnaire was designed to record the responses from the respondents on a five-point Likert-scale. Further the collected field data was processed and prepared the primary data which is the basis for the further data analysis and conclusions. For the present, cumulative weighted average and chi-square methods were selected statistical analysis to draw the conclusions of the study. Hence the collected data was segregated and converted in to cumulative weighted average for strategic planning methods and comparative methods. IV. RESULTS AND DISCUSSION A. Strategic Planning Methods The prime data has been segregated and prepared Cumulative Weighted Average (CWA). The results were analyzed and depicted in figure 3. The results revealed that balanced scorecard method is most widely used method across all other strategic planning methods.
Fig. 3. Application Levels of Strategic Planning Methods
The analysis was also carried-out using chi-square test on primary data to arrive at meaningful interpretations with reference to application levels of strategic planning methods and the chi-square values are presented in table 3. TABLE 3 CHI-SQUARE VALUES OF STRATEGIC PLANNING METHODS
802
Alpha-Level (Significance Level)
Value
Degree of Freedom
Critical Value (Table Value)2Table
Criteria
Calculated Chi-Square Value 2Cal
“National Conference on Trends in Mechanical Engineering (TIME-15), held at JNTUACE, Ananthapuramu, on 23rd September, 2015”
Strateg ic Planni 90.531 150.5461 70 0.05 ng 2 Metho ds The calculated and table values of Chi-Square are visually presented in the Figure 4.
Fig.4.
Chi-Square Diagram of Strategic Planning Methods
The chi-square value of 90.5312 falls under category of null hypothesis rejection area and it is confirming that balanced score card method is significantly impacting in selection of the projects/products. B. Comparative Methods The responses of selected respondents were analyzed and illustrated in figure 5. The results showing that weighted scoring model was most widely accepted comparative method in the selection of products/projects followed by check-list model.
Fig. 4. Application Levels of Comparative Methods
Chi-square analysis on primary data was conducted and chisquare values are presented in table 4 and visual graph was presented in figure 5.
Compar ative 271. 126. 10 0.05 Method 855 577 2 s The calculated Chi-Square value (Cal for 102 d.f at 5% of significance level is higher than the critical value (table value) (2TableValue), hence Cal is falling under null hypothesis (H0) rejection region. This is confirming that method is weighted scoring model is principally impacting in selection of the projects/products.
Fig.5. Chi-Square Diagram of Comparative Methods IV. CONCLUSIONS The analytical study findings in coherence with the objective of exploring and establishing the conceptual application levels of strategic planning and comparative methods of project portfolio selection methods, the research establishes that strategic planning methods have moderate application levels and comparative methods have higher application levels with reference to Project Portfolio Selection Methods. The balanced scorecard method is most widely used strategic planning method and weighted scoring model was significantly accepted comparative method followed by checklist model in the selection of products/projects. REFERENCES [1] Randy Perry, Eric Hatcher, How Project and Portfolio Management Solutions Are Delivering Value to Organizations, Ca WhitePaper, IDC, Framingham, Boston, MA, Sept 05, 2008 [2] Cooper G. Robert, Edgett J. Scott, Kleinschmidt E.J.,” New Product Portfolio Management: Practices and Performance”, Journal of Product Innovation Management, Vol 16, No. 4, pp 333–351, July 1999 [3] Starling Hunter, Kevin Kobelsky, Vernon J. Richardson, Information Technology and the Volatility of Firm Performance, Working Paper 4449-03, MIT Sloan School of Management, Cambridge, MA, November 2003 [4] Kent Crawford(2008),Organizational Improvement: Project Portfolio Management, White Paper, PM Solutions Inc, 1788 Wilmington Pike, Glen Mills, PA 19342 USA [5] Ghasemzadeh F. and Archer N. P., (2000), Project Portfolio Selection Through Decision Support, Decision Support Systems, vol. 29, no. 1, pp. 73-88, July 2000
TABLE 4
NC-TIME’15
Alpha-Level (Significance Level)
Value (Table Value) 2TableValue Degree of Freedom
Calculated Chi-Square Value 2Cal Critical
Criteria
CHI-SQUARE VALUES OF C OMPARATIVE METHODS
803