Table 3.10 Annual average waste generation of factory A .. ..... were collected from the annual reports and water bills of the factories. ...... Akzo Nobel Surface.
EVALUATION OF THE ENVIRONMENTAL AND ECONOMIC PERFORMANCES OF THREE SELECTED TEXTILE FACTORIES IN BIYAGAMA EXPORT PROCESSING ZONE
B.K. Shyamika Shiwanthi (Index Number 11360)
EVALUATION OF THE ENVIRONMENTAL AND ECONOMIC PERFORMANCES OF THREE SELECTED TEXTILE FACTORIES IN BIYAGAMA EXPORT PROCESSING ZONE
A Dissertation submitted to the Department of Zoology and Environmental Sciences Faculty of science University of Colombo
In partial fulfilment of the requirement for the special degree of Bachelor of Science in Environmental Science
By B.K Shyamika Shiwanthi Index no: 11360 February, 2017
ii
DECLARATION
I Bengamuwa Kankanamge Shyamika Shiwanthi, hereby confirm that this dissertation submitted as a partial fulfilment of degree of Bachelor of Science, represents my own work and is expressed in my own words. External contribution to the work is acknowledged at the point of their use. A full list of references employed has been included. None of the material used in this dissertation violates copyright laws.
………………………….. Ms B.K.S.Shiwanthi Date:
We endorse the declaration by the candidate.
…………………………….
……………………………
Principle Supervisor
Co-supervisor
Dr.Erandathie Lokupitiya
Mr. V.R.Sena Peiris
Senior Lecturer in Zoology,
Consultant,
Department of Zoology and environmental science
Faculty of graduate studies,
University of Colombo
University of Sri Jayewardenapura
Date:
Date:
iii
Acknowledgements
I would like to offer my utmost gratitude to my supervisor, Dr Erandathie Lokupitiya for her continuous support, encouragement, perceptive comments and guidance given to fulfil this project successfully. My gratitude also goes to my co-supervisor Mr Sena Peiris for his support and guidance throughout the project. My appreciation also goes to Mr S.Lanarolle, Mr A.Gamage, Mr H.Sathyajith, Mr S.Baduwasam, Mr T.Kumara and Mr H.Kodithuwakku for granting permission to collect data from their factories and their continuous support. My special gratitude goes to Dr Ravi Lokupitiya, Dr S.Viswakula and Dr G.P Lakraj for their valuable support and advices on statistics. My appreciation also goes to all the lectures of Department of Zoology and Environmental sciences for their words of encouragement and advices. I would also like to thank all of my colleagues especially for Ms C.Pathmeswaran and members of environmental science special badge for their encouragement and support throughout the research project. Finally, I would like to express my heartiest gratitude to my parents, beloved sisters and Dilena for their tremendous support and encouragements since the very beginning of the project. This accomplishment would not have been possible without their strength.
iv
Table of contents
Declaration ......................................................................................................................... iii Acknowledgements ............................................................................................................. iv Table of contents .................................................................................................................. v List of figures ...................................................................................................................... ix List of tables ........................................................................................................................ xi List of abbreviations ..........................................................................................................xii Abstract ............................................................................................................................ xiii CHAPTER 01: INTRODUCTION ...................................................................................... 1 1.1Sustainable development ............................................................................................ 1 1.2 Sustainable development and industries .................................................................... 2 1.2.1 Effect of business on environment ...................................................................... 2 1.2.2 Contribution of business to sustainable development ......................................... 2 1.2.3 Green Economy .................................................................................................. 3 1.3 Corporate sustainability ............................................................................................. 4 1.4 Sustainable companies ............................................................................................... 5 1.5 Textile industries of Sri Lanka ................................................................................... 6 1.5.1 Effect on economy .............................................................................................. 6 1.5.2 Impact on the environment ................................................................................. 6 1.5.2.1 Resource depletion ....................................................................................... 7 1.5.2.2 Water pollution ............................................................................................ 7 v
1.5.2.3 Air pollution ................................................................................................. 8 1.5.3 Drivers of sustainability in textile industries ...................................................... 9 1.6 Indicators for evaluate corporate environmental performances ............................... 10 1.7 Eco – Efficiency....................................................................................................... 11 1.7.1 Micro level measurement framework for eco-efficiency.................................. 11 1.8 Justification for the study ......................................................................................... 13 1.8.1 Measuring micro level environmental performances using eco-efficiency ...... 13 1.9 Objectives of the study............................................................................................. 14 CHAPTER 02: METHODOLOGY ................................................................................... 15 2.1 Sampling sites .......................................................................................................... 15 2.1.1 Description of the factory processes, inputs and waste generation .................. 17 2.2 Selecting indicators for performance comparison ................................................... 18 2.2.1 Indicators of environmental influence .............................................................. 19 2.2.1.1 Energy use .................................................................................................. 19 2.2.1.2 Water use ................................................................................................... 20 2.2.1.3 Material use ................................................................................................ 21 2.2.1.4 Waste generation ........................................................................................ 21 2.2.1.5 Air emission ............................................................................................... 21 2.2.2 Indicators for product value .............................................................................. 22 2.3 Data Analysis ........................................................................................................... 22 2.3.1 Calculating eco-efficiency ................................................................................ 23
vi
2.3.2 Calculating the change over time compared to the baseline ............................. 23 2.3.3 Statistical analyses ............................................................................................ 24 2.4 Questionnaire ........................................................................................................... 24 CHAPTER 03: RESULTS ................................................................................................. 25 3.1 Environmental profile .............................................................................................. 25 3.1.1 Energy ............................................................................................................... 25 3.1.1.1 Energy consumption .................................................................................. 25 3.1.1.2 Patterns of energy consumption ................................................................. 26 3.1.2 Water ................................................................................................................. 29 3.1.2.1 Water consumption .................................................................................... 29 3.1.2.2 Patterns of water consumption ................................................................... 30 3.1.3 Material consumption ....................................................................................... 30 3.1.4 Wastewater generation ...................................................................................... 32 3.1.5 Greenhouse gas (GHG) emission...................................................................... 33 3.1.6 Solid waste generation ...................................................................................... 35 3.2 Value profile ............................................................................................................ 36 3.2.1 Production ......................................................................................................... 36 3.2.2 Revenue............................................................................................................. 36 3.3 Eco-efficiency ratios ................................................................................................ 38 3.3.1 Eco-efficiency of energy ................................................................................... 38 3.3.1.1 Relationship between cost per kilogram of production and eco-efficiency ................................................................................................................................ 39 vii
3.3.2 Eco-efficiency of water ..................................................................................... 40 3.3.2.1 Relationship between cost per kilogram of production and eco-efficiency ................................................................................................................................ 41 3.3.3 Eco-efficiency of material................................................................................. 42 3.3.4 Eco-efficiency of greenhouse gas ..................................................................... 43 3.3.5 Eco-efficiency of wastewater ............................................................................ 44 3.4 Overall change in eco-efficiency overtime .............................................................. 45 3.5 Correlation of revenue with eco-efficiency ............................................................. 48 3.6 Questionnaire analyses............................................................................................. 48 CHAPTER 04: DISCUSSION ........................................................................................... 52 Conclusion ......................................................................................................................... 61 References .......................................................................................................................... 62 Appendix A ........................................................................................................................ 68 Appendix B ........................................................................................................................ 69 Appendix C ........................................................................................................................ 70 Appendix D ........................................................................................................................ 71 Appendix E ........................................................................................................................ 72 Appendix F......................................................................................................................... 75 Appendix G ........................................................................................................................ 78 Appendix H ........................................................................................................................ 80 Appendix I ......................................................................................................................... 81
viii
List of figures Figure 1.1 The cost of damage to the environment by business sector ............................... 3 Figure 1.2 Evolution of corporate sustainability.................................................................. 5 Figure 2.1 Aerial view of sampling location ..................................................................... 15 Figure 2.2 Maps of the sampling sites ............................................................................... 16 Figure 3.1 Energy consumption by factory A (top), factory B (middle), and factory C (bottom).............................................................................................................................. 25 Figure 3.2 Energy use from different energy sources by factory A (top), factory B middle), and factory C (bottom) ........................................................................................ 27 Figure 3.3 Renewable and non-renewable energy consumption by factory A (top), factory B (middle), and factory C (bottom) ................................................................................... 28 Figure 3.4 Water consumption by factory A (top), factory B (middle), and factory C (bottom).............................................................................................................................. 29 Figure 3.5 Annual water consumption by factories ........................................................... 30 Figure 3.6 Different types of material use by factory A (top), factory B (middle), and factory C (bottom).............................................................................................................. 31 Figure 3.7 Wastewater generated by factory A (top), factory B (middle), and factory C (bottom).............................................................................................................................. 33 Figure: 3.8 Greenhouse gas emission by factory A (top), factory B (middle), and factory C (bottom) .......................................................................................................................... 34 Figure 3.9 Production of factory A (top), factory B (middle), and factory C (bottom) ..... 37 Figure 3.10 Net sales of the factory A (top), factory B (middle), and factory C (bottom) 37 Figure 3.11 Eco-efficiency of energy use - factory A (top), factory B (middle), and factory C (bottom).............................................................................................................. 38
ix
Figure 3.12 Effect of eco-efficiency on energy cost per production of factory A (top), factory B (middle), and factory C (bottom) ....................................................................... 39 Figure 3.13 Eco-efficiency of water use - factory A (top), factory B (middle), and factory C (bottom) .......................................................................................................................... 40 Figure 3.14 Effect of eco-efficiency on water cost per production of factory A (top), factory B (middle), and factory C (bottom) ....................................................................... 41 Figure 3.15 Eco-efficiency of material use - factory A (top), factory B (middle), and factory C (bottom).............................................................................................................. 42 Figure 3.16 Eco-efficiency of greenhouse gas emission – factory A (top), factory B (middle), and factory C (bottom) ....................................................................................... 43 Figure 3.17 Eco-efficiency of wastewater – factory A (top), factory B (middle), and factory C (bottom).............................................................................................................. 44 Figure 3.18 Differences of eco-efficiency in energy use ................................................... 45 Figure 3.19 Differences of eco-efficiency in water use ..................................................... 46 Figure 3.20 Differences of eco-efficiency in material use ................................................. 46 Figure 3.21 Differences of eco-efficiency in wastewater generation ................................ 47 Figure 3.22 Differences of eco-efficiency in greenhouse gas emission ............................ 47 Figure 3.23 Responses for questions (2-12) by factory A employees ............................... 49 Figure 3.24 Responses for questions (13-25) by factory A employees ............................. 49 Figure 3.25 Responses for questions (2-12) by factory B employees ............................... 50 Figure 3.26 Responses for questions (13-25) by factory B employees ............................. 50 Figure 3.27 Responses for questions (1-12) by factory C employees ............................... 51 Figure 3.28 Responses for questions (13-25) by factory C employees ............................. 51
x
List of tables Table 2.1 Conversion factors used for selected energy sources ........................................ 20 Table 2.2 CO2 emission factors ......................................................................................... 22 Table 3.1 Quarterly average energy consumption as a percentage of annual energy use . 26 Table 3.2 Energy use of companies from different sources as a percentage ..................... 26 Table 3.3 Percentages of renewable and non-renewable energy consumption of factories ............................................................................................................................................ 28 Table 3.4 Quarterly average water consumption as a percentage of annual water use ..... 29 Table 3.5 Average percentages of annual material consumption by type ......................... 31 Table 3.6 Percent change of material consumption by type from 2011 to 2015 ............... 32 Table 3.7 BOD and COD values of wastewater (mgL-1) ................................................... 32 Table 3.8 Percentages of average CO2 emission by different sources .............................. 34 Table 3.9 Percent change of CO2 emission by different sources from 2011 to 2015 ........ 35 Table 3.10 Annual average waste generation of factory A ................................................ 35 Table 3.11 Annual waste generation of factory B ............................................................. 35 Table 3.12 Annual waste generation of factory C ............................................................. 36 Table 3.13 Percent eco-efficiency change of energy use compared to 2011 ..................... 39 Table 3.14 Percent eco-efficiency change of water use compared to 2011 ....................... 40 Table 3.15 Percent eco-efficiency change of material use compared to 2011................... 43 Table 3.16 Percent eco-efficiency change of greenhouse gas emission compared to 2011 ............................................................................................................................................ 44 Table 3.17 Percent eco-efficiency change of wastewater generation compared to 2011 .. 45 Table 3.18 Correlation of eco-efficiency with revenue ..................................................... 48
xi
List of abbreviations BOI
Board of Investment
CO2e
Carbon dioxide equivalent
EE
Eco-efficiency
EMS
Environment Management System
EPL
Environmental Protection License
ESCAP
Economic and Social Commission for Asia and the Pacific
GHG
Greenhouse gas
HFO
Heavy Fuel Oil
ISO
International Organization for Standardization
LPG
Liquid Petroleum Gas
MANOVA
Multivariate Analysis of Variance
NOx
Nitrogen oxides
SOx
Sulphur oxides
UNCTD
United Nations Conference on Trade and Development
UNEP
United Nations Environment Programme
UNIDO
United Nations Industrial Development Organization
WBCSD
World Business Council for Sustainable Development
WCED
World Commission on Environment and Development
xii
Abstract The Textile Industry of Sri Lanka plays a critical role in Sri Lankan economy. It is also a major consumer of energy and water and it is the 5th largest contributor to CO2 emissions in the world. With the increasing popularity of the concept of sustainability and the effect of the external and internal drivers, the textile industry of Sri Lanka has adopted more environmental friendly measures for their production processes and use sustainability as a marketing tool. This study was undertaken to evaluate the environmental and economic performances of three selected textile processing factories in the Biyagama Export Processing Zone, Sri Lanka. Eco-efficiency analyses were performed for each factory using the basic equation suggested by the World Business Council for Sustainable Development (WBCSD). Total production of the factories for the last five years (2011-2015) considered as the indicator for the product value. The Indicators for the environmental influence were selected considering the inputs (energy, material and water) and outputs (wastewater and greenhouse gas emission) of the production process. The sustainability measures undertaken by the factories within the last five years were evaluated with the eco-efficiency changes. The sustainability measures taken by each factory had a positive impact on their eco-efficiency. Correlation analyses between eco-efficiency of different environmental factors and revenue of the factories were performed. The study revealed that eco-efficiency influenced the reduction of production cost.
It also revealed a positive significant
correlation between eco-efficiency and the revenue of the factories.
xiii
CHAPTER 01: INTRODUCTION 1.1 Sustainable development Rapid growth of population and their unrestrained production and consumption patterns have been lead to resource depletion, degradation of ecosystem and the climate change (Lyrstedt, 2005). Therefore people have identified the need of environmentally sustainable method for production and a more efficient use of resources to achieve better life standards. As a result concept of sustainability which has been introduced in 1987 by the World Commission on Environment and Development (WCED) has become more popular. According to the Brundtland’s report of WCED, sustainable development is the “development that meets the need of the present without compromising the ability of future generation to meet their own needs” (Brundtland, 1987). Sustainable development includes three dimensions, which are economy (growth), Social (equity) and environment (conservation). Further Prosper of other dimensions only can be achieved by adapting themselves to the limits of environmental carrying capacity (Center for Environment Education, 2007). In addition there is wide consensus that economic and social development is essential for ensure environment protection (UNIDO, 2011). This indicate the dependent nature of the dimensions, therefore sustainable development only can achieve by considering all three dimensions together. Furthermore, it has been demonstrated that enhanced resource productivity address all three dimensions of the sustainability (Bleischwitz et al., 2009).
1
1.2 Sustainable development and industries 1.2.1 Effect of business on environment Our common future report states that achievement of sustainable development cannot be simply left to government regulators and policy makers. Chapter 8 of the report indicates the significant role that should be played by the industries to achieve sustainability goals as industry sector is the main engine of economic development and also the reason of some of the unsustainable conditions of the environment (Brundtland, 1987).
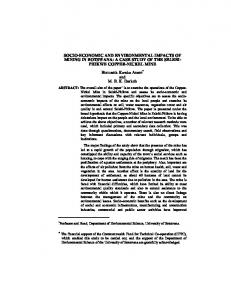
Globally industries account for the one third of total energy consumption and almost forty percent of worldwide carbon dioxide emissions (UNIDO, 2011). More over TRUCOST which is a London based consultancy organization had provided a report to UN for the year 2008 by claiming that combined damage from the world’s top firms is $2.2 trillion (Figure 1.1).
1.2.2 Contribution of business to sustainable development As first serious response to the WCED after the ‘Our Common Future’, the International Chamber of commerce issued its’ Business Charter for Sustainable Development in 1990. This was followed in 1992 by the book ‘Changing Course’ by Stephen Schmidheiny and the Business Council for Sustainable Development. Both publications were focusing on the role of corporations in sustainable development. According to the authors, supporting sustainable development is not only a necessity for society and environment but also for the economy. Since then, many business leaders and corporations have come forward to show their support for the principles of sustainable development. As a result, concepts like greening economy, corporate sustainability were immerged (Wilson, 2003).
2
Figure 1.1 The cost of damage to the environment by business sector (Source: TRUCOST, 2010)
1.2.3 Green Economy The UN Environment Programme (UNEP) defines the green economy as one “that results in improved human well- being and social equity, while significantly reducing environmental risks and ecological scarcities”( Amadi et al., 2014). “Green industry is a component of a green economy which aims to reduce pollution and greenhouse gas (GHG) emission, enhance resource (energy, material and water) efficiency, and prevent the loss of natural capital and ecosystem services while achieving the economic growth” (UNIDO, 2011). 3
1.3 Corporate sustainability Corporate sustainability is a new and evolving management strategy, which uses as an alternative to the traditional growth and profit-maximization model. There is no widely accepted definition for the term but literature indicates that it is a mixture of elements from four more established concepts: 1) sustainable development, 2) corporate social responsibility, 3) stakeholder theory, and 4) corporate accountability theory (Delai & Takahashi, 2011). Figure 1.2 summarizes the evolution of corporate sustainability. Prescott-allen (2006) has defined the term by using triple bottom line concept, “equilibrium among environmental protection (planet), economic return (profit) and social development (people).” According to stakeholder theory it means that “meeting the needs of company’s stakeholders without compromising the ability to meet stakeholders’ future needs” (Freeman, 2004). While corporate sustainability distinguishes the importance of achieving corporate growth and profitability, it also stresses companies to pursue social goals, specifically those relating to sustainable development such as environmental protection, social justice and equity and economic development (Wilson, 2003).
4
Figure 1.2 Evolution of corporate sustainability (Source: IVEY business journal, 2003)
1.4 Sustainable companies When companies integrate corporate sustainability or sustainable development concepts into organizational context, they become sustainable companies. Sustainable companies should maintain and consider the balance among economic, environmental and social issues simultaneously (Sartori & Campos, 2014). Economic performances of organization are measured by its success in market. Environmental performances are reflected by the
5
compliance with government legislations. The stakeholder management especially the management of work force and local communities indicates the social performances. Since last decade, due to the growing concern about climate change and environmental degradation, some industries have been forced to change the way they do business. As one of highest environmental polluting and resource degrading industrial sector, textile industry was forced to take action to improve their environmental performances.
1.5 Textile industries of Sri Lanka 1.5.1 Effect on economy Textile industry plays a critical role in Sri Lankan economy due to its contribution to industrial production, employment and exports. Textile industry accounts for 16% of Gross Domestic Product of the country. It has recorded a substantial growth of 8.5 percent in 2014 compared to 7.8 percent in 2013. It is the highest foreign exchange earner in industrial sector amounting to 40% of the total exports and 52% of industrial exports. It is the single largest employer in the industrial sector which provide more than 300,000 employments to the people (Embuldeniya, 2015). Even though sector effect on economy in positive way its effect on environment is negative.
1.5.2 Impact on the environment Environmental impacts from the textile industry can be categorized as resource depletion (water, energy, etc.) and pollution. Mostly the water pollution due to high Biological Oxygen Demand (BOD) and Chemical Oxygen Demand (COD) values of the effluent.
6
1.5.2.1 Resource depletion Textile processing industry requires a large volume of water for various unit operations. Especially wet process consumes a large amount of water at each stage of it. Approximately production of 1kg of cotton through wet processing requires 60-360 L of water and specific energy requirement for natural fibre processing has been recorded as 10-20 MJkg-1 and that for chemical fibre processing is 5-50 MJkg-1 (Chavan, 2001).
1.5.2.2 Water pollution Textile processing, especially the wet processing stage entirely depends on the water resource. Therefore, each step of it generates a large volume of wastewater with impurities such as dyes, pigments and chemicals which causes aquatic toxicity. The sources of aquatic toxicity can include salt, metals (copper, zinc, chromium, etc.) and their metal complexes, toxic organic chemicals (Organic pollutants sizes, organic acid, carriers used in polyester dyeing, or scouring agents (trichloroethylene and perchloroethylene), plasticizers, etc.) and toxic anions. Surfactants and related compounds such as detergents, emulsifiers and dispersants which use in almost all textile process also contribute to the toxicity of water, BOD, COD and foaming. Except some dye types like azo dye (include formaldehyde), most of dyes have low aquatic toxicity but all of them give colours to the water (Chavan, 2001). Moreover, typical textile processing effluent may include several non-process impurities such as machine cleaners, biocides, insecticides and boiler treatment chemicals, which greatly increase the pollution load. Characteristics of the effluents vary depending on the nature of the textile facility; for example wool effluent characterized by high BOD, suspended solids and grease content
7
and synthetic fiber processing effluents with low volume and toxic substances from dyeing stream where carriers are used (Parvathi, 2013). Process and non-process chemicals can enter the effluent stream through spillage, leakage, clean ups (drums and tanks), batch chemical dumping, poor housekeeping, etc. If untreated or poorly treated effluent discharges into a water body, it will degrade the quality of the water body, causing eutrophication, carcinogenic effect on organism, odour, etc.
1.5.2.3 Air pollution Air emissions can classified based on the nature of its source: boilers, ovens, storage tanks are considering as point sources. Diffusive sources are solvent based, and include wastewater treatment, warehouses and spills (Parvathi, 2013). Boiler emissions fall into four main categories, which are acid mists, solvent vapours, odour and dust and lint. Boilers are the main contributors to the SOx and NOx emission from the factories. Solvent vapours contain a large number of toxic chemicals (Kerosene or mineral turpentine oil, formaldehyde, chlorofluorohydrocarbons, mono and dichloro-benzene, ethyl acetate, hexane, styrene, etc.) in different concentrations. Nature of the vapour depends on the substances that are used in dyeing and printing operations. Problem of odour associated with oil mist or solvent vapours arises from the carriers used for polyester dyeing, resin finishing, sulphur dyeing, dye reduction or dye stripping with hydrosulphite, and bleaching with sodium hydrochloride (Chavan, 2001). Hydrocarbons are emitted from drying ovens and from mineral oils in high-temperature drying (Parvathi, 2013).
8
1.5.3 Drivers of sustainability in textile industries Strategic drivers, internal drivers and external drivers are the main types of drivers which lead factories to initiate sustainability practices (Amadi et al., 2014). Industries use sustainability principles as a marketing strategy. For example, to achieve competitive advantage, differentiation, marketing benefits, public image and reputation. It also use as a cost saving strategy and to improve quality of products (Amadi et al., 2014). Internal drivers like managerial attitudes, safety of employees, company culture, concern about environmental impacts and the state of the environment, protection of land, social responsibilities also have a positive effect on practising sustainability (Amadi et al., 2014). Most powerful drivers are categorized under the external drivers, which include pressure from government and other stakeholders (public, competitors, investors, etc.), customers’ demand, compliances with regulations, etc. (Amadi et al., 2014). Companies that we considered in this study are also driven by above drivers. All three companies have used their sustainability practices as a marketing tool and published their sustainable nature in their own websites. All three companies have signed agreements with their customers to maintain environmental friendly nature of the factories (Appendix A). Obtaining Environmental Protection Licence (EPL) for emission and disposal of waste (Appendix B), agreements to compliance with BOI standards (Appendix C), etc. reflect the effect of government regulations on maintaining eco- friendliness of factories.
9
1.6 Indicators for evaluate corporate environmental performances Corporate environmental performance indicators can be classified into three groups as operational performance indicators, Management performance indicators and condition indicators (Berkel, 2007). According to Berkel (2007), Operational performance indicators include two types of indicators: Intensity indicators which explain the environmental influences of productive output (Water consumption per kilogram of product m3kg-1) and efficiency indicators that reflect the level of efficiency in utilizing natural resources (Production per unit of water kgm-3). Management performance indicators include environmental policies or compliance with management systems such as ISO 14001. Condition indicators include conditions like oxygen concentration, noise level at residential areas, etc. Different
international
organizations
have
published
standards
for
evaluating
environmental performances by using above indicators. In 1994 International Organization for Standardization had introduced ISO 14000 series on environmental performance evaluation. Environmental performance evaluation standards (ISO 14031) series have been officially published in 1999. United Nations Conference on Trade and Development (UNCTD) has introduced set of indicators by binding corporate environmental performance indicators and financial performance indicators. World business council for sustainable development (WBCSD) has introduced eco-efficiency indicators in year 2000, which address economic performance and environmental performance of the businesses (Wan & Tang, 2014).
10
1.7 Eco – Efficiency WBCSD introduced the eco – efficiency concept in 1992. According to WBCSD, “Ecoefficiency is achieved by the delivery of competitively-priced goods and services that satisfy human needs and bring quality of life, while progressively reducing ecological impacts and resource intensity throughout the life-cycle to a level at least in line with the earth’s estimated carrying capacity” (Bidwell & Verfaillie, 2000). Eco-efficiency combines the basic economic and environmental components. It encourages a company to achieve more value with lower inputs and emissions. It stimulates environmental improvement and economic development simultaneously. Therefore ecoefficiency in simple terms mean producing more with less environmental impact (Bidwell & Verfaillie, 2000). WBCSD introduced seven success factors to achieve and increase eco-efficiency in the business sector: 1) Reduction of material intensity, 2) Reduction of the energy intensity, 3) Reduction of toxic dispersion, 4) Enhancement of material recyclability, 5) Maximum sustainable use of renewable resources,
6) Extension of product durability, and 7)
Maximum service intensity of products (Bidwell & Verfaillie, 2000).
1.7.1 Micro level measurement framework for eco-efficiency Eco- efficiency framework can be applied at macro level (government) or in micro level (company) to identify the progress towards economic and environmental sustainability. Ratio between natural resource input or pollution output and economic or productive output are measured at the micro level (Bidwell & Verfaillie, 2000), and can be defined as follows.
11
Eco-efficiency =
Product or service value Environmental influence
WBCSD has introduced indicators to measure the eco- efficiency and those indicators are based on 8 principles which ensure indicators are scientifically supportable, environmentally relevant, accurate and useful for all kinds of businesses around the globe (Bidwell & Verfaillie, 2000). Indicators that can be commonly used for each and every business globally come under the ‘generally applicable indicators’. Each of these indicators relate to a global environmental concern or business value. ‘Business specific indicators’ are mostly relevant to specific business or sector (Bidwell & Verfaillie, 2000). According to the above eco- efficiency equation indicators come under product value and environmental influence. Generally applicable indicators for product value are quantity of goods produced or quantity of goods provided to customers or net sales. Those related to the environmental influence in product creation are energy, material, water consumption and greenhouse gas emissions, and ozone depleting substance emissions. Moreover, additional financial value indicators, acidification emission to air and total waste may also be included in the generally applicable indicator category (Bidwell & Verfaillie, 2000).
12
1.8 Justification for the study 1.8.1 Measuring micro level environmental performances using eco-efficiency The eco-efficiency concept incorporates main environmental performance indicators such as cleaner production, pollution prevention and waste minimization (Salem et al., 2011). According to Salem et al. (2011) eco-efficiency concept has advantages over other environmental performance measures because it can give the real environmental performance of the business despite the differences between these businesses. Eco-efficiency framework is flexible enough to use by integrating with other concepts such as indexes, life cycle analysis, etc. and also it can be easily interpret across the business spectrum (Bidwell & Verfaillie, 2000). Therefor concept has been used in literature for different purposes. For example concept has been used as a tool to analyse sustainability of factories, Identify the impact of economic activities on the environment, to identify most environmental friendly and economically beneficial production process to meet international standards, to create possible linkage between environmental consumption and sustainability (Amadi et al., 2014; Burchart-korol et al., 2012; ESCAP, 2009; Tegstedt, 2011; UNIDO, 2002) An eco-efficiency analysis based in Kenya has shown potential gain in the profitability of a firm by improving eco-efficiency in resource use (Kamande, 2010). According to the study proactive firms (whose Environment Management System (EMS) meets requirement of regulatory authorities and incorporate some voluntary actions such as Clean Production Initiatives or ISO certification) found to perform better than reactive firms (whose EMS merely meets requirements of regulatory authorities) in terms of profitability and ecoefficiency. More over firms that combine both proactive and reactive EMS perform even
13
better, which shows the benefit of adopting commitment based approaches with the compliance based approaches to environmental management. A study by Sklyarova et al. (2011) evaluates the state of environmental friendliness of a well-known furniture and textile retailer (IKEA) of Russia, which has gained great publicity over its environmental friendly measures in the manufacturing process and operations.
1.9 Objectives of the study In this study, we also have selected three well-known textile factories from Biyagama Free Trade Zone, which have a good reputation for their sustainability practices over the years (combined proactive and reactive EMS) and use of their eco-friendly nature for marketing purposes. Major objectives of this study are to compare and evaluate environmental performance of each factory over years to identify their level of eco-efficiency and to identify if there is a relationship between factories revenue and its eco-efficiency. A secondary objective was to evaluate the awareness of employees about the concept of sustainability.
14
CHAPTER 02: METHODOLOGY 2.1 Sampling sites Biyagama Export Processing Zone is located in Gampha District, Western Province. It is only 24km away from the Colombo city and located in close proximity to Bandaranayaka International Airport. Industrial area (180 Acres) has been divided in to two major zones; zone A (6057’21.06” N 80000’26.56”E) and zone B (6057’56.77” N 8000’19.01” E). Three textile factories were selected for this study: Two factories from zone ’A’ which are partners of the MAS apparels and another factory from zone ’B’ which is a partner of the Brandix apparels. Names of the factories are not revealed due to ethical concerns. Therefore, the factories were labelled as A, B and C. These factories have practised sustainability over several years and used their sustainability practices for marketing purposes. In this study, we analysed their performance for a period of five years (2011 to 2015).
Figure 2.1 Aerial view of sampling location (Source: https://earth.google.com/)
15
Zone A
Factory A and B
Zone B
Factory C
Figure 2.2 Maps of the sampling sites (Source: BOI 2016)
16
2.1.1 Description of the factory processes, inputs and waste generation
All three factories use knitting technology to produce fabric by using imported yarn. Yarn is knitting by the machines, which results fabric. Then the fabric is processed through wet processing which includes pre-treatment, dyeing, printing and finishing steps. In the pretreatment step fabric goes through desizing, scouring, bleaching and mercerizing which requires a large amount of water for washing, rinsing and steam generation. Each and every step uses pure water. Different kinds of chemicals are required for this process. Steam generating boilers consume a large amount of energy. All three factories use two types of boilers. One type operates by using biomass (sawdust, wood logs, wood chips) and the other one uses heavy fuel oil (HFO). Dyeing process (Appendix D) uses different amounts and types of textile reactive dyes, dye bath chemicals and auxiliaries to obtain the required colour and colour strength on the fabric. This process also requires a large amount of water in different temperatures (hot/cold) which requires energy. This process uses high material to liquor ratio, which results in a large volume of effluent. If it is necessary to print a pattern on the fabric, a pigment paste which includes various types of chemicals as thickening agent, binder and, other auxiliaries such as fixing agents, plasticizers, defoamers, etc. are applied to the fabric according to a previously decided pattern and then dry the fabric and fix the pattern by using steam. Therefore, this step also requires energy for steam generation, machines, etc. and it adds a large amount of chemicals to
the
effluents.
Depending on the quality required for the fabric, different types of mechanical methods such as relax dryers, stenters, compactors, etc. and chemical methods like elastomeric
17
finish, softening, anti-pilling finish etc. are use in the finishing process. Mechanical methods require different types of energy (heat, pressure and kinetic energy) while chemical methods use a number of chemicals to add different qualities to the fabric. This step also produces a large volume of effluent with high BOD and COD values. All three factories produce fabric by using the above production processes. The amount of water, energy, yarn and chemical required and waste generation differ according to the amount and the type of the fabric each factory produces and technology used.
2.2 Selecting indicators for performance comparison The indicators fall into two groups, based on the eco-efficiency formula which brings the economic and ecological dimensions together to relate product value to environmental influence. Eco-efficiency is calculated using equation 2.1.
Product or service value Eco-efficiency = Environmental influence
Equation 2.1
Product or service value indicators (economic variables) represent the productive outputs of the business. This can be expressed either in monetary terms (sales, value added) or in physical terms (quantity of production) (Boffa Miskell Limited, 2009). In this study, economic variables are expressed by using quantity of products over the five-year study period. Indicators for environmental influence (Physical indicators) represent that are related to mass, and energy flow through the business process. According to WBCSD, physical indicators can be defined as core indicators or generally applicable indicators and sector
18
specific or supplementary indicators (Bidwell & Verfaillie, 2000).
Core indicators
represent overall resource use and waste production of the organization over time (Boffa Miskell Limited, 2009). Five generally applicable indicators of environmental influence have been selected for this study, those are energy, water, material, solid waste and greenhouse gas emission.
Input
Output
Solid waste
Material
Wastewater
Energy Processing
Air emission
Water Product output Figure 2.3 Inputs and outputs of a production process.
2.2.1 Indicators of environmental influence 2.2.1.1 Energy use Electricity, Diesel, HFO, LPG (Liquid Petroleum Gas), Biomass (sawdust and wood) are the main sources of energy which are used to generate electrical, thermal and kinetic energy for boilers, processers, motors, compressor, lighting and air conditioning. Energy consumption and cost data were collected from the annual reports of the factories. Energy
19
conversion factors given in Table 2.1 were used to calculate the total energy consumption in MJ and finally eco-efficiency for the energy is calculated in kgMJ-1.
Table 2.1 Conversion factors used for selected energy sources Source of energy
Unit
Conversion factor ( 1unit to MJ)
Electricity1
kwh
3.6
Diesel2
L
36.4
HFO3
L
41.73
LPG4
kg
49
Saw dust5
kg
16.2
Wood5
kg
16.075
Wood pellet5
kg
16.8
Steam6
ton
2700
Sources: UNIDO and UNEP1 (2010), University of Washington2 (2005), Australian Institute of Energy3 (2017), Hahn4 (2013), Ashton and Cassidy5 (2007), Netherlands Organization for Applied Scientific Research6 (2010).
2.2.1.2 Water use Wet processing consumes a large volume of water for various processes such as desizing, scouring, bleaching, mercerization, dyeing, printing, finishing and ultimately washing. Total water consumption and cost data of the factories in each month from 2011 to 2015 were collected from the annual reports and water bills of the factories.
20
2.2.1.3 Material use Yarn, dye and chemicals are using as the major materials for the production. Yarn is the basic material that use for the production. Different types of yarn (cotton, polyester, Mellange, Spandex, etc.) are fed in to the knitting machine based on the required fabric. Chemicals and dye are the materials that give required colors and the qualities to the fabric in wet processing. Monthly data of material consumption were collected from annual reports and dye house reports of the factories for last five years (2011-2015).
2.2.1.4 Waste generation Large volumes of wastewater with colours, chemicals, metals, oil, organic matter, etc., are generating during the production process. Solid waste including sludge, fabric, Polythene, cardboard, containers, etc., are also generating during this process. However, as none of the three factories has recorded them separately, waste data were only collected under total solid waste, sludge and wastewater category.
2.2.1.5 Air emission Greenhouse gas emission from different energy sources were calculated using the emission factors from Sri Lanka Sustainable Energy Authority (Table 2.2).
21
Table 2.2 CO2 emission factors Emission source
unit
Emission factor kgCOe/unit
Electricity
kWh
0.71
HFO
L
3.01
LPG
kg
2.73
Diesel
L
2.74
Fire wood
kg
1.51
(Source: Sri Lanka Sustainable Energy Authority, 2010)
2.2.2 Indicators for product value Quantity of product sold to customers (a generally applicable value indicator) was used as the indicator for product value. Moreover, annual revenue data of the factories for past five years were collected through interviews with factory representatives to indicate the economic development of the factories.
2.3 Data Analysis Summary of the data obtained for each parameter was graphically presented as time series, column charts, bar charts and combo charts. Further calculations were carried out based on these.
22
2.3.1 Calculating eco-efficiency Eco-efficiency ratios were calculated for each parameter by using the following formulas (Bidwell & Verfaillie, 2000). Energy = Total production (kg) / Total energy consumption (MJ) Water = Total production (kg) / Total water consumption (m3) Material = Total production (kg) / Total material consumption (kg) Wastewater = Total production (kg) / Total wastewater (m3) Solid waste = Total production (kg) / Total waste (kg) Air emission = Total production (kg) / CO2 emission (CO2e)
2.3.2 Calculating the change over time compared to the baseline As all three companies have shifted to sustainable practices within 2011-2012 period, change over time was calculated considering 2011 as the baseline. Equation 2.2; (UNIDO & UNEP, 2010). If use of the source has not been initiated in 2011, initiated year was taken as the baseline.
Change (C) =
(A – B)
Equation 2.2
*100
B
Where, A = Follow up value B = Baseline
C = Change from the baseline
23
2.3.3 Statistical analyses Analyses were performed using statistical analysis software minitab version 17.0. The significance of variations in eco-efficiency among factories over the past five years was tested using general MANOVA (multivariate analysis of variance) test and the Post-Hoc tukey’s test at 95% confidence intervals. Pearson’s correlation analysis was performed in order to test possible correlations between eco-efficiency and revenue of the factories.
2.4 Questionnaire A survey has been conducted to evaluate the awareness of employees about the sustainability (Appendix E). Due to the lack of responses it could not analysed statistically. Therefore results have been only represented graphically.
24
CHAPTER 03: RESULTS 3.1 Environmental profile 3.1.1 Energy 3.1.1.1 Energy consumption As average, factory C showed the highest increase in energy consumption over time (561.20 GJ increase of energy per month), whereas factory A and B had a rate of increasing of 73.0 GJ and 31.55 GJ per month, respectively. Energy consumption of factory A, B and C had changed over past five years as illustrated in Figure 3.1 and Table 3.1.
A 2011 2012 2013 2014
Energy (MJ)
B
C
Month
Figure 3.1 Energy consumption by factory A (top), factory B (middle), and factory C (bottom)
25
2015
Table 3.1 Quarterly average energy consumption as a percentage of annual energy use 1st quarter
2nd quarter
3rd quarter
4th quarter
(%)
(%)
(%)
(%)
A
23
23
27
27
B
24
24
26
26
C
23
22
26
29
Factory
3.1.1.2 Patterns of energy consumption
Energy consumption of the factory A has increased by 37% from 2011 to 2015 and its average annual energy consumption is 158 TJ. Factory B has consumed around 86 TJ annually and its energy requirement has increased by 23% within the study period. Annual average energy consumption of factory C is 717 TJ and it has shown 54% of increase in energy consumption within considered 5 years. Amount of energy that has been acquired from different energy sources by each factory are illustrated in Figure 3.2 and Table 3.2.
Table 3.2 Energy use of companies from different sources as a percentage Energy source
Factory A (%)
Factory B (%)
Factory C (%)
Grid electricity HFO Diesel Wood Sawdust LPG Steam
32 17 3 45* 14* 1 -
30 18 1 41 4*** 1 11*
13 53 1 24** 31** 0.1 -
* Introduced in 2012
** Introduced in 2013
*** Used only in 2015
26
Purchased steam LPG Sawdust Wood Diesel HFO Grid electricity
Figure 3.2 Energy use from different energy sources by factory A (top), factory B middle), and factory C (bottom)
All three factories are using renewable energy sources to meet part of their energy requirement. Renewable energy sources included biomass, hydroelectricity and steam energy and non-renewable energy included HFO, diesel, LPG and thermal-electricity. The renewable and non-renewable energy consumption of the factories within past five years is illustrated in Figure 3.3 and Table 3.3.
27
Renewable Non-renewable
Figure 3.3 Renewable and non-renewable energy consumption by factory A (top), factory B (middle), and factory C (bottom)
Table 3.3 Percentages of renewable and non-renewable energy consumption of factories 2011 2012 2013 2014 2015 Factory Re Non Re Non Re Non Re Non Re Non A
16
84
67
33
77
23
74
26
76
24
B
65
35
62
38
60
40
61
39
79
21
C
2
98
1
99
26
74
60
40
63
37
28
3.1.2 Water 3.1.2.1 Water consumption As average, rate of water consumption of factory B showed the higher decrease in water consumption (59.65 m3 per month), factory A and C also had decreased their water consumption by 3.86 m3 per month, 24.54m3 per month respectively. Water consumption of factories has fluctuated over the time as illustrated in Figure 3.4 and Table 3.3. A
B
C
Figure 3.4 Water consumption by factory A (top), factory B (middle), and factory C (bottom)
Table 3.4 Quarterly average water consumption as a percentage of annual water use
(%)
2nd quarter (%)
3rd quarter (%)
4th quarter (%)
A
23
24
27
26
B
25
26
26
24
C
24
23
27
27
Factory
1st quarter
29
3.1.2.2 Patterns of water consumption Annual water consumption of factory A has been reduced by 6% at 2015 compared to the 2011. Factory B also has reduced water consumption by 27% while factory C recorded the smallest reduction, which is 0.1%. Water consumption patterns of the factories are illustrated in Figure 3.5.
3000000
Water (m3)
2500000 2000000 1500000 1000000 500000 0 2011 Factory A
Factory B
2012
2013 Year
2014
2015
Factory C
Figure 3.5 Annual water consumption by factories
3.1.3 Material consumption Material consumption patterns of the factories depend on their recipes. Accordingly, factory C consumed less amount of dye and large amount of chemicals while factory B mostly depends on the dye. Factory A consumed both dye and chemical almost in equal proportions. Total material consumption of factory B has reduced by 18% while consumption of factory A and C have been shown 55% and 9% increment respectively from 2011 to 2015. Total 30
material includes Yarn, dye and chemical. Material consumption of the factories has altered within last five years as illustrated in the Figure 3.6, Table 3.5 and Table 3.6.
A Yarn Dye Chemicals
B
C
Figure 3.6 Different types of material use by factory A (top), factory B (middle), and factory C (bottom)
Table 3.5 Average percentages of annual material consumption by type Factory A Yarn
67
Dye
19
Factory B
Chemicals
14
Yarn
89
Dye
11
31
Factory C
Chemicals
Yarn
Dye
1
80
1
Chemicals
24
Table 3.6 Percent change of material consumption by type from 2011 to 2015 Factory A
Factory B
Factory C
Yarn
Dye
Chemicals
Yarn
Dye
Chemicals
Yarn
Dye
Chemicals
82
-24
66
-20
4
-9
12
17
-2
(- indicates percent reduction)
3.1.4 Wastewater generation Average wastewater generation of factory A, B and C have been reduced over the past five years. Factory A has recorded 3.09 m3 reduction per month while factory B and C have reduced wastewater generation by 47.72 m3 per month and 21.85 m3 per month respectively. Volume of wastewater generated from the production processes of factories throughout past five years has changed as indicated in Figure 3.7. Total wastewater generation of factories have reduced in parallel to the water consumption, which was a reduction of 6%, 27% and 0.1% respectively in factory A, B and C. Wastewater contain dye, chemicals, grease, oil, etc. which cause to high BOD and COD values. Table 3.7 gives the average BOD and COD values of wastewater discharged by factories.
Table 3.7 BOD and COD values of wastewater (mgL-1) A
B
C
BOD
COD
BOD
COD
BOD
COD
85
460
Not available
Not available
150
300
32
A
Wastewater (m3)
2011 2012 2013 2014 2015
B
C
Month Figure 3.7 Wastewater generated by factory A (top), factory B (middle), and factory C (bottom)
3.1.5 Greenhouse gas (GHG) emission Amount of CO2 emitted from different energy sources are illustrated in Figure 3.8. Percentages of CO2 emission from each source and change of CO2 emission from 2011 to 2015 are given in Table 3.8 and Table 3.9 respectively.
33
Electricity Diesel HFO LPG
Figure: 3.8 Greenhouse gas emission by factory A (top), factory B (middle), and factory C (bottom)
Table 3.8 Percentages of average CO2 emission by different sources Energy source
A
B
C
Electricity
76
70
35
HFO
19
27
63
Diesel
4
2
1.1
LPG
1
1
0.1
34
Table 3.9 Percent change of CO2 emission by different sources from 2011 to 2015 Energy sources
A
B
C
Electricity
-6
-20
-11
HFO
-88
-54
-41
Diesel
93
34
-4
LPG
189
66
-3
(- indicates a percent reduction)
3.1.6 Solid waste generation Factory A has not recorded the details on solid waste before 2015. Therefore, they have provided estimated waste details. Table 3.10 gives the annual average waste generation by factory A. Table 3.10 Annual average waste generation of factory A Sludge
Boiler ash
Municipal waste
20000 kg
12500 kg
70500 kg
Factory B also had not separately recorded their waste data; only available data were fabric waste data, which given in Table 3.11. Fabric waste generation has been reduced by 25% from 2012 to 2015.
Table 3.11 Annual waste generation of factory B Waste type
2011
2012
2013
2014
2015
Fabric (kg)
Not available
55672
41579
40964
41839
35
Factory C has recorded their waste data under sludge and municipal waste category which are given in Table 3.12. It has been able to reduce sludge generation by 63% but municipal waste generation has increased by 186% by 2015, compared to 2011.
Table 3.12 Annual waste generation of factory C Waste type
2011
2012
2013
2014
2015
Sludge
5244000
4789000
2649000
1943000
1937580
Municipal
165190
175000
463031
472770
472856
3.2 Value profile 3.2.1 Production Each factory has increased their product generation as illustrated in Figure 3.9. Factory A has increased its production by 45% from 2011 to 2015 while factory B and C had recorded 71% and 31% increments respectively
3.2.2 Revenue Annual revenue of factories had changed as illustrated in Figure 3.10. The included values are approximate values provided by the factory officers. Factory A and B had reached 39% and 38% revenue increment compared to 2011, while Factory C recorded its increment as 44%.
36
A A
Net sales (million rupees)
Production (kg)
B
B
C
C
Year
Year Figure 3.10 Net sales of the factory A (top), factory B (middle), and factory C (bottom)
Figure 3.9 Production of factory A (top), factory B (middle), and factory C (bottom)
37
3.3 Eco-efficiency ratios 3.3.1 Eco-efficiency of energy Factory A had continuously increased its eco-efficiency of energy use after 2012 and factory B has been managed to increase the eco-efficiency until 2014 but has dropped in 2015. Energy efficiency of factory C had dropped continuously up to 2013 compared to2011 and has subjected to increment thereafter. Although Factory A has increased energy consumption by 37% they have managed to increase eco-efficiency by 6%, factory B has reached 57% increment in eco-efficiency with 23% increase in energy use. Factory C has not able to increase eco-efficiency compared to 2011 as their energy consumption increased by 54%. Energy efficiency of factories had changed within the past five years as illustrated in Figure 3.11 and percent changes of eco-efficiency by each year compared to 2011 is given in the Table 3.13.
A
EE_Energy (MJ/kg)
B
C
Year Figure 3.11 Eco-efficiency of energy use - factory A (top), factory B (middle), and factory C (bottom)
38
Table 3.13 Percent eco-efficiency change of energy use compared to 2011 Year Factory A 2012 -18 2013 -5 2014 -2 2015 6 (- indicates percent reduction)
Factory B 27 66 92 57
Factory C -2 -24 -19 -15
3.3.1.1 Relationship between cost per kilogram of production and eco-efficiency Factories were able to reduce cost of energy and cost of production after replacing HFO with biomass, it also led to an increment in eco-efficiency. Figure 3.12 illustrate this relationship over the time.
A Eco-efficiency Energy cost per kg of production
EE_Energy (kg/MJ)
B
C C
Cost per production (Rs/kg)
B
Year Figure 3.12 Effect of eco-efficiency on energy cost per production of factory A (top), factory B (middle), and factory C (bottom)
39
3.3.2 Eco-efficiency of water Eco-efficiency of water use for each factory has increased over past five years. Further, factory A has reduced 6% of water consumption to reach 54% increase in eco-efficiency while Factory B has gain 135% increment by reducing water use 27%. Factory C only has reduced water consumption by 0.1% but was able to gain 31% increase in eco-efficiency. Eco-efficiency has increased over past five years as illustrated in Figure 3.13 and percent change of eco-efficiency compared to 2011 is given in Table 3.14.
EE_Water (kg/m3)
A
B
C
Year Figure 3.13 Eco-efficiency of water use - factory A (top), factory B (middle), and factory C (bottom)
Table 3.14 Percent eco-efficiency change of water use compared to 2011 Year 2012 2013 2014 2015
Factory A 6 22 27 54
Factory B 39 100 113 135 40
Factory C -2 6 21 31
3.3.2.1 Relationship between cost per kilogram of production and eco-efficiency When eco-efficiency of water increased, cost that factory should afford for water to produce a 1kg of product has decreased. Effect of eco-efficiency on cost of production is illustrated in Figure 3.14.
A
EE_Energy (kg/MJ)
B
Cost per production (Rs/kg)
Eco-efficiency Energy cost per kg of production
C
Year
Year Figure 3.14 Effect of eco-efficiency on water cost per production of factory A (top), factory B (middle), and factory C (bottom)
41
3.3.3 Eco-efficiency of material Eco-efficiency of material has considerably changed after 2012 in all three factories. Factory A has increased its material consumption year by year and decreased the ecoefficiency of material use continuously after 2012. Factory B has increased the ecoefficiency by decreasing material consumption. Although factory C has increased its material consumption compared to 2011 except in 2014, has managed to increase its ecoefficiency by proportionally increasing production of the factory. Fluctuation of ecoefficiency in material use from 2011 to 2015 illustrated in Figure 3.15. Percent change of eco-efficiency in each year compared to 2011 is given in Table 3.15.
EE_Total material (kg/kg)
A
B
C
Year Figure 3.15 Eco-efficiency of material use - factory A (top), factory B (middle), and factory C (bottom)
42
Table 3.15 Percent eco-efficiency change of material use compared to 2011 Year Factory A 2012 29 2013 18 2014 -3 2015 -7 (- indicates percent reduction)
Factory B 6 57 103 108
Factory C -1.4 14 12 20
3.3.4 Eco-efficiency of greenhouse gas Quantity of production per CO2 equivalent (CO2e) indicated in eco-efficiency of greenhouse gas emission. All three factories had increased eco-efficiency by 2015 and showed similar pattern in change in eco-efficiency. All three factories had increased ecoefficiency after 2012, dropped in 2014 and again increased in 2015, as illustrated in Figure 3.16. Table 3.16 gives the percent change of eco-efficiency compared to 2011.
EE_GHG emission (kg/CO2e)
A
B
C
Year Figure 3.16 Eco-efficiency of greenhouse gas emission – factory A (top), factory B (middle), and factory C (bottom)
43
Table 3.16 Percent eco-efficiency change of greenhouse gas emission compared to 2011 Year Factory A 2012 46 2013 167 2014 111 2015 152 (- indicates percent reduction)
Factory B -2 88 67 139
Factory C -7 71 58 91
3.3.5 Eco-efficiency of wastewater Quantity of production that was produced at the cost of generation of one cubic meter of wastewater considered as the eco-efficiency of wastewater. Wastewater generation by production has decreased over the time parallel to the water consumption. Therefor ecoefficiency of all three factories has increased as illustrated in Figure 3.17. Percent ecoefficiency change over time compared to 2011 is displayed in Table 3.17.
EE_Wastewater (kg/m3)
A
B
C
Year Figure 3.17 Eco-efficiency of wastewater – factory A (top), factory B (middle), and factory C (bottom)
44
Table 3.17 Percent eco-efficiency change of wastewater generation compared to 2011 Year Factory A 2012 6 2013 22 2014 27 2015 54 (- indicates percent reduction)
Factory B 39 100 113 135
Factory C -2 6 21 31
3.4 Overall change in eco-efficiency overtime Significant variation of eco-efficiency among factories over the past five years has been detected by the findings of MANOVA. There is a significant difference of eco-efficiency among companies (general MANOVA; F= 85.687, P=0.000) and over the past five years (general MANOVA; F=4.313, P=0.041) was found at 95% confidence level. Further, according to MANOVA eco-efficiency of energy is significantly different among factories (F=127.17, P=0.000). Post Hoc tukey’s test at 95% confidence level also gave evidence for differences between factories in eco-efficiency of energy use: factory A (1) and factory C (3), and factory C and factory B (2) are significantly difference in eco-efficiency of energy use but factory B and A do not indicate a significant difference as depicted in Figure 3.18.
Figure 3.18 Differences of eco-efficiency in energy use
45
Eco-efficiency of water use also is significantly different among the factories (F=34.26, P=0.000). Moreover A, C and C, B pairs are significantly different but B and A factories are not significantly different as illustrated in Figure 3.19.
Figure 3.19 Differences of eco-efficiency in water use
The material efficiency among factories are significantly different (F=94.19, P=0.000). A, B and B, C pairs shows a significant difference in eco-efficiency of material use but factory B and A are not significantly different as illustrated in Figure 3.20.
Figure 3.20 Differences of eco-efficiency in material use
46
Eco-efficiency of wastewater significantly differed among the factories (F=14.65, P=0.001). More over factory A and C pair and B and C were significantly different in terms of eco-efficiency in material use while factory A and B are not significantly different as illustrated in Figure 3.21.
Figure 3.21 Differences of eco-efficiency in wastewater generation
Eco-efficiency of greenhouse gas emission indicates a significant different among the factories (F=4.64, P=0.035). A significant difference was shown only among the factory B and C. A, B and A, C pairs are not significantly different as illustrated in Figure 3.22.
Figure 3.22 Differences of eco-efficiency in greenhouse gas emission
47
3.5 Correlation of revenue with eco-efficiency The Pearson’s correlation analysis revealed a positive significant correlation of ecoefficiency with revenue of the factories as shown in Table 3.18.
Table 3.18 Correlation of eco-efficiency with revenue Correlation of revenue with eco-efficiency under different environmental factors Energy use Material use Water use Greenhouse gas emission Wastewater generation (r-correlation coefficient)
r value 0.933 0.481 0.950
p value 0.000 0.069 0.000
0.911 0.937
0.000 0.000
3.6 Questionnaire analyses Questionnaire was given to all the executives of each factories. Out of that only 42 persons from factory A, 12 persons from each factory B and C responded. According to the responses 100% of responders from factory A believe that adopting sustainable measures are profitable. Moreover, according to the 40% of responders, one of the greatest benefit factory has gain through sustainability is cost reduction through energy efficiency. 31% of responders believe that production cost has been reduced due to the material/waste efficiency. Figure 3.23 and Figure 3.24 summarized the response of factory A employees (Appendix F).
48
120% 100% 80% 60% 40% 0%
All of these Environmental issues Social responsibilities Safety issues All In line with my other… No commitment On the agenda… No owner’s wish for broader… resource scarcity maintaining “license to… competitors' increased… Yes No, but will be in the future significantly increased I do not know improved brand reputation reduced cost due to… increased competitive… increased employee… enhance… increased the profit customers Competitors NGOs All
20%
2
3
4
5 6
7
8
9
10
11
12
Figure 3.23 Responses for questions (2-12) by factory A employees
100% 90% 80% 70% 60% 50% 40% 30% 20% 10% 0% 13
14
15
16
17 Yes
18 No
19
20
21
22
23
24
25
Not applicable
Figure 3.24 Responses for questions (13-25) by factory A employees
92% of factory B responders believe that organization’s sustainability related actions, decisions were affected to increase its profitability and 42% believe that increased energy and material efficiency has effect on cost reduction. Responds of factory B employees are summarized in Figure 3.25, and Figure 3.26 (Appendix F).
49
2
3
4
5
6
7
8
9
10
11
internal business units
government policy makers
increased employee productivity
increased competitive advantage
reduced cost due to material or…
no changes
somewhat increased
I don't know
Yes
legislative/Political pressure
resource scarcity
owner’s wish for broader value…
No
On the agenda permanently, but…
Lower than other priorities
Among my top priorites
All of these
Environmental issues
100% 90% 80% 70% 60% 50% 40% 30% 20% 10% 0%
12
Figure 3.25 Responses for questions (2-12) by factory B employees
90% 80% 70% 60% 50% 40% 30% 20% 10% 0% 13
14
15
16
17
18
19
20
21
Yes
No
Not applicable
22
23
24
25
Figure 3.26 Responses for questions (13-25) by factory B employees
Responders (42%) from factory C believe that increased energy efficiency, material efficiency caused to reduce the cost of the production and 100 % of them believed that
50
0%
All Economic Separate reporting Top priority With other priority Lower priority On the agenda… Permenantly in the… Yes No Resource scarcity Foreing customers Political pressure Owners willingness yes No, but will be in the future Significantly increased Somewhat increased I don’t know Access to new market Increased competitive… Reduced cost due to… Reduced cost due to… Increased the profit Government policy makers Customers
sustainability measures led to increase the profit of the factory. Figure 3.27 and Figure 3.28
summarized the responds of factory C employees (Appendix F).
120%
100%
80%
60%
40%
20%
2
13 3
14 4
15 5
16 6
17
Yes 7
18
No 8
19
20
51 9
21 10
22
Not applicable
Figure 3.28 Responses for questions (13-25) by factory C employees
23
11 12
Figure 3.27 Responses for questions (1-12) by factory C employees
120%
100%
80%
60%
40%
20%
0%
24
25
CHAPTER 04: DISCUSSION
Textile industry is a major consumer of energy and water and it is the 5th largest contributor to CO2 emission of the world (Athalye, 2014). Results of current study indicated that total energy consumption of the factories had increased year by year, with the production. Higher energy requirement in second half of the year indicated the winter consumption which supports the other studies on energy consumption patterns of the textile industry (Agha & Jenkins, 2014). Even with higher energy consumption eco-efficiency of factory A has increased after 2012, B has displayed an increase in eco-efficiency since 2011, while factory C has illustrated a trend of increase in energy efficiency only after 2013. This trend of eco-efficiency is clearly related to the measures that factories have taken to use energy in more sustainable way. Factory A has started its first sustainability project on energy in January 2012 by introducing efficient motors. Since then several projects had been done and some are ongoing to improve efficiency of electricity by using more sustainable lighting systems, motors, heating, chilling systems and also steps had been taken to improve fuel use by selecting more environmental friendly fuels (Biomass) and selecting more efficient and environmental friendly boilers (biomass boilers). Further improvements have been done on steam use by reducing the leakages, installing steam accumulators, etc. (Appendix G). Factory B has started its energy saving projects at the end of 2010 by introducing skylights to the dye house and finishing areas and more projects have been carried out since then (Appendix H).
52
Factory C has moved forward with more sustainable energy consumption pattern in November 2012 by installing wood chip fired boilers to replace furnace oil fired boilers (Appendix I). Most of these projects that have been carried out by factories for increasing eco-efficiency are come under operations, maintenance and engineering. Our findings suggest that sustainability measures caused an increase in eco-efficiency in energy use of the factories. Therefore eco-efficiency can be used as a tool for sustainability analysis (Lucato et al., 2013; Zhang et al., 2008). Sustainability measures indicated a positive effect on the eco-efficiency in energy of the factories and illustrated a year- by- year increase in eco-efficiency since the initial year of the practices. However, factory A and C have shown a reduction in eco-efficiency compared to 2011 which means that they need to develop more management strategies and innovations to increase energy efficiency of the factories. Factories could have increased their energy efficiency further by adopting energy management standard ISO 50001, which provides a strong organizational framework for energy management and to gain highest possible advantage over sustainability measures. More energy saving strategies that can be used by the factories and technical guidelines for textile industries are given by Agha and Jenkins (2014), Hasanbeigi (2010), UNIDO (1992, 2002), and UNIDO and UNEP ( 2010). Increased eco-efficiency in energy had clearly led to a reduction of the energy cost of the product. Cost reduction has a positive effect on profitability (Avenir, 2009). Moreover, Pearson’s correlation analysis revealed that eco-efficiency of energy has a positive significant correlation (r = 0.933; p