Int. J. Social Computing and Cyber-Physical Systems, Vol. 1, No. 1, 2011
Event-driven modelling of evolving social networks Baojun Qiu* Department of Computer Science and Engineering, The Pennsylvania State University, University Park, PA 16802, USA E-mail:
[email protected] *Corresponding author
Kristinka Ivanova, John Yen, Peng Liu and Frank E. Ritter College of Information Sciences and Technology, The Pennsylvania State University, University Park, PA 16802, USA E-mail:
[email protected] E-mail:
[email protected] E-mail:
[email protected] E-mail:
[email protected] Abstract: In many social networks, the connections between actors are formed because they participate in the same event, such as a set of scholars co-authoring a paper or colleagues having a teleconference. Therefore, we propose an event-driven model to capture the growth dynamics of social networks through modelling of the social events. We also investigate the evolution of event formation and the joint effect of attachedness and locality on the selection of participants for events in real social networks. We incorporate the evolution of event formation and the joint effect of attachedness and locality into our model. The experimental results suggest that our approach can simulate important network structures, such as hierarchical communities and assortativity, and better characterise the growing process of real networks than non-event driven models. Keywords: social network analysis; social network modelling; behaviour evolution; event-driven; simulation; collaborative networks; power-law degree distributions; clustering coefficients; assortative mixing. Reference to this paper should be made as follows: Qiu, B., Ivanova, K., Yen, J., Liu, P. and Ritter, F.E. (2011) ‘Event-driven modelling of evolving social networks’, Int. J. Social Computing and Cyber-Physical Systems, Vol. 1, No. 1, pp.13–32. Biographical notes: Baojun Qiu is a PhD candidate at the Department of Computer Science and Engineering and also doing a Master in the Department of Statistics at the Pennsylvania State University. He received his MEng in Computer Science and his BS in Mathematics from Peking University, China. His research interests include social network analysis, machine learning, and information retrieval.
Copyright © 2011 Inderscience Enterprises Ltd.
13
14
B. Qiu et al. Kristinka Ivanova obtained her PhD in Physics in 1991 from the Bulgarian Academy of Sciences, Sofia, Bulgaria where she worked subsequently. After spending one year as a Visiting Scientist at the Catholic University of Louvain at Louvain-la-Neuve, Belgium, she has been at the Pennsylvania State University since 1998. Her current research interests are primarily in the areas of network science and complex systems. The focus is on the understanding of organisation and functioning of complex systems. Complex systems of interest are complex socio-economic, financial and business systems as well as information, techno-social, and other systems with interwoven complex social behaviour. John Yen is a University Professor and the Director for Strategic Initiatives at College of Information Sciences and Technology at the Pennsylvania State University. He received his PhD in Computer Science from the University of California, Berkeley, his MS in Computer Science from Santa Clara University, and his BS in Electrical Engineering from National Taiwan University. His research interests include intelligent agents, team decision supports, and social network analysis, especially within the context of extreme events and health-related online communities. He received the NSF Young Investigator Award in 1992. He is a Fellow of IEEE. Peng Liu received his BS and his MS from the University of Science and Technology of China, and his PhD from George Mason University in 1999. He is a Professor of Information Sciences and Technology, the Director of the Center for Cyber-Security, Information Privacy, and Trust, and the Director of the Cyber Security Lab at Penn State. His research interests are in all areas of computer and network security. He has published a book and over 160 refereed technical papers. Frank E. Ritter is one of the founding faculty of the College of College of Information Sciences and Technology, an interdisciplinary academic unit at Penn State to study how people process information using technology. He is also affiliated with the Psychology, Computer Science and Engineering, and Industrial Engineering departments. His current research is in the development, application, and methodology of cognitive models, particularly as applied to interface design, predicting the effect of behavioural moderators, and understanding learning. He edits the Oxford Series on Cognitive Models and Architectures, is an editorial board member of Human Factors, AISBQ, and the Journal of Educational Psychology, and recently was the Technical Programme co-Chair for the BRIMS 2009 and BRIMS 2010 conferences, and will be for the BRIMS 2011 conference, and a co-Editor for corresponding special issues of the Computational and Mathematical Organization Theory.
1
Introduction
Social network and complex network studies have attracted increased interest in recent decades. Many real-world complex networks have been shown to exhibit a common set of properties. The properties include power-law degree distributions (Barabasi, 2003), the small world effect (Barabasi, 2003), assortative mixing (Newman, 2002; Redner, 2008), and kinetic properties exhibited in the growing process of social networks (Barabasi et al., 2002; Kumar et al., 2006; Leskovec et al., 2005), e.g., the shrinking diameter phenomenon. These properties in real networks represent a significant departure from
Event-driven modelling of evolving social networks
15
random networks (Bollobas, 2001). There is, however, little consensus on the cause of these non-random features. Social networks typically capture relationships (or connections) between actors (e.g., authors) through events (e.g., co-authoring a paper). In many real networks, the connections are formed between actors because they participate in the same event. For example, in collaborative networks, an event can constitute researchers co-authoring a paper together. Therefore, an event-driven approach is a natural way to model the growth of these event-based networks. For each pair of participants in an event, a connection is formed and all the participants form a clique (a clique Kn is a simple graph with n nodes in which all pairs of the nodes are directly connected). Therefore, numerous cliques are observed in these networks. It is difficult for non-event driven models (edge centric) to recreate this phenomenon. Event-driven models are also more general in that any edge centric model (modelling the formation of edges between node pairs) is equivalent to a corresponding event-driven model where exactly two actors participating in each single event. At last, in the event-drive context, we can model richer information. For example, three people, A, B, and C, participate in an event. A knows B and C, but if B and C do not know each other, then A is probably a bridge between B and C. Also, if we further consider the properties of the events and the causal relationship between events, we may garner more insights. In an evolving social network, the set of nodes and the set of edges change over time due to new nodes joining, old nodes leaving, and new connections forming between nodes. The behaviour of nodes (e.g., the selection of nodes to connect to) can vary widely and can evolve over time (Qiu et al., 2010). For example, in scientific collaboration networks, researchers usually publish papers with more senior researchers when they are junior, and more junior researchers when they are senior. In addition, the behaviour of a whole network can also evolve over time. For example, a research community may grow slowly at first, but the growth rate can then increase rapidly as it attracts more members and gains prestige. Most existing network growth models we have encountered do not consider the evolution of behaviour, especially from the perspective of event-driven growth. To characterise the growth of social networks, a variety of factors have been explored, including attachedness (the degree of nodes) and locality (distance between nodes) (Barabasi and Albert, 1999; Jin et al., 2001; Kumar et al., 2000; Zhang et al., 2010). Section 2 provides an overview of the existing studies. Nevertheless, the joint effect of attachedness (degree) and locality (distance) on network growth dynamics has not been well explored. In this paper, we study the evolution of event formation in real social networks and the joint effect of attachedness and locality on the selection of participants for events. We then introduce an event-driven growth model that incorporates the joint effect of attachedness and locality, as well as the evolution of event formation. Based on simulation results, we discover that our model can better characterise the growth of a large scale real network (e.g., collaborative networks in a nanotechnology community) in terms of exhibiting properties such as degree distribution, clustering coefficients, and assortative mixing. The rest of this paper is organised as follows: Section 2 introduces the background for this study and gives a brief review of related work. Section 3 presents some observations in real social networks that motivate our work. Section 4 describes the proposed event-driven driven framework for network growth model, and introduces an
16
B. Qiu et al.
event-driven locality and attachedness-based model that incorporates the joint effect of locality and attachedness and considers the evolution of node behaviour and event formation. Section 5 presents quantitative analysis of some important aspects of the model settings, compares the proposed model with two other models, and shows the impact of the model on the topological properties and correlated properties of the networks. Finally, Section 6 notes some potential future work and conclusions.
2
Related work
In recent years, there has been intense interest in the dynamics of complex networks. Much of this work has focused on the static analysis of social networks, as well as modelling both the static topological properties and dynamic patterns associated with real social networks. The majority of the studies focused on either attachedness or locality. Attachedness measures how well nodes are connected to other nodes in complex networks, and therefore is usually indicated by the degree of the nodes. Barabasi and Albert (1999) developed a notable preferential attachment (PA) theory that specifies high degree nodes are always favoured when building new connections. They proposed a model that new nodes are added to the network serially, while the probability that a new node will be linked to an existing vertex depends on the existing vertex’s degree di, di d j . Using these simple rules, their model generates networks exhibiting
∑
j
power-law degree distributions and the ‘rich get richer’ phenomena. Many existing models exploit the locality explicitly or implicitly, and assume that the formation of a new connection between two nodes is related to their distance in the existing topology. Jost and Joy (2002) describe a purely distance-based scheme where each new node is connected to a randomly selected node, and the subsequent connections are related to the distance of the destination node. Davidsen et al. (2002) present a referral model that connections are always formed between two nodes that share a common neighbour. This model emulates real-world introductions, where one person introduces two acquaintances. Such a simple evolution scheme is generally viewed as a basis for modelling the evolution of social networks. The authors demonstrate that this simple scheme is able to reproduce non-trivial features of social networks including small network diameter, high clustering, and scale-free or exponential degree distribution. The scheme is also known as the triangle-closing model (Leskovec et al., 2008). The copying mechanism (Kumar et al., 2000) specifies that at each time step a new node is added to the network. The new node copies a number of links from a ‘prototype’ node that is selected randomly from the existing nodes whereas choosing the remaining neighbours is random. Similar graph growth mechanisms also include models that implicitly or explicitly rely on the locality heuristics (Leskovec et al., 2005; Guimera et al., 2005; Kossinets and Watts, 2006; Krapivsky and Redner, 2001; Liben-Nowell and Kleinberg, 2007; Watts et al., 2002) or specified feature similarity (correlation) between nodes (Xuan et al., 2007). Some models also explicitly or implicitly exploit the joint effect of distance and locality. Vazquez (2001) has designed the walking on a network scheme to simulate the graph growth process. At every time step, a new node vi is added and linked to a randomly selected node vj through a directed edge. The node vi then mimics a ‘random walk’ on the network by following the edges starting from node vj and linking to their
Event-driven modelling of evolving social networks
17
end points with probability p. This step is repeated for those nodes to which new connections were established, until no new target node is found. Some more recent work on this front includes Morris and Goldstein’s (2007) team-based Yule model and Zhang et al.’s (2010) DDG model. The team-based Yule model maintains teams during modelling, and uses PA for within-team actor selection and random selection for generating new collaborations of actors outside the team. Hence, it adopts a binary locality measure (i.e., whether an author is within a team or outside of a team). In contrast, the DDG model uses the ratio of degree to distance to select two nodes to connect in the networks. In other words, the DDG model uses a ‘continuous’ measure for locality. Guimera et al. (2005) propose a team assembly mechanism by investigating the interplay between ‘incumbents’ and ‘newcomers’ in the context of collaboration networks. The model implicitly incorporates the evolution of node behaviour into modelling. Morris and Goldstein’s (2007) Yule model focused on modelling co-authorship networks. However, it differs from ours in several ways. First, we explicitly present an event-driven framework to model the growth dynamics of event-driven networks while they do not. Second, we study the behaviour evolution of nodes and event formation, which is incorporated into our model. In contrast, Morris and Goldstein’s model do not model the evolution of behaviour. Third, our model is more efficient than the Yule model because we do not have to maintain any team structure.
3
Observations and motivations
In this section, we present some observations from a nanotechnology collaboration network, NanoSCI, as well as the motivations for our event-based hybrid model. NanoSCI is a collection of papers on nanotechnology. It offers an extensive database including 292,323 researchers and 368,511 papers that are indexed by the Science Citation Index (SCI) database spanning 1980 to 2006. In this paper, we use data from 1980 to 2005 because our data for 2006 is only complete through August 2006. NanoSCI is appealing for investigating social network growth dynamics for the following reasons. First, collaborative networks have been widely used in scientometrics and social networks studies. Second, collaboration networks have been known to possess many static and dynamic properties that are similar to other social networks (Barabasi et al., 2002; Newman, 2004). NanoParticle, a sub-community in NanoSCI, is also studied in this paper. NanoParticle has 81,734 authors and 69,530 papers spanning 1980 to 2006. In the following subsections, we study the formation of events and their evolution regarding the number of participants. We then study the behaviour evolution of nodes with respect to their activeness. Finally, we study the effects of degree and distance on formation of new connections and events.
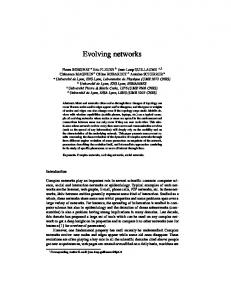
3.1 Growth rates In this section, we assess the growth rate in terms of the number of events (papers), nodes (authors), and edges (collaborations). Figure 1 shows in log-log scale the edge growth versus node growth for the NanoParticle and NanoSCI communities respectively with duplicated edges removed. It appears that the growth speed is almost linear in
18
B. Qiu et al.
the log-log scale, which implies that the edge growth increase as a power law function of the node growth. The regression results show that their growth rates are |E(t)| = 2.3453 * |V(t)|1.0238 and |E(t)| = 2.5475 * |V(t)|1.0409, respectively. E(t) and V(t) are the edge set and the node set in the cumulative network at time t respectively. The corresponding edge densification rates [derivative on V(t)] for the two communities are ΔE(t) = 2.4011 * |V(t)|–0.0238 and ΔE(t) = 2.6517 * |V(t)|–0.0409, respectively. Figure 1
The number of papers (events) and the number of collaborations (edges) increase linearly in log-log scale with the number of authors (nodes) (see online version for colours)
The edge density is important for growth models. For example, the PA model (Barabasi and Albert, 1999) assumes that the number of edges has a linear relationship with the number of nodes. With different setting of the slopes in the linear relationship, the model shows different behaviours on some properties, e.g., clustering coefficients. In Section 5.4, we also present a variant PA model, APA. APA uses the growth rate learned from NanoSCI instead of linear growth. APA shows a different behaviour than PA. Because we are studying event-based models, we also study the relationship between the number of paper-writing events and the number of nodes. Figure 1 also shows the node growth versus event growth for the NanoParticle and NanoSCI communities respectively. It appears that the growth speed is almost linear in the log-log scale, which implies that the node growth increase as a power law function of the event growth. The regression results show that their growth rates are |D(t)| = 1.0636 * |V(t)|0.9850 and |D(t)| = 1.2746 * |V(t)|0.9855 respectively, where D(t) is the number of events (papers) occurred before time t. Thus, the corresponding node densification rates for the two communities are ΔD(t) = 1.0476 * |V(t)|–0.0150 and ΔD(t) = 1.2561 * |V(t)|–0.0145.
3.2 The number of participants in events and its evolution The number of participants for an event is an important factor because it determines the order of a clique (and the number of new connections) formed in a collaborative network.
Event-driven modelling of evolving social networks
19
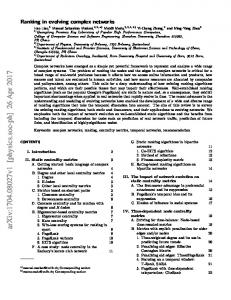
It has been reported that the number of secondary authors (authors other than the first author) tends to be a Poisson distribution (Morris and Goldstein, 2007). Our observations in NanoSCI and NanoParticle verify this. In Figure 2(a), the distributions of the number of secondary authors in both NanoSCI and NanoParticle match a Poisson distribution closely, although they have heavier tails than a Poisson. The average number of co-author (plus the number of secondary author by 1) is 4.3576 and 4.3563 for NanoSCI and NanoParticle respectively. Figure 2
(a) Distribution of the number of secondary authors per paper vs. Poisson distribution (b) the average number of co-authors per paper evolve linearly in semi-log scale with the number of total nodes in both NanoSCI and NanoParticle (see online version for colours)
(a)
(b)
20
B. Qiu et al.
We also notice that the average number of participants (co-authors) in events (papers) evolves over time. Figure 2(b) shows that the mean numbers of co-authors in both NanoSCI and NanoParticle increase nearly linearly in semi-log scale from around 4.0 to nearly 5.0 in the latest ten years. It suggests that researchers are becoming more collaborative in recent years. Similar observations have also been reported, for example, in the collaboration network of computer science (Huang et al., 2008). The average number of participants in an event-driven model is very important because it decides the order of the resulted cliques in the collaborative networks, and the edge density of the # edge n(n − 1) / 2 n − 1 = = . resulted sub-graph because the edge density of a clique is # node n 2 Also, it has an effect on average separation and clustering coefficients in networks. Therefore, it is important to include the evolution of the average number of participants in the growth model.
3.3 The selection of participants for events In event-driven networks, the number of events a node can participate in is limited due to the nodes’ available time and effort. Also, different nodes may have different degrees of activeness due to differences of their interests. In this section, we study participant selection for events. Specifically, we study the research lifetime of researchers (details in the following Section 3.3.1), effect of node degree and distance between node pairs on participation in events, and the interaction between degree and distance on determining new connections.
3.3.1 Distribution of lifetime of nodes We studied the distribution of research lifetime of researchers in NanoSCI. The research lifetime of a researcher is defined as the length in years from the researcher joining the community to leaving the community. However, there is no explicit signal when a researcher leaves. Therefore, we decide that a node has left if it has been inactive for 3+ years (Qiu et al., 2010). Figure 3(a) shows the distribution of lifetimes of nodes that have been inactive for 3+ years in NanoSCI in 2005. The lifetime suggests how soon nodes evolve from active to inactive. In other words, we are using a binary measurement of the researcher activeness. In the figure, we see that about 80% of researchers switch from active status to inactive in one year and a very small fraction of researchers can stay active in the community longer than five years. This makes sense because many coauthors are graduate students, they leave the community after they graduate, and only a few of them may stay in the community as faculty or scientists. Figure 3(a) also shows the seniority (Qiu et al., 2010) distribution of all nodes and active nodes in 2005. Seniority measures the length of time the nodes have been active in the networks. However, it is hard to model time in years in growth models. Note that the degrees and the active time of nodes has high correlations for both NanoSCI and NanoParticle. In other words, junior researchers usually have small degrees and active senior researchers usually have high degrees, and vice versa. Therefore, we can use degrees of the leaving nodes to approximate their lifetimes. Figure 3(b) shows the degree distributions of inactive nodes in NanoSCI in 2005. In other words, it shows the lifetimes measured in degree. In the simulation, when a node joins the network, the model randomly samples a maximum allowed degree the node can have from the lifetime (measured in degree)
Event-driven modelling of evolving social networks
21
distribution observed in the real data. Once the node achieves the maximum degree, it becomes inactive. Note that the maximum number of events a node can participate in is a good measure of lifetime as well, and we see that models using either maximum allowed degrees or maximum allowed events show similar results. Also, notice that this is a snapshot, the real distribution would be slightly different because the endpoints in the world are not artificially bounded. Figure 3
(a) Distribution of lifetimes in years and seniority distributions of nodes in NanoSCI in 2005 (b) degree distributions of all nodes in NanoSCI and of inactive nodes obey power law like dependency with an exponential cut-off P(k) ∝ k–τ e–k/kc (see online version for colours)
(a)
(b)
22 Figure 4
B. Qiu et al. (a) The percentage of nodes with certain degrees that form new connections (b) the percentage of node pairs with certain distance that form new connections (see online version for colours)
(a)
(b)
3.3.2 Effects of locality and attachedness Locality and attachedness have been traditionally considered as principal factors in the formation of connections. In Figure 4(a), we show the proportion Fd(k) = Mk / Nk, where Nk denotes the number of nodes with degree equal to k, and Mk are the nodes among them that form new edges in the next year (2002 or 2005). In Figure 4(b), we show the proportion Fr(r) = Mr / Nr, where Nr denotes the number of node pairs at distance r, and
Event-driven modelling of evolving social networks
23
Mr are the pairs among them that form new edges in the next year (2002 or 2005). These demonstrate explicitly that nodes form new links proportionally to the degrees (when degrees are not extremely large) of the nodes and inversely proportionally to their topological distance. Note that in Figure 4(a), for extremely large degrees (> 100), the ratios for NanoSCI (2002) and NanoParticle (2002) are not accurate due to too few nodes with such large degrees (therefore, the corresponding points in the figure are not connected by the curves), while for NanoSCI (2005) and NanoParticle (2005), the ratios are relatively smaller – it suggests that nodes with extremely high degree could be less active. From Figure 4(b), we can also see that the majority of the edges are formed between node pairs at distance 2. To distinguish the joint effect of degree and distance, we need to find a function F(.) satisfying Pr(u, v) ∝ F(d(u), d(v), r(u, v)) such that its marginal distribution on d(u) [or d(v)] and on r(u, v) has a similar shape as that shown in Figure 4(a) and Figure 4(b), respectively, where u and v are two nodes in a network, Pr(u, v) is the probability to form a connection between u and v. d(.) is a function to get the degree of a node, r(.) is a function to return the distance between the input node pair. It is generally a hard problem to discover the function. One of the ways to approximate it is to define a set of simple functions such as exponential, log, multiplication, minus, etc., then use a genetic algorithm (GA) (Mitchell, 1996) to build formulas based on the predefined function set. Maximum likelihood estimate (MLE) can be used to choose a formula that has the best fit to data. Due to limited space, we leave this to another paper. Instead, we study in the next subsection the interaction between degree and distance. Specifically, we study, given the degree of a node, how likely the node will connect to nodes with different hop distances away.
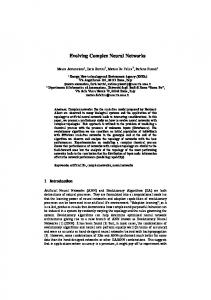
3.3.3 The span distance of new edges vs. the degree of nodes Span distance of a new edge is the distance between the end nodes of the edge at the moment before the formation of the edge. In Figure 5, we show a distribution of span distances of the new edges connected to nodes with different degree ranges. Note that repeated edges (hop distance equal to 1) are removed. From the figure, we see that nodes with all levels of seniority (degree) have significant high probabilities to connect to nodes two hops away. The probability to connect to nodes with a long distance tends to decrease for all types of nodes, and the trends are more significant for nodes with rich experience. For example, the most junior researchers (black star solid curve) have almost identical probabilities to make new edges spanning three to seven hops and then have less and less probabilities to make new edges spanning more hops. For the most senior researchers (blue square solid curve), the probabilities always decrease as the span distance increases. This may suggest that senior researchers usually have stable local groups to collaborate with and may have more stable research topics as well. The factor of locality seem always to play a role when making connections for senior researchers. However, for junior researchers, the locality has much less effect especially when hop distance is equal to three to seven. Also, junior researchers have higher probabilities than senior ones to connect to nodes that are originally far away. Note that the curves corresponding to nodes with high degrees may be shorter, because they on average have smaller separation to all nodes in the networks. In the figure, Distance = Inf indicates that edges are formed between two disconnected nodes, and Distance = –1 means that the edges are connected to new added nodes.
24
B. Qiu et al.
Figure 5
Distributions of span distances of the new edges connected from nodes with certain degrees in NanoSCI in 2005
Note: Distance r = Inf indicates edges connected to disconnected nodes, and r = –1 indicates edges connected to new nodes with degree 0.
4
An event-driven framework and a hybrid growth model
We have argued that an event-driven model may be a more general and natural way to model networks, and have seen that both locality and attachedness play important roles in network dynamics. We have also studied behaviour evolution. In this section, we propose an event-driven framework for modelling networks. Based on the framework, we develop an event-driven locality and attachedness based growth model. To compare the networks generated by different models, it is important that the numbers of nodes and edge densities in the networks are identical. For non-event driven models, they can directly use the same edge densities defined in Section 3.1. To compare event-driven with non-event driven models, we should also make them have the same edge densities. The following specification describes the details of the event-driven framework. It also ensures that the event-driven models can have the same edge densities defined in Section 3.1. 1
t ← 0.
2
Add an event as follows: (a)
(b)
Sample m (the number of participating nodes) according to Pr(m) ∝ Fm. Fm is the distribution of the number of participants in events. It can be a Poisson distribution or the distribution observed in real networks, please refer to Section 3.2. WHILE C(m + 1, 2) > |E(t)| – |Ec|, where |Ec| is the number of edges in the current network and |Et| is the number of edges at time t estimated according to some predefined edge density.
Event-driven modelling of evolving social networks
25
1 Repeat: add one new node and set t ← t + 1. Sample m nodes as participants based on some schema, for example preference attachment or hybrid schema, put all selected nodes into SetP (the set of participants in the event). (d) Form connections between nodes in SetP according to some schema, for example, for a collaborative network, an edge is formed between any node pair.
(c)
3
Repeat 2 until t is equal to predefined parameter.
Based on the framework, we propose an evolution-aware event-driven locality and attachedness-based growth (EELAG) model described as follows: a
Replace Step 2(a) with: •
b
Step 2(b)1 is changed to: •
c
Sample m according to Pr(m) ∝ Fm(λ(t)). Fm is a stochastic Poisson distribution with its mean evolving over time or the distribution observed in real networks (see Section 3.2 for details). Repeat: add one new node n, sample the lifetime of the node nlifetime according to P(f) ∝ Ff, set lifetimedegree(n) ← nlifetime, and set t ← t + 1. Ff is the lifetime (measured in degree) distribution predefined or learned from real data (refer to 3.3.1 for more information).
Step 2(c) is replaced with the following statements: •
With a probability Pα, set u ← the newly added node. Otherwise, set u ← randomly sample an active node u(d(u) < lifetimedegree(u)) according to a PA d (u ) + 1 . Pα is set according to the percentage of papers schema: Pr (u ) ∝ (d (v) + 1)
∑
v
including new researchers in the real data. •
SetP ← SetP ∪ {u}
•
WHILE d(u) = = 0 AND |SetP| < m
•
1
set u ← randomly sample an active node using PA schema
2
SetP ← SetP ∪ {u}.
WHILE |SetP| < m 1
2
based on d(u), sample a distance r according to Pr(r) ∝ Frd(r|d). Frd(r|d) is learned from real data (more information in Section 3.3.3) or some approximating functions randomly select nodes with distance r.
In summary, this model first decides the number of participants based on a stochastic Poisson distribution, then samples a node as the leading node with using PA. Whenever the sampled node is not connected to the graph, a new node is sampled as leading node and the previous node is kept as a participant. Then, based on the degree of the leading node, it decides the probabilities for how far away to make new connections, and then randomly chooses nodes. This model is proposed based on the observations and motivation introduced in Section 3.
26
5
B. Qiu et al.
Simulation and evaluation
We set up experiments to evaluate the proposed framework and the EELAG model. We use experiments to compare event-driven models with the corresponding non-event driven models, and study the effect of the average number of participants of events in event-driven models. We also compare EELAG with some other models that use attachment preference or locality preference, respectively. We set the growth rates as the same as that in NanoSCI for all models and simulate networks of the same size as that of NanoSCI.
5.1 Event-driven vs. non-event-driven In this subsection, we study the difference on clustering coefficients in networks generated by event-driven models and corresponding non-event driven models. To focus on the comparisons between event-driven and non-event driven models and avoid including effects of other factors, a simple purely random (PR) model and its corresponding event-driven variant (EPR) are used. In the PR model, in each time step, a node is added and some connections are made between uniformly randomly selected pairs of nodes. For EPR, we only need to change a step in the event-driven framework as: uniformly randomly select m nodes as the participants for the event. An identical edge density is used for both PR and EPR. Figure 6 shows degree-dependent clustering coefficients, C(k), that are defined as the average local clustering coefficients (LCC) of all nodes with degree k. C(k) of NanoSCI can be reasonably fit by a power law C(k) ∝ k–α with α = 0.82. This kind of power-law decay of degree dependent clustering coefficients is a signature of a hierarchical structure in the network (Vazquez et al., 2002). The networks generated by EPR has a higher LCC than those generated by PR, and share the same trend with C(k) observed in NanoSCI. Figure 6
The average LCC as a function of the degree of nodes (event-driven vs. non-event driven) (see online version for colours)
Event-driven modelling of evolving social networks
27
Note that for each model, we generate 50 networks and the figure shows the average C(k) calculated from the networks. For all the following experiments, we do it the same way.
5.2 The effect of average number of participants in event-driven models In the event-driven model, the numbers of participants of events are sampled from a Poisson distribution. In this subsection, we study how the average number of participants affects the clustering coefficients. Again, we use the simple PR event-driven model, EPR, instead of more complex models to focus on identifying the effect of the average number of participants in the event-driven models. We use three versions of the model with the Poisson’s mean equal to 2, 4, and 8 respectively. The edge density is fixed in all three variants. Figure 7 shows that with different average numbers of participants, although the trends of C(k) are similar, the absolute values of C(k) of the generated networks are quite different. We see that C(k) is higher in networks generated by models with larger average numbers of participants, indicating more closing triangles in the network (neighbours of a node are also neighbours). Figure 7
The average LCC as a function of the degree of nodes (different average number of participants in event-driven models) (see online version for colours)
5.3 Behaviour evolution vs. none behaviour evolution In this subsection, we compare a behaviour evolution version of the EPR model (EEPR) with EPR. One difference between these two models is that EEPR has activeness (lifetime) control on nodes. The other difference is that EPR uses a fixed average number of participants (overall mean number of co-authors in NanoSCI), while EEPR uses an evolving average number as that in NanoSCI (as shown in Section 3.2). The edge densities used by these two models are the same. Figure 8 shows EEPR has slightly better performance in modelling the degree distribution, especially for small degrees.
28 Figure 8
B. Qiu et al. Degree distributions (behaviour evolution vs. none behaviour evolution) (see online version for colours)
5.4 Comparisons between EELAG, APA and ADG on simulating NanoSCI In this section, we compare the EELAG with the APA and the ADG models. APA is a variant from Barabasi et al.’s (2002) PA model. In each time step, one new node is added, and the number of new edges are decided from the growth rate and edge density learned from NanoSCI. We do the modifications for the purpose of fair comparisons that all models should follow the same growth rate and edge density. The edges in each step are formed between the newest node and other nodes selected according to their degrees. ADG also adds one node and a number of new edges decided by the NanoSCI’s growth rate at each step. It first randomly selects a start node u, and then select end nodes with probabilities p according to the distance r to the end nodes. Specifically, p = 1 = r, where r is the distance. For disconnected nodes, the distances r are defined as a large enough value (e.g., 20) instead of infinity. Therefore, the disconnected nodes also have chance to form edges. For both APA and ADG, networks are grow on an initial network. The initial network has 500 nodes and edges are formed by a simply random process as that in PR. The edge density is as the same as that in NanoSCI. We choose APA and ADG because they are derived from classical models and use the factor of the degree and the distance, respectively.
5.4.1 Degree distribution In this subsection, we study the degree distributions of the simulated networks created using different models, and compare them with the distribution observed in NanoSCI. Figure 9 suggests that EELAG recreates the similar phenomenon in NanoSCI on the proportions of nodes with small degrees, while ADG and APA do not recreate the
Event-driven modelling of evolving social networks
29
phenomenon. For proportions at higher degrees, the networks generated by EELAG agree with NanoSCI and have very similar power-law decay. Figure 9
Degree distributions (EELAG, APA and ADG) (see online version for colours)
5.4.2 Degree-dependent clustering coefficients We study C(k) of the networks simulated by different models. From Figure 10, we see that APA fails to simulate the trends observed in NanoSCI. Both EELAG and ADG show similar trends on C(k) to NanoSCI, however, EELAG is much closer to NanoSCI. Figure 10 The average LCC as a function of the degree of nodes (EELAG, APA and ADG) (see online version for colours)
30
B. Qiu et al.
5.4.3 The average degree of the nearest neighbours Social networks are known to be assortative that the degree of connected nodes shows a positive correlation. Statistical analysis can be extended by inspecting knn(k), which is the average degree of neighbours of all nodes with degree equal to k. For assortative (disassortative) networks, knn(k) is monotonically increasing (decreasing) function of k. NanoSCI is an assortative network and knn(k) of NanoSCI can be approximated by a power law knn(k) ∝ k–β, with β = 0.21. Again, EELAG performs better than both APA and ADG, and its knn(k) is very close to that of NanoSCI in Figure 11. Note that the behaviour of APA is different from that of Barabasi et al.’s (2002) PA reported by Newman (2002) because APA uses an evolving growth rate observed in NanoSCI instead of a constant linear growth. Figure 11 The average degree of neighbours as a function of degree (EELAG, APA and ADG) (see online version for colours)
6
Conclusions
In many social networks, connections are formed between actors because they are involved in the same event. For these networks, it is natural, general, and powerful to use event-driven models to characterise their growth dynamics. Therefore, we propose an event-driven framework to facilitate the creation of event-driven growth models. We have also studied the evolution of node behaviour (activeness) and event formation in social networks, and exploited the effect of both locality and attachedness on the formation of new edges. We found that the average number of participants of events evolve over time in NanoSCI, and the effects of distance and degree on selection of participants of events also change over time. These analysis lead us to propose a hybrid model based on an event-driven framework that considers the evolution of event formation and the joint effects of distance and degree. Based on metrics that are informative in characterising the network
Event-driven modelling of evolving social networks
31
structure, such as degree distribution, degree-dependent clustering coefficients and knn(k), our experiments show that the networks generated by our event-driven hybrid model exhibit structures similar to real networks, while other non-event driven models fail to recreate these structures. Future work arising from our results so far includes: carrying out experiments on more real networks, further studies of important factors of connection formation and their joint effect, modelling events with richer information, and incorporating more aspects of behaviour evolution.
Acknowledgements This work was supported by a grant from the Defense Threat Reduction Agency (HDTRA1-09-1-0054). The authors would like to thank Jonathan H. Morgan, Junya Morita and the anonymous reviewers for helpful comments.
References Barabasi, A.L., Jeong, H., Neda, Z., Ravasz, E., Schubert, A. and Vicsek, T. (2002) ‘Evolution of the social network of scientific collaborations’, Physica A, Vol. 311, pp.3–4. Barabasi, A-L. (2003) Linked: How Everything is Connected to Everything Else and What It Means for Business, Science, and Everyday Life, Plume, New York. Barabasi, A-L. and Albert, R. (1999) ‘Emergence of scaling in random networks’, Science, Vol. 286, pp.509–512. Bollobas, B. (2001) Random Graphs, 2nd ed., Cambridge University Press. Davidsen, J., Ebel, H. and Bornholdt, S. (2002) ‘Emergence of a small world from local interactions: modeling acquaintance networks’, Physical Review Letters, Vol. 88, pp.128701. Guimera, R., Uzzi, B., Spiro, J. and Amaral, L.A.N. (2005) ‘Team assembly mechanisms determine collaboration network structure and team performance’, Science, Vol. 308, pp.697–702. Huang, J., Zhuang, Z., Li, J. and Giles, C.L. (2008) ‘Collaboration over time: characterizing and modeling network evolution’, Proceedings of the 1st ACM International Conference on Web Search and Data Mining (WSDM), pp.107–116. Jin, E.M., Girvan, M. and Newman, M.E.J. (2001) ‘The structure of growing social networks’, Physical Review E, Vol. 64, p.046132. Jost, J. and Joy, M.P. (2002) ‘Evolving networks with distance preferences’, Physical Review E, Vol. 66, p.036126. Kossinets, G. and Watts, D.J. (2006) ‘Empirical analysis of an evolving social network’, Science, Vol. 311, pp.88–90. Krapivsky, L. and Redner, S. (2001) ‘Organization of growing random networks’, Physical Review E, Vol. 63, p.066123. Kumar, R., Novak, J. and Tomkins, A. (2006) ‘Structure and evolution of online social networks’, Proceedings of the ACM SIGKDD International Conference on Knowledge Discovery and Data Mining, 2006, pp.611–617. Kumar, R., Raghavan, P., Rajagopalan, S., Sivakumar, D., Tomkins, A. and Upfal, E. (2000) ‘The web as a graph’, Proceedings of the ACM SIGMOD-SIGACT-SIGART Symposium on Principles of Database Systems of Data (PODS), 2000, pp.1–10. Leskovec, J., Backstrom, L., Kumar, R. and Tomkins, A. (2008) ‘Microscopic evolution of social networks’, Proceedings of the ACM SIGKDD International Conference on Knowledge Discovery and Data Mining, pp.462–470.
32
B. Qiu et al.
Leskovec, J., Kleinberg, J. and Faloutsos, C. (2005) ‘Graphs over time: densification laws, shrinking diameters and possible explanations’, Proceedings of the ACM SIGKDD International Conference on Knowledge Discovery and Data Mining, 2005, pp.177–187. Liben-Nowell, D. and Kleinberg, J. (2007) ‘The link prediction problem for social networks’, Journal of American Society for Information Science and Technology, Vol. 58, No. 7, pp.1019–1031. Mitchell, M. (1996) An Introduction to Genetic Algorithms, MIT Press, Cambridge, MA. Morris, S.A. and Goldstein, M.L. (2007) ‘Manifestation of research teams in journal literature: a growth model of papers, authors, collaboration, coauthorship, weak ties and Lotka’s law’, Journal of American Society for Information Science and Technology, Vol. 58, No. 12, pp.1764–1782. Newman, M.E.J. (2002) ‘Assortative mixing in networks’, Phys. Rev. Letter, Vol. 89, p.208701. Newman, M.E.J. (2004) ‘Coauthorship networks and patterns of scientific collaboration’, Proceedings of National Academy Sciences USA, Vol. 101, No. Suppl. 1, pp.5200–5205. Qiu, B., Ivanova, K., Yen, J. and Liu, P. (2010) ‘Study of effect of node seniority in social networks’, Proceedings of the IEEE International Conference on Intelligence and Security Informatics (ISI), 2010, pp.147–149. Redner, S. (2008) ‘Testing out the missing links’, Nature, Vol. 453, pp.47–48. Vazquez, A. (2001) ‘Knowing a network by walking on it: emergence of scaling’, Europhysics Letters, Vol. 54, pp.430–435. Vazquez, A., Pastor-Satorras, R. and Vespignani, A. (2002) ‘Large-scale topological and dynamical properties of the internet’, Phys. Rev. E, Vol. 65, p.066130. Watts, D.J., Dodds, P.S. and Newman, M.E.J. (2002) ‘Identity and search in social networks’, Science, Vol. 296, pp.1302–1305. Xuan, Q., Li, Y. and Wu, T-J. (2007) ‘A local-world network model based on inter-node correlation degree’, Physica A, Vol. 378, pp.561–572. Zhang, H., Qiu, B., Ivanova, K., Foley, H.C., Giles, C.L. and Yen, J. (2010) ‘Locality and attachedness-based temporal social network growth dynamics analysis: a case study of evolving nanotechnology scientific collaboration networks’, Journal of the American Society for Information Science and Technology, Vol. 61, No. 5, pp.964–977.