Feb 1, 2006 - Such rules are typically local when dealing with biological systems and ... of the community and the underlying hierarchical organization play a key role is shaping its ... In many cases, large-scale, system-level properties emerge from local ... new software errors (bug tracking) and in the subsequent e-mail ...
arXiv:physics/0602005v1 [physics.soc-ph] 1 Feb 2006
Europhysics Letters
PREPRINT
Evolving Social Weighted Networks: Nonlocal Dynamics of Open Source Communities Sergi Valverde 1 and Ricard V. Sol´ e 1,2 1
ICREA-Complex Systems Lab - Universitat Pompeu Fabra, Dr. Aiguader 80, 08003 Barcelona, Spain 2 Santa Fe Institute - 1399 Hyde Park Road, New Mexico 87501, USA
PACS. 89.65.-s – Social systems. PACS. 05.10.-a – Computational methods in statistical physics and nonlinear dynamics. PACS. 05.70.-Ln – Nonequilibrium and irreversible thermodynamics.
Abstract. – Complex networks emerge under different conditions through simple rules of growth and evolution. Such rules are typically local when dealing with biological systems and most social webs. An important deviation from such scenario is provided by communities of agents engaged in technology development, such as open source (OS) communities. Here we analyze their network structure, showing that it defines a complex weighted network with scaling laws at different levels, as measured by looking at e-mail exchanges. We also present a simple model of network growth involving non-local rules based on betweenness centrality. The model outcomes fit very well the observed scaling laws, suggesting that the overall goals of the community and the underlying hierarchical organization play a key role is shaping its dynamics.
Introduction. – Networks predate complexity, from biology to society and technology [1]. In many cases, large-scale, system-level properties emerge from local interactions among network components. This is consistent with the general lack of global goals that pervade cellular webs or acquaintance networks. However, when dealing with large-scale technological designs, the situation can be rather different. This is particularly true for some communities of designers working together in a decentralized manner. Open source communities, in particular, provide the most interesting example, where software is developed through distributed cooperation among many agents. The software systems are themselves complex networks [2,3,4], which have been shown to display small world and scale-free architecture. In this paper we analyse the global organization of these problem-solving communities and the possible rules of self-organization that drive their evolution as weighted networks. Following [5], we have analyzed the structure and modeled the evolution of social interaction in OS communities [6]. Here e-mail is an important vehicle of communication and we can recover social interactions by analyzing the full register of e-mails exchanged between community members. From this dataset, we have focused on the subset of e-mails describing new software errors (bug tracking) and in the subsequent e-mail discussion on how to solve the error (bug fixing). Nodes vi ∈ V in the social network G = (V, L) represent community c EDP Sciences
2
EUROPHYSICS LETTERS
�
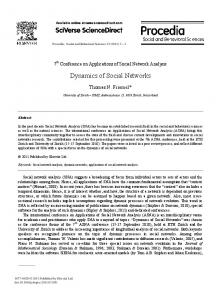
Fig. 1 – Social network of e-mail exchanges in open source communities display hierarchical features. Line thickness represents the number of e-mails flowing from the sender to the receiver. Darker nodes and links denote active members and frequent communication, respectively. (A) Social network for the Amavis community has N = 98 members, where the three center nodes display the largest traffic loads. (B) Social network for the TCL community has N = 215 members and average degree hki ≈ 3. There is a small subgraph of core members (i.e., the hierarchical backbone) concentrating the bulk of e-mail traffic. Note how strong edges connect nodes with heavy traffic load.
members while directed links (i, j) ∈ L denote e-mail communication whether the member i replies to the member j. At time t, a member vi discovers a new software error (bug) and sends a notification e-mail. Then, other members investigate the origin of the software bug and eventually reply to the message, either explaining the solution or asking for more information. Here Eij (t) = 1 if developer i replies to developer j at time t and is zero otherwise. Link weight eij is the total amount of e-mail traffic flowing from developer i to developer j: eij =
T X
Eij (t)
(1)
t=0
where T is the timespan of software development. We have found that e-mail traffic is highly symmetric, i. e. eij ≈ eji . In order to measure link symmetry, we introduce a weighted measure of link reciprocity [7] namely the link weight reciprocity ρw , defined as P ¯)(eji − e¯) i6=j (eij − e w P (2) ρ = ¯)2 i6=j (eij − e P where e¯ = i6=j eij /N (N − 1) is the average link weight. This coefficient enables us to differentiate between weighted reciprocal networks (ρw > 0) and weighted antireciprocal networks (ρw < 0). The neutral case is given by ρw ≈ 0. All systems analyzed here display strong symmetry, with ρw ≈ 1. This pattern can be explained in terms of fair reciprocity [8], where any member replies to every received e-mail. In the following, we will focus in the analysis of the undirected (and weighted) graph. Let us define edge weight (interaction strength) as wij = eij + eji , which provides a measure of traffic exchanges between any pair of members. Two measures of node centrality are frequenly used to evaluate node importance. A global centrality measure is betweeness centrality bi [9] (i. e. node load [10]) measured as the number of shortests paths passing through the node i. Node strength [11] is a local measure defined as
Sergi Valverde and Ricard V. Sol´ e: Evolving Social Weighted Networks: Nonlocal Dynamics of Open Source Com
5
10
A
B
3
10
C
1.59
3
10
10
1
10
1
10
0
10 1
10
0
0
2
1
10
10
0.57
P>(b)
10
10
0.97
2
4
P>(k)
2
2
10
10
3
10
10
k
k
0
10
2
4
10
10
6
10
b
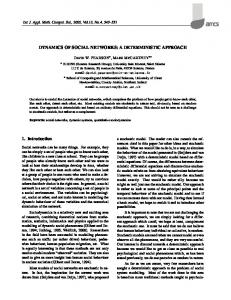
Fig. 2 – (A) Average betweeness centrality vs degree hb(k)i ∼ kη where η ≈ 1.59 for the Python OS community. This exponent is close to the theoretical prediction ηBA ≈ (γ − 1)/(δ − 1) = 1.70 (see text). (B) Cumulative distribution of undirected degree P> (k) ∼ k−γ+1 with γ ≈ 1.97. (C) Cumulative distribution of betweeness centrality P> (b) ∼ b−δ+1 with δ ≈ 1.57.
si =
X
j
wij
(3)
i. e. the total number of messages exchanged between node i and the rest of the community. The correlation of centrality measures with local measures (such as undirected degree ki ) can be used to asses the impact of global forces on network dynamics. Figure 1 shows two social networks recovered with the above method. We can appreciate an heterogeneous pattern of e-mail interaction, where a few nodes generate a large fraction of e-mail replies. The undirected degree distribution is a power-law P (k) ∼ k −γ with γ ≈ 2 (see fig. 2B). These social networks exhibit a clear hump for large degrees. Betweeness centrality displays a long tail P (b) ∼ b−δ with an exponent δ between 1.3 and 1.8 (see table I and also fig. 2C). It was shown that betweeness centrality scales with degree in the network of Internet autonomous systems and in the Barab´ asi-Albert network [12], as b(k) ∼ k −η . From the cumulative degree distribution, i. e. Z ∞ P> (k) = P (k)dk ∼ k 1−γ (4) k
and the corresponding integrated betweenness, with P> (b) ∼ b1−δ , it follows that η = (γ − 1)/(δ − 1) [13]. The social networks studied here display a similar scaling law with an exponent η slightly departing from the theoretical prediction (see fig. 2A and table I). Project Python Gaim Slashcode PCGEN TCL
N 1090 1415 643 579 215
L 3207 2692 1093 1654 590
hki 2.94 1.9 1.69 2.85 2.74
γ 1.97 1.97 1.88 2.04 1.97
δ 1.57 1.8 1.58 1.67 1.33
η 1.59 1.24 1.42 1.54 2.34
(γ − 1)/(δ − 1) 1.70 1.21 1.51 1.55 2.93
Table I – Topological measures performed over large OS weighted nets. The two last columns at left compare the observed η exponent with the theoretical prediction η = (γ − 1)/(δ − 1) (see text).
4
EUROPHYSICS LETTERS
3
B 0
10
0.98
w
,
A 10
2
10
-1
10 0.75 1
10
0
10
1
1
2
10
2
10
10
10 k
k
Fig. 3 – Correlations in the Python OS community. (A) Average degree of nearest neighbors vs degree hknn i ∼ kθ where θ ≈ 0.75 (open circles). The social network is dissasortative from the structural point of view. However, the weighted average nearest neighbors degree (solid circles) captures more precisely the level of affinity in the community (see text). Instead, traffic is redirected to the core subset of highly connected nodes (backbone). (B) Average clustering vs degree hC(k)i ∼ kβ with β ≈ 1.
However, a detailed analysis reveals a number of particular features intrinsic to these social networks. Correlations and Hierarchy in OS Networks. – A remarkable feature of software communities is their hierarchical structure (see fig.1), which introduces non-trivial correlations in the social network topology. We can detect the presence of node-node correlations by measuring P the average nearest-neighbors degree knn (k) = k′ k ′ P (k|k ′ ) where P (k|k ′ ) is the conditional probability of having a link attached to nodes with degree k and k ′ . In the absence of correlations, P (k|k ′ ) is constant and does not depend on k. Here, the average nearest-neighbors degree decays as a power-law of degree, hknn i ∼ k −θ with θ ≈ 0.75 (see fig. 3A ). This decreasing behaviour of knn denotes that low-connected nodes are linked to highly connected nodes (see fig. 1A) and thus, these networks are dissasortative from the topological point of view. However, the same networks are assortative when we analyze edge weights. We have observed that frequent e-mail exchanges take place between highly connected members. Following [11], we define the weighted average nearest-neighbors degree, w knn,i
k 1 X wij kj = si j=1
(5)
where neighbor degree kj is weighted by the ratio (wij /si ). According to this definition, w w knn,i > knn if strong edges point to neighbors with large degree and knn,i < knn otherwise. In software communities, weighted average nearest-neighbors degree is almost uncorrelated with node degree, that is, knn,i ≈ constant (see fig.3A). Low connected nodes have weak w edges because knn,i (k) is only slightly larger than knn (k) for small k (see fig.3A). The social network is assortative because strong edges attach to nodes with many links, i.e., the difference w knn,i (k) − knn (k) is always positive and increases with degree k. The hierarchical nature of these graphs is well illustrated from the scaling exhibited by the clustering C(k) against k, which scales as C(k) ∼ 1/k (see fig. 3B), consistently with theoretical predictions [14]. Nonlocal Evolution of OS Networks. – A very simple model predicts the network dynamics of software communities, including the shape of the undirected degree distribution
Sergi Valverde and Ricard V. Sol´ e: Evolving Social Weighted Networks: Nonlocal Dynamics of Open Source Com
�
2
200000
r = 0.99
�
3
10
2
150000
b
A(s)
10
100000
1
10
101.8
1.75
50000 0
10 0 0
500 1000 1500 2000 s
�
1
10
� 10
2
10
s
2
knn
P>(k)
100
10
1
10
1 1
10 k
100
0
10
1
2
10 k
10
Fig. 4 – Social network simulation (A) Linear correlation between node strength si and betweeness centrality (or node load) bi in the Python community. The correlation coefficient is 0.99. This trend has been observed in all communities studied here (B) Estimation of α in the TCL project (see text). (C) Cumulative degree distribution in the simulated network (open circles) and in the real community (closed squares). All parameters estimated from real data: N = 215, m0 = 15, hmi = 3 and α = 0.75. Notice the remarkable agreement between simulation and the real social network. (D) Scaling of average neighbors degree vs degree in the simulated network (open circles) and in the real social network (closed squares). Notice the remarkable overlap of simulation and real data for large k. (E) Rendering of the simulated network to be compared with the social network displayed in fig. 1B.
P (k) and local correlations (see fig.4C, fig.4D, and fig.4E). The system starts (as in real OS systems) from a fully-connected network of m0 members. At each time step, a new member joins the community and a new node is added to the social network. The new member reports a small number of m e-mails (describing new software bugs). These new e-mails will be eventually replied by expert community members. Member experience is estimated with node strength si or the total number of messages sent (and received) by the member i (eq. (3)). In addition, any member takes into account all previous communications regarding any particular software bug. This suggests that node strength is determined in a nonlocal manner [15]. Indeed, we observe a linear correlation between strength si and betweeness centrality bi in software communities (see fig. 4A). The probability that individual i replies to the new nember is proportional to the node load bi , α
(bi (t) + c) Π [bi (t)] = P α (bj (t) + c)
(6)
j
where c is a constant (in our experiments, c = 1) and node load bi is recalculated before attaching the new link, that is, before evaluating eq. (6). A similar model was presented in [15], where bi is recalculated only after the addition of the new node and its hmi links. Here, the recalculation of betweenness centralities represents a global process of information diffusion. Once the target node i is selected, we place a new edge linking node i and the new node.
6
EUROPHYSICS LETTERS
The networks generated with the previous model are remarkably similar to real OS networks. For example, fig.4 compares our model with the social network of TCL software community. The target social network has N = 215 members and m = hki ≈ 3. A simple modification to a known algorithm for measuring preferential attachment in evolving networks [16] enables us to estimate the exponent α driving the attachement rate of new links (described in eq. (6)). Due to limitations in available network data we have computed the attachment kernel depending on node strength si instead of node load bi . In order to measure Π [si (t)] we compare two network snapshots of the same software community at times T0 and T1 where T0 < T1 . Nodes in the T0 and T1 network are called ”T0 nodes” and ”T1 nodes”, respectively. When a new i ∈ T1 node joins the network we compute the node strength sj of the j ∈ T0 node to which the new node i links. Then, we estimate the attachment kernel as follows P mij θ(s − sj ) i∈T1 ,j∈T0 P Π [s, T0 , T1 ] = (7) θ(s − sj ) j∈T0
where θ(z) = 1 if z = 0 and θ(z) = 0 otherwise, and mij is the adjacency matrix of the social network. In order to reduce the impact of noise fluctuations, we have estimated the α exponent from the cumulative function A(s) =
Zs
Π(s)ds.
(8)
0
Under the assumption of eq. 6 the above function scales with node strength, A(s) ∼ sα+1 . Figure 4B displays the cumulative function A(s) as measured in the TCL software community with T0 = 2003 and T1 = 2004. In this dataset, the power-law fitting of A(s) predicts an exponent α = 0.75. A similar exponent is observed in other systems (not shown). In addition, we have estimated the αBA exponent with a preferential attachment kernel, Π(k) ∼ k αBA , as in the original algorithm by Jeong et al. [16]. The evolution of the social networks cannot be described by a linear preferential attachment mechanism because the observed exponent is αBA > 1.4 (not shown). Discussion. – The analysis of correlations in open source communities indicates they are closer to the Internet and communication networks than to other social networks (e.g., the network of scientific collaborations ). The social networks analyzed here are dissasortative from the topological point of view and assortative when edge weights are taken into account. A distinguished feature of social networks in software communities is a subset of core members acting like the community backbone. In these communities, the bulk of e-mail traffic is redirected to the strongest members, which are reinforced as the dominant ones. We have presented a model that predicts many global and local social network measurements of software communities. Interestingly, the model suggests that reinforcement is nonlocal, that is, e-mails are not independent of previous e-mails. The conclusions of the present work must be contrasted with the local reinforcement mechanism proposed by Caldarelli et. al. [8]. In their model, any pair of members can increase the strength of their link with independence of the global activity. Several features of software communities preclude the application of their model. For example, fixing a software bug is a global task which requires the coordination of several members in the community. Any e-mail response requires to consider all the previous communications regarding the specific subject under discussion. In addition,
Sergi Valverde and Ricard V. Sol´ e: Evolving Social Weighted Networks: Nonlocal Dynamics of Open Source Com
their model does not consider a sparse network structure and every individual is connected with everybody else, which is not the case of OS communities. We can conceive other alternatives instead of computing betweeness centralities in eq.(6). An interesting approach includes the discrete simulation of e-mails tracing shortest paths in the social network, as in some models of internet routing [17]. Packet transport-driven simulations can provide good estimations of the number of e-mails received by any node. Nevertheless, the present model enables us to explain remarkably well the OS network dynamics. Another extension of the model is the addition of new links between existing nodes, which can provide better fittings to local correlation measures. Finally, the current model is a first step towards a theory of collaboration and self-organization in open source communities. In this context, the techniques and models presented here are useful tools to understand how social collaboration takes place in distributed environments. ∗∗∗ We thank our colleague Vincent Anton for useful discussions. This work has been supported by grants FIS2004-05422, by the EU within the 6th Framework Program under contract 001907 (DELIS) and by the Santa Fe Institute. REFERENCES [1] Dorogovtsev, S. N. and Mendes, J. F. F., Evolution of Networks: From Biological Nets to the Internet and WWW (Oxford Univ. Press, New York) 2003. [2] Valverde, S., Ferrer-Cancho, R. & Sol´ e, R. V., Europhys. Lett. 60 (2002) 512. [3] Valverde, S. and Sol´ e, R. V., Phys. Rev. E 72 026107 (2005). e, R. V., Europhys. Lett. 72 5 (2005) 858–864. [4] Valverde, S., and Sol´ [5] Crowston, K. and Howison, J., First Monday 10 2 (2005). [6] Raymond, E. S., First Monday 3 3 (1998). [7] Garlaschelli, D., and Loffredo, M. I., Phys. Rev. Lett. 93 268701 (2004). [8] Caldarelli, G., Coccetti, F., and de Los Rios, P., Phys. Rev. Lett. 70 027102 (2004). [9] Brandes, U., Journal of Mathematical Sociology 25 2 163–177 (2001). [10] Goh, K.-I., Kahng, B., and Kim, D., Phys. Rev. Lett. 87 278701 (2001). elemy, M., Pastor-Satorras, R., and Vespignani, A., Proc. Natl. [11] Barrat, A., Barth´ Acad. Sci. USA 101 (2004) 3747. ´ si, A.-L., and Albert, R., Science 286 (1999) 509. [12] Baraba [13] Vazquez, A., Pastor-Satorras, R., and Vespignani, A., Phys. Rev. Lett. 65 066130 (2002). [14] Dorogovtsev, S. N., Goltsev, A. V., Mendes, J. F. F., Phys. Rev. E 65 066122 (()2002). [15] Goh, K.-I., Kahng, B., and Kim, D., Phys. Rev. E. 72 017103 (2005). ´ si, A.-L., Europhys. Lett. 61 4 (2003) 567. [16] Jeong, H., N´ eda, Z., and Baraba [17] Sol´ e, R. V., and Valverde, S., Physica A 289 (2001) 595-695.