Event Identification for Social Streams Using. Keyword-Based Evolving Graph Sequences. Elizabeth Kwan, Pei-Ling Hsu, Jheng-He Liang, and Yi-Shin Chen. â.
2013 IEEE/ACM International Conference on Advances in Social Networks Analysis and Mining
1
Event Identification for Social Streams Using Keyword-Based Evolving Graph Sequences Elizabeth Kwan, Pei-Ling Hsu, Jheng-He Liang, and Yi-Shin Chen∗ Institute of Information Systems and Applications Department of Computer Science National Tsing Hua University, Taiwan {elizabethkwanxy, lopihsu, otirafuu, yishin}@gmail.com Fax: +886-3-5731201 Address:101, Section 2 Kuang Fu Road, Hsinchu,Taiwan 300
Abstract—Social networks, which have become extremely popular nowadays, contain a tremendous amount of usergenerated content about real-world events. This usergenerated content can naturally reflect the real-world event as they happen, and sometimes even ahead of the newswire. The goal of this work is to identify events from social streams. A model called “keyword-based evolving graph sequences” (kEGS) is proposed to capture the characteristics of information propagation in social streams. The experimental results show the usefulness of our approach in identifying real-world events in social streams.
I. I NTRODUCTION Social networking has appeared In the recent years as a fast and accessible communication tool. Sites such as Twitter and Facebook have transformed the way we network, and are powerful means of communication. In the past, the direction of communication was one-way from mass media, largely television, radio and the print press, to users. Nowadays, with the support of high-speed Internet and the growth of mobile devices, users not only act as content consumers, but also as content producers. Social network data, which is often referred to as social streams, offer a constant flow of information, ranging from status updates and opinions, to newsworthy events. Information available from social streams can typically reflect real-world events as they happen, sometimes even ahead of the newswire [1]. Take the news of Osama bin Laden’s death as an example. The first person to post about the bin Laden raid was a neighbor who complained about the noise next door on Twitter [2]. Although there is speculation as to where to where the news first appeared, it cannot be denied that social media played a huge role in spreading the news. By the time official news reporting sources, such as CNN or The New York Times, confirmed that US Navy SEALS had killed bin Laden, millions had already taken to their Twitter and Facebook pages to virally spread the information. Social scientists have long recognized the importance of social networks in the spread of information [3], [4]. With the current technology and massive online social network data available, properly mined events in social ASONAM'13, August 25-29, 2013, Niagara, Ontario, CAN Copyright 2013 ACM 978-1-4503-2240-9 /13/08 ...$15.00
450
streams will not only help us identify the events, but also offer great help in facilitating varies studies in the field of social network analysis. However, as the popularity of social networking grows, the amount of information available has swollen to become a roaring deluge. Take Twitter for example; with over 140 million active users as of 2012 [5], Twitter generates over 340 million tweets daily [6], which contains not only useful information, but also a large amount of uninformative messages [7]. This introduces a lot of noise in the system. In recent years, numerous studies have attempted to describe the definition of events [8], [9], [10]. Becker et al. [10] defined an event, specifically for event identification on Twitter, as a real-world occurrence e with (1) an associated time period te and (2) a time-ordered stream of Twitter messages Me , of substantial volume, discussing the occurrence and published during time te . From this definition, we can conclude that there are at least two important dimensions for event identification in social streams: time and message. Further, we extend the dimensions by adding the social structure dimensions which are important in the spread of information. For example, an important piece of information will propagate well in the social streams. This means that one user tends to pass on the information that he/she finds interesting. If one piece of information is interesting beyond a select group of people, it becomes an event. By considering the three dimensions of social streams data for event identification—message, time, and social structure—a sequence of graphs, called “evolving graph sequences” (EGS) have been adapted to represent the information propagation for one message. Since the messages can be represented by keywords and for the purpose of reducing computation complexity, the messages are grouped with the same keyword. Instead of creating one EGS for each message, there is only one EGS for a set of keywords. This model is termed “keyword-based evolving graph sequences (kEGS)”. To extract valuable events out of kEGS, several measurements are introduced to analyze the graphs of kEGS.
2013 IEEE/ACM International Conference on Advances in Social Networks Analysis and Mining
2
These measurements can classify kEGS into three different types of events: one-shot events, long-run events, and non-events. The experimental results of over seven million tweets demonstrate the usefulness of the proposed approach. The remainder of this paper is organized as follows. Section II covers the related work. Section III explains the methodology used in this work. Section IV presents the major experimental results. Finally, Section V concludes this paper.
III. M ETHODOLOGY Although Twitter supports multi-language environments for different users around the world, the proposed methodology is limited to English for the simplicity. Hence, the first process is to remove non-English tweets using Alchemy API1 . Any tweets not containing alphabet characters were also removed.
II. R ELATED W ORK As social network sites, especially Twitter, have become extremely popular nowadays, there is great enthusiasm in the study of social networks that try to utilize the vast amount of data available. Numerous studies have demonstrated that careful mining of tweets can be used to identify real-world events. For example, Sakaki et al. [11] utilized Twitter as social sensor to identify earthquakes and develop an earthquake reporting system. Popescu and Pennacchiotti [12] proposed a method for detecting a specific type of engaging event by using Twitter data. Jianshu Wen et al. [13] used a signals processing algorithm to detect events via Twitter. The events were detected by clustering keyword correlation signals by modularity-based graph partitioning. The social relationships were not utilized in this study. Some studies have tried to utilize the social structure available in social streams data. Becker et al. [10] explored approaches for analyzing Twitter streams to identify real-world events and non-events. They identified each event and its associated Twitter messages using an online clustering technique that groups together topically similar tweets. Afterwards, features of Twitter messages, such as social interaction, etc., are computed and utilized for the clustering to discover characteristics that may help detect clusters that are associated with events. Finally, the features used in the study, which covers temporal features, social features, topical features, and Twittercentric features, are described for different aspects of the clusters. Although this study can automatically identify the general events from the social streams, the social network structures are not considered in its social features. Social structures contain a great deal of valuable information for analysis [14]. However, since the social structures are huge and complex, efficient analysis is always the major challenge for these works. Chenhui Ren et al. [15] provided an effective solution termed “evolving graph sequences” (EGS) for evaluating queries from social network evolution analysis studies (e.g., Kumar et al. [16]). In contrast to previous studies, we consider three dimensions of social streams data for event identification: message, time and social structure. “Keyword-based evolving graph sequences” (kEGS) is a novel model proposed to facilitate the goal by utilizing the similar concept of EGS to speed up performance.
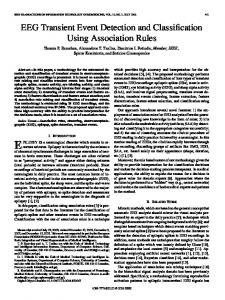
Fig. 1: General Framework
451
The general framework is illustrated in Figure 1. Given a set of pre-processed Twitter data T w = {T w1 , ..., T wn }, where each T wi is a tweet posted between time t0 and ti (UTC time), the objective of this paper is to identify events E which happened between t0 and ti . The idea is to construct kEGS for every keyword in the data set. As reflected by its name, kEGS is a sequence of graphs for each keyword. It is computationally expensive to construct kEGS for every keyword in the data set. To solve the computation problem, several filtering processes are applied to select candidate keywords which have a high possibility of representing an event in Section III-A. A. Select Candidate Keywords Keywords are the best representations to summarize a tweet. For example, the message “It’s earthquake!” is best represented by the keyword “earthquake” as the main idea. Therefore, the keyword extraction algorithm is adapted for each tweet to retrieve a set of keywords Ki that best represent tweet T wi . Definition 1. (Keywords) Let K denote the keyword set extracted from tweets, where Ki = {ki1 , ..., kij } is a set of keywords that best represent the tweet T wi . The best represent keywords should satisfy two criteria: meaningfulness and well-noticed. 1) Select Meaningful Keywords: To best represent an event, the keywords should satisfy the first criterion meaningfulness. To achieve this goal, all profanity words (termed “bad words”) which only show emotion but do not give further information about events should be removed first. Next, the meaningless words, which can be checked using the M-Function, should be removed as well. 1) Bad Words Filtering. From analysis of the extracted keywords, abrasive language appears frequently in the data set. This might be useful for sentiment analysis, but is useless in representing events. Let ki represent any keywords in K. Next, Dictionary β, which contains a list of bad words2 , 1 http://www.alchemyapi.com/ 2 The list of bad words can be obtained from online at: http://urbanoalvarez.es/blog/2008/04/04/bad-words-list/
2013 IEEE/ACM International Conference on Advances in Social Networks Analysis and Mining is defined. Any keywords listed in the dictionary will be removed from the keywords list. This observation is captured by the following lemma: Lemma 1. If ki ∈ β, remove ki from K. 2) M-Function Filtering The M-Function is adapted from Porter Stemmer [17]. For a better understanding, the intuition behind the use of this function is given after a brief explanation on how this function works. An English word consists of vowels and consonant. A consonant in a word is a letter other than A, E, I, O, or U, and other than Y, and preceded by a consonant. A consonant will be denoted by c, and a vowel by v. Consecutive consonants with a length greater than 0 are denoted by C. Consecutive vowels with a length greater than 0 are denoted by V . Any English word has one of the four forms: CV CV . . . C CV CV . . . V V CV C . . . C V CV C . . . V Those four forms may all be represented by: [C]V CV C . . . [V ] Further, this may be written as: [C](V C)m [V ] m value can be calculated for each keyword ki . For example, the m value for the word “RT” is 0, while for the word “Japan”, it is 2. The intuition behind this is that keywords with m < 1 tend to have no meaning. This leads to Lemma 2: Lemma 2. If m(ki ) < 1, remove ki from K 2) Select Well-Noticed Keywords: The keyword can be considered as “well-noticed” by showing some characteristics in the frequency distribution. First, if there is a sudden increasing trend in the keyword, this means the keyword is receiving attentions. Second, the keyword frequency should be high enough, but not be too flat to be spam. Last, since the attention surrounding specific events ebbs and flows before decaying after a certain time period, a well-noticed even should follow the same pattern, i.e., having a peak in its frequency domain. To address this criterion, three-step statistical filtering is designed and utilized in this stage. 1) Filter Out Low Frequency Keywords. Some keywords only appear once and never appear again, and these types of keywords are not related to any real-world event. Therefore, the objective of this filtering process is to remove keywords with a low frequency. Definition 2. (Frequency) Given a set of keywords, K, where ki ∈ K and frequency fi is the average occurrence number of keyword ki within t0 and ti time period. Definition 3. (α−Low) A keyword ki is said to be pass the α − Low cut if and only if fi > α − Low.
452
3
This will leads to Lemma 3: Lemma 3. If fi l − Low, remove ki from K. 2) Filter Out High Frequency Keywords. Most, if not all, keywords that appear regularly (every day) and gain high frequency are ads and spams. To address this observation, the keywords that appear regularly with high frequency should be removed. Definition 4. (α − High) A keyword ki is said to pass the α−High cut if and only if fi < α−High. This will lead to Lemma 4: Lemma 4. If fi l − High, remove ki from K. 3) Peak Significance. From the observation, event keywords tend to dramatically increase in terms of frequency. In other words, the difference between its peak and the average frequency should be slightly bigger compared to ordinary keywords. Definition 5. (Peak Frequency) Let pi denote the peak frequency of keyword ki and f dij denote the daily frequency of keyword ki on day j. Formally, n pi = M AX [dfij ]j=1 . Definition 6. (Peak Difference) Let δ represent the predefined threshold for minimum difference between peak frequency and average frequency, allowing for all of the keywords ki in K. The discussion above is captured by this following lemma: Lemma 5. If (pi − fi ) < δ, remove ki from K. The final candidate keywords are finally selected for monitoring. The next step is to construct the kEGS for every candidate keywords. It is important to note that all of the thresholds used in this work are chosen based on a statistical analysis of training data. B. Keyword-based Evolving Graph Sequence In this section, kEGS is first introduced and described for event identification. Next, the measurements used to determine whether the keyword is an event are described. Figure 2 shows how the Keyword-based Evolving Graph Sequences (kEGS) appear.
Fig. 2: Illustration of Keyword-based Evolving Graph Sequences (kEGS)
2013 IEEE/ACM International Conference on Advances in Social Networks Analysis and Mining 1) kEGS Definitions: A graph is an abstract representation of a set of objects wherein some pairs of the objects are connected by links. The interconnected objects are represented by mathematical abstractions called “vertices”, and the links that connect some pairs of vertices are called “edges” [18]. The edges may be directed (asymmetric) or undirected (symmetric). Due to the nature of the Twitter following relationship, which is directed and asymmetric, the directed graph for kEGS is adapted in this paper. Definition 7. (Keyword-based Evolving Graph Sequences) kEGS is a sequence of directed graphs that demonstrate the information (keywords) propagation within social streams, where kEGSi denotes the keyword-based evolving graph sequence for keyword ki and ki ∈ K. Given a keyword-based evolving graph sequence kEGS = G1 , . . . , Gn , where each graph Gi is a social relation graph dedicated to a specified time period τ , larger τ results in fewer graphs in kEGS, which has faster computation but might loss the details. Smaller τ means more details, but requires a bigger computation effort. In this work, τ = 1, since the events should be monitored daily for better accuracy. Thus, the term “day” is used to refer to the graph number, such as graph day-1 for G1 , and graph day-2 for G2 . Further, given a graph G, V (G) and E(G) denote the set of vertices and the set of edges within graph G, respectively. Definition 8. (Vertex) A vertex v represents a user that mentioned keyword k. Definition 9. (Edge) An edge e within the graph represents the following relationship between users that mentioned keyword k. It is important to know that the graph is added incrementally. This means that the vertices and edges inserted one day will be copied to the graph of the next day. The incrementally adding graph can model the information cascade, since the event leaves an impact not only for today but also tomorrow and even the days after that. The kEGS model can model the information cascade, but cannot represent the situation for information decays. Therefore, to model it, the weight concept is further used to consider that information decays over time. For instance, the information mentioned in the previous week may not be relevant to the information of today. Hence, there is no point in keeping irrelevant information in the model. Thus, the irrelevant vertices or edges should be removed. The weights for each vertices and edges, which represent how important the information in kEGS is, are assigned accordingly. Definition 10. (Weight) Let ωv represent weight for vertex v and ωe represent weight for edge e.
453
4
For each new vertex added to the graph, its weight is set to the maximum value, i.e., ωv = 1. For each new edge added to the graph, its weight is also set to the maximum value, i.e., ωe = 1. The value will be decreased � (for simplification purposes, the value 0.5 is used in this study) of its current value for every new day. If the vertex or the edge has a new entry, the weight will be increased to the maximum value. The vertex and the edge will be removed from the graph once its weight is below a pre-defined cut-off threshold. The cut-off threshold is defined as: Definition 11. (Decay Threshold) Let λ represent the predefined decay threshold for all ωv and ωe. The discussion above leads to the following two lemmas: Lemma 6. If ωv < λ, remove vertex v from graph G. Lemma 7. If ωe < λ, remove edge e from graph G. The following relationship is the direct relationship, which means that one user is directly following the other user. However, such kEGS only preserve the direct social structures, and ignore the majority of social information, i.e., the indirect social structures. Indirect social structures contain valuable information as well, especially if the system can only access sampled data. Twitter data are usually incomplete, and can only be accessed through random fashions. If only direct relationships are utilized, most of the users are not following each other. To address the issue, the hidden links are introduced, which represent the hidden relationship between users. Definition 12. (Hidden Link) Let e�1 represent a link between two unconnected vertices (users), which is connected through their direct connected users (see illustration below). The hidden link can be expanded by including an x-level indirect connection. For example, e�2 represents a link between two unconnected vertices (users) which is connected through their indirect link e�1 . e�1 is called the first-level indirect connection and e�2 can be called the second-level indirect connection. To simplify the study, this paper henceforth considers only first level indirect connections. The hidden link will not only introduce more edges to the graph but also shows that even though these two users are not connected to each other, they belong to the same community through another direct connected user. 2) Analysis of kEGS: After constructing kEGS, the trends of information have been preserved in the corresponding graphs. Hence, the kEGS can be directly analyzed for event identification by utilizing the following measurements: 1) Number of vertices (nV ) The number of vertices for each graph in kEGS is calculated. This will represent the numbers of unique users that
2013 IEEE/ACM International Conference on Advances in Social Networks Analysis and Mining mentioned about the corresponding keyword on that day. Further use of this measurement can eliminate ads or spams left in the remaining data set. Formally, nV = {nv1 , . . . , nvn } , where nvi represents the number of vertices in graph Gi on day i. 2) Number of edges (nE) The number of edges for each graph in kEGS is calculated to represent the number of unique relationships between users who mentioned the corresponding keyword on that day. Formally, nE = {ne1 , . . . , nen } , where nei represents number of edges in graph Gi on day i. 3) Number of isolated subset graphs (S) For this measurement, the number of isolated subset graphs for each graph in kEGS is calculated. This number represents how many communities or groups of people talked about the corresponding keyword. Formally, S = {s1 , . . . , sn } , where si represents the number of isolated subset graphs in graph Gi on day i. 4) Reciprocity (R) The last measurement, reciprocity, attempts to indicate the degree of mutuality in the network. Specifically, the purpose of this measurement is to detect the interaction between users, not necessarily direct interaction, and to perceive how the users engage in the topic. Definition 13. (Reciprocity) Reciprocity is the ratio of the number of relations which are reciprocated (i.e. there is an edge in both directions) over the total number of relations in the graph. Two vertices are said to be related if there is at least one edge between them. Reciprocity is a useful indicator of the degree of mutuality and reciprocal exchange in a network, which relates to social cohesion. Higher reciprocity means greater interaction between users.
•
5
A significant increase in the number of unique users that mention the event: In order to measure this, nV is utilized and compare one day to its previous days. A significant increase is measured by predefining threshold τ nV which represent the difference required for an event to be categorized as a type-1 event. A larger threshold value will result in fewer events detected as type-1 events is stricter. Consider the following condition: Type-1 Condition 1. nVi > (nVi − 1 ∗ τ nV ) If type-1 condition 1 holds, there is a sudden increase in terms of the number of unique users. To check whether this number does not happen regularly, the average number of unique users should be checked, formally: nVi =
�i−1
nVj i−1
j=1
Next, the threshold τ nV , which represent the difference in the increase needed from previous days, is defined. The larger threshold value will result in fewer events detected as type-1 events as the condition is stricter. This leads to the second type-1 condition: Type-1 Condition 2. nVi > (nVi ∗ τ nV )
•
Further, to check whether these unique users are actually connected to each other, the threshold τ e is defined to indicate the number of relationships desired in the graph. This leads to the third condition: Type-1 Condition 3. nEi > τ e Attracting the general public, rather than a specific group of people. In order to measure this, S which represent the number of groups of people described in the methodology section, is employed. This calculates how many groups of people (community) mention the event to make sure that this event is important to people in general, and is not limited to one community.
C. Event Identification Finally, the measurements explained in previous sections are employed to identify events on kEGS. Three types of events are identified: 1) Type-1 Event: One-shot event A type-1 event is an event that receives popularity in a short time. Usually, this type of event comes suddenly without any warning or notification, such as the Japan tsunami in 2011 or a celebrity’s sudden death. The characteristics of type-1 event are:
454
For example, a big sale happens in a local area. While this event might be interesting for people in that local area, it will not impact upon the general public. In order to do so, the threshold τ s which represent the minimum number of isolated subset graphs allowed is defined. Type-1 Condition 4. si > τ s An event is categorized as type-1 if and only if that event has at least one day for which all four conditions is true.
2013 IEEE/ACM International Conference on Advances in Social Networks Analysis and Mining 2) Type-2 Event: Long-run event This type of event is considered long-run event because it requires time to propagate within social networks. A Type-2 event does not increase significantly, but attracts a lot of discussion from users. It might belong to some group of people in the beginning. Some people from the same group engage about this event and then attract other users. This kind of event has the potential to become an important issue. In order to identify a type-2 event, the reciprocity described in the methodology section as the measurement is employed. Formally, R = {r1 , . . . , rn } where ri represents the reciprocity value for graph Gi on day i. Instead of using a predefined threshold to measure how much reciprocity is required for an event to be categorized as a type-2 event, an increase in the reciprocity of one day in comparison with its previous day is compared to detect a significant increase. Type-2 Condition 1. ri > r( i − 1) ∗ τ r, where τ r represent the ratio required. An event is categorized as type-2 event if and only if that event has at least one day wherein the condition above is fulfilled. 3) Non Event The last event is a Non-Event. An even is categorized as a Non-Event if that event does not fall into the type-1 event or type-2 event categories. IV. E XPERIMENTS A. Experimental Setup Twitter feeds are employed as the main experimental data source. Seven million tweets posted between January and December 2011 are crawled. In addition, 13,000 users who posted the tweets and the corresponding five million following relationships are collected. The data set is divided in two: testing data and training data. The training data are employed to adjust the thresholds needed in the system and apply those thresholds for testing data. First, the experiments are conducted to see how the system identifies predefined events. Then, the experiments are extended for automatic event identification.
6
to the event and one is a random keyword. The system successfully identifies both events and non-events by returning a type-1 event on day-5 for the keyword “steve jobs”. Figure 3 shows the difference between a type-1 event and non-event, specifically for measurement nV .
Fig. 3: Analysis of the Number of Unique Users (nV ) for Steve Jobs’ Death Event
To further verify the type-1 event, the second experiment is conducted on the “Japan Tsunami 2011”. The event occurred on 11 March 2011; therefore, 31day (one-month) data are selected from 1 March 2011 to 31 March 2011. The keywords “japan”, “tsunami”, “earthquake”, and “nuclear” were used for the massive natural disaster. The system detected that on day-11, there were three type-1 events (“japan”, “tsunami”, and “earthquake”) and one type-2 event (“nuclear”) which return with 100% accuracy. The keyword “nuclear” is categorized as the type-2 event because on day-1 of the event (day-11 of the month), users were more concerned about the tsunami and earthquake than the Fukushima Daiichi nuclear disaster. Thus, the keyword “nuclear” does not pass the conditions for type-1, specifically type1 condition 1.
B. Experimental Results 1) Experiments on Predefined Events: To begin with, the experiments are conducted for a predefined event. The first predefined event is “Steve Jobs’ Death”. Steve Jobs died on 5 October 2011; hence, 31-days (one month) of data are selected from 1 October 2011 to 31 October 2011, which covers up to 500,000 tweets. In order to test whether the system correctly identifies the events or not, two types of keywords are defined: one is related
455
Fig. 4: Analysis of the Number of Unique Users (nV ) for the Japan Tsunami Event
As shown in From Figure 4, the number of unique users of the keyword “nuclear” gradually rather than suddenly increased in comparison with the other keywords. However, the nuclear issue did show a significant change in terms of interaction.
2013 IEEE/ACM International Conference on Advances in Social Networks Analysis and Mining
Fig. 5: Analysis of the Degree of Reciprocity (R) for the Japan Tsunami Event
7
Fig. 7: Analysis of the Degree of Reciprocity (R) for the Occupy Wall Street Event
Figure 5 shows that there is a significant increase in terms of degree of reciprocity, which is characteristic of a type-2 event. Next, the experiments are extended specifically for a type-2 event. The “Occupy Wall Street” event is chosen as the predefined event. The keywords “wall Street” and “new york” are selected as they are related to the “Occupy Wall Street” event, along with the random keyword “happy”. Judging from the number of vertices, the keyword “happy” outnumbered the event keywords (see Figure 6). Fig. 8: Compare Keywords “new york” and “london”
2) Experiments on Automatic Event Identification: Finally, the performance of the system is measured to identify the event automatically, without a predefined event. For this experiment, the performance of utilizing hiddenrelationships described in Section III-B1 is compared with those which only employed direct relationships.
Fig. 6: Analysis of the Number of Unique Users (nV ) for the Occupy Wall Street Event
However, from the degree of reciprocity, the keywords “wall street” and “new york” show an unusual trend (see Figure 7). The system successfully identifies both events and non-events. Note that even though keyword “happy” outnumbered the other keywords, “happy” is categorized as a non-event because there is no significant increase. The hypothesis on a type-2 event is verified by comparing two keywords on “Occupy Wall Street”. The keyword “new york”, which is related to the event, and the keyword “london”, which is a famous city and selected as the comparison baseline, are compared in Figure 8. Moreover, there was no big event in London around that time. The data set did not capture any interaction for the keyword “london”, but reveals that reciprocity is good for identifying a type-2 event.
456
Fig. 9: Precision Rate
Precision rate measures how many correct events are identified by the system, which are shown in Figure 9. The system returns 100% in precision for type-1 events with a direct relationship, and 56% for hidden relationships. From the observation, as hidden relationships introduce more edges to the system, they also introduce more false positive type-1 events. There are a lot of keywords with a sudden increase in the number of unique users and satisfy all four conditions of a type-
2013 IEEE/ACM International Conference on Advances in Social Networks Analysis and Mining 1 event, but these keywords are not actually related to any event, for example trending topic about random topic (e.g. Throwback Thursday, etc.). The system also returns a high precision rate for identifying non-events with precision of up to 97%. However, the system returns a low precision rate for type-2 events. The reason is because the system identifies a lot of false positive type-2 events.
Fig. 10: Recall Rate
The experiments demonstrate a good result for kEGS with hidden relationships with recall rate as low as 80% in Figure 10. Moreover, the system performs exceptionally well for type-2 events, with a recall rate up to 100%. Thus, although the precision rate is not as high as the recall rate, this implies that the system did not lose most of the important events. V. C ONCLUSIONS In this work, we have introduced and evaluated Keyword-based Evolving Graph Sequences for event identification purposes, and demonstrated how social structure in social streams data can be utilized for event identification. Furthermore, we proposed the use of a hidden link (hidden relationship) for event identification, which can improve the recall rate to a maximum of 100% and a minimum of 80%. Currently, this work is limited to English tweets. Hence, future studies are required in multi-lingual event identification. Moreover, in the current work keywords are used to represent an event. Thus, it is not possible that several keywords actually refer to one event. For example the keywords “japan”, “tsunami”, “earthquake”, and “nuclear” actually refer to the same event. How these keywords can be grouped presents another challenge for future studies. As the social network becomes more and more significant to our daily lives, it also brings a great chance to utilize and implement kEGS to solve other social network-related problems, such as sentiment analysis and real-time event identification. ACKONOWLEDGMENT This work is supported by the National Science Council, Taiwan, under grant 101-2221-E-007-126, grant 100-
457
8
2221-E-007-109, grant 99-2221-E-007-092, and grant 98-2221-E-007-096.
R EFERENCES [1] H. Kwak, C. Lee, H. Park, and S. Moon, “What is Twitter, a social network or a news media?” in Proceedings of WWW, 2010, pp. 591–600. [2] M. Bell, “Sohaib athar’s tweets from the attack on osama bin laden,” http://www.washingtonpost.com/blogs/blogpost/post/ sohaib-athar-tweeted-the-attack-on-osama-bin-laden--without-knowing-it/ 2011/05/02/AF4c9xXF blog.html, 2 May 2011. [3] M. Granovetter, “The Strength of Weak Ties,” The American Journal of Sociology, vol. 78, pp. 1360–1380, 1973. [4] E. Bakshy, I. Rosenn, C. Marlow, and L. A. Adamic, “The role of social networks in information diffusion,” in Proceedings of WWW, 2012, pp. 519–528. [5] Twitter, “Twitter turns six,” http://blog.twitter.com/2012/03/ twitter-turns-six.html, 21 March 2012. [6] T. Wasserman, “Twitter says it has 140 million users,” http://mashable.com/2012/03/21/twitter-has-140-million-users/, 21 March 2012. [7] M. Naaman, J. Boase, and C.-H. Lai, “Is it really about me? message content in social awareness streams,” in Proceedings of CSCW, 2010. [8] J. Allan, Ed., Topic Detection and Tracking: Event-based Information Organization. Kluwer Academic Publishers, 2002. [9] J. M. Zacks and B. Tversky, “Event structure in perception and conception,” Psychological Bulletin, vol. 127, 2001. [10] H. Becker, M. Naaman, and L. Gravano, “Beyond trending topics: Real-world event identification on twitter,” in Proceedings of ICWSM, 2011. [11] T. Sakaki, M. Okazaki, and Y. Matsuo, “Earthquake shakes twitter users: real-time event detection by social sensors,” in Proceedings of WWW, 2010, pp. 851–860. [12] A.-M. Popescu and M. Pennacchiotti, “Detecting controversial events from twitter,” in Proceedings of CIKM, 2010, pp. 1873– 1876. [13] J. Weng and B.-S. Lee, “Event detection in twitter,” in Proceedings of ICWSM, 2011. [14] S. Wasserman and K. Faust, Social Network Analysis: Methods and Applications, ser. Structural analysis in the social sciences. Cambridge University Press, 1994. [15] C. Ren, E. Lo, B. Kao, X. Zhu, and R. Cheng, “On querying historical evolving graph sequences,” PVLDB, pp. 726–737, 2011. [16] R. Kumar, J. Novak, and A. Tomkins, “Structure and evolution of online social networks,” in Proceedings of KDD, 2006, pp. 611–617. [17] M. F. Porter, “An algorithm for suffix stripping,” Program, vol. 14, pp. 130–137, 1980. [18] R. J. Trudeau, Introduction to Graph Theory. Dover Publishers, 1993.