WP/08/76
Does Money Matter for U.S. Inflation? Evidence from Bayesian VARs Helge Berger and Pär Österholm
© 2008 International Monetary Fund
WP/08/76
IMF Working Paper Western Hemisphere Department Does Money Matter for U.S. Inflation? Evidence from Bayesian VARs∗ Prepared by Helge Berger and Pär Österholm Authorized for distribution by Robert Rennhack March 2008 Abstract This Working Paper should not be reported as representing the views of the IMF. The views expressed in this Working Paper are those of the author(s) and do not necessarily represent those of the IMF or IMF policy. Working Papers describe research in progress by the author(s) and are published to elicit comments and to further debate.
We use Bayesian estimation techniques to investigate whether money growth Granger-causes inflation in the United States. We test for Granger-causality out-of-sample and find, perhaps surprisingly given recent theoretical arguments, that including money growth in simple VAR models of inflation does systematically improve out-of-sample forecasting accuracy. This holds for a long forecasting sample 1960-2005, as well for more recent subperiods, including the Volcker and Greenspan eras. However, the contribution of money to inflation forecasting accuracy is quantitatively limited and tends to be smaller in recent subperiods, in particular in models that also include information on real GDP growth and interest rates. JEL Classification Numbers: E47, E52, E58 Keywords: Out-of-Sample Forecasting, Granger Causality, Monetary Aggregates, Monetary Policy, Volcker, Greenspan Authors’ E-Mail Addresses:
[email protected];
[email protected] ∗
Both authors thank the IMF for its hospitality. Österholm gratefully acknowledges financial support from Jan Wallander’s and Tom Hedelius’ Foundation.
2
Contents I. Introduction ........................................................................................................................... 3 II. Other Related Literature....................................................................................................... 4 III. Methodology and Data........................................................................................................ 5 IV. Money and Inflation Since 1960......................................................................................... 7 V. The Declining Role of Money During the Volcker and Greenspan Period ......................... 9 VI. Horserace .......................................................................................................................... 11 VII. Conclusion....................................................................................................................... 12 Appendix................................................................................................................................. 14 References............................................................................................................................... 15 Figures 1. Data ..................................................................................................................................... 7 2. Reduction in RMSE from adding money growth at different forecasting horizons, 19602005..................................................................................................................................... 8 3. Reduction in RMSE from adding money growth at different forecasting horizons, 1987/89/93-2005 ............................................................................................................... 10 4. RMSE levels at different forecasting horizons, 1970/87/89/93-2005 .............................. 12 A1. Impulse response functions from bivariate BVAR models including money growth and inflation, 1960-1979 and 1980-2005................................................................................. 14
3 I. INTRODUCTION The debate on the role of money for inflation has gathered some steam recently. Woodford (2007a) and Galí et al. (2004), among others, argue that central banks should focus on interest rates rather than money when setting monetary policy. However, McCallum (2001) points out that the absence of monetary aggregates in a theoretical framework does not necessarily constitute a “non-monetary model.” Empirically, Nelson (2003) and Gerlach (2004) stress that money adds to the explanation of inflation dynamics, which should make it an important element of modern monetary policy no matter its theoretical merits. The discussion has some importance for monetary policy. In Europe, the European Central Bank (2003) continues to stress the importance of monetary analysis in its policy framework and the Bank of England’s Mervyn King (2005, p. 18) continues to stress that “[m]oney remains at the heart of the transmission mechanism” of monetary policy, even though many central banks have decided to use interest rates as instruments. In the U.S., however, the Fed recently discontinued collecting data on certain monetary aggregates, suggesting a relative smaller emphasis on money. At the heart of the idea of a cashless economy are current New Keynesian dynamic general equilibrium models. These models treat money mostly as a unit of account (Woodford, 2003; Galí and Gertler, 2007). Under fully separable preferences, real money demand follows standard assumptions, but money affects neither output nor inflation. The dominant channel of monetary policy transmission is the interest rate, which influences and consumption and investment decisions. To achieve control of the interest rate, central banks supply money elastically at the set rate. There is, as Woodford (2007a) states “no compelling reason to assign a prominent role to monetary aggregates in the conduct of monetary policy” in this class of models. However, a number of authors has argued that, when it comes to money, the New Keynesian models may be based on a too specific set of assumptions. Among others, Nelson (2002), Ireland (2004), and Andrés et al. (2006) point out that allowing for non-separability of money in household utility introduces a causal link from money to output and inflation.1 In addition, Andrés et al. (2007) show that money may be a leading indicator of future economic developments in the presence of adjustment costs for real balances making money demand forward-looking. Last not least, Christiano and Rostagno (2001) and Goodfriend and McCallum (2007) extend the standard model by explicitly considering a banking sector, which also tends to elevate the role of money in the monetary policy process. There is also little agreement on the relevance of money for monetary policy on the empirical side. As for structural evidence, Jones and Stracca (2006) find that non-separability cannot be rejected in a non-parametric approach for the euro area 1991-2005, even though there is 1
The effect is commonly thought to be small, however, under plausible preference specifications (McCallum, 2001). See also Woodford’s (2003) discussion of the cashless limiting economy.
4 evidence pointing in that direction for various subperiods. Kremer et al. (2003) support nonseparability of German money and consumption, but Ireland (2004) rejects the assumption for the United States, and so do Andrés et al. (2006) for the euro area. Then again, Andrés et al. (2007) find evidence in favor of a forward-looking money demand in the United States as well as the euro area and the United Kingdom. Turning to non-structural approaches, there is evidence that appropriately filtered longer-run movements in money growth influence inflation, but this literature has been criticized for its reliance on smoothing the data over very long periods (OECD 2007).2 In addition, Nelson (2002), Ireland (2004), and Woodford (2007b) argue that, from a theoretical point of view, the long-run correlations reported are not at odds with the implications of the standard New Keynesian model. Moreover, de Grauwe and Polan (2005) have recently pointed to a possible lack of robustness of the long-run money-inflation link during low inflation episodes. In light of this discussion, the most intriguing way forward may well be to focus on the shortrun dynamics between money on inflation. A particular straightforward concept in this regard is Granger causality—that is, the question whether money improves out-of-sample forecasts of inflation. Granger causality has been dubbed the “sound and natural approach” to causality testing in a multivariate environment (Ashley et al. 1980, p. 1149). What is more, the potential ability of money to aid central bank’s ability to forecast inflation at short-term horizons is certainly highly relevant from an applied policy perspective. In this paper, we use Bayesian autoregressive and vector-autoregressive—BAR and BVAR—models to answer the question whether money Granger-causes inflation in the United States. We find, perhaps surprisingly, that including money growth in simple VAR models of inflation does systematically improve out-of-sample forecasting accuracy. This holds for a long forecasting sample 1960-2005, as well for more recent subperiods, including the Volcker and Greenspan eras. However, the contribution of money to inflation forecasting accuracy is quantitatively limited and tends to be smaller in more recent subperiods, in particular in models that also include information on real GDP growth and interest rates. The rest of the paper is organized as follows. Section 2 briefly reviews the relevant empirical literature. Section 3 discusses the empirical methodology and data. Sections 4 to 6 present our empirical results. Section 7 concludes. II. OTHER RELATED LITERATURE The are a number of papers focusing on the relevance of monetary aggregates in simulated out-of-sample inflation forecasts, with mixed results. For the U.S., Bachmeier and Swanson 2
See, among others, Lucas (1980), Backhus and Kehoe (1992), Benati (2005), Gerlach (2003), Jaeger (2003), Neumann (2003), Christiano and Fitzgerald (2003), Assenmacher-Wesche and Gerlach (2006, 2007).
5 (2005) report that including money marginally improves inflation forecasts compared to simple AR models at certain for horizons exceeding one year; and Bachmeier et al. (2007) find marginal improvements from using money in inflation forecasts in a fully nonparametrical framework. A recent note by Hale and Jordà (2007), on other hand, stresses that money has no predictive power for U.S. inflation at any horizon. Finally, D’Agostino and Surico (2007), suggest that global liqudity has substantial predictive power for U.S. inflation. As for the euro area, Nicoletti-Altimari (2001) and Hofmann (2006) report some contribution of money inflation forecasting accuracy at horizons shorter than two years in a number of different models.3 Following Hofmann (2006), Scharnagl and Schumacher (2007) find a combination of monetary models or indicators produces particularly good inflation forecast.4 In addition, Assenmacher-Wesche and Gerlach (2006) find some evidence of within-sample Granger-causality between money and inflation in the euro area, in particular at frequencies lower than 5 years. A relevant discussion in this context is how to estimate the autoregressive (AR) and vectorautoregressive (VAR) models dominating the recent empirical literature. Adolfson et al. (2007) argue that conventional VAR approaches, while providing for a good description of the data generating process, suffer from over-parameterization and that the large number of parameters to be estimated tends to deteriorate forecasting performance. A way out are Bayesian AR and VAR models, which use priors to shrink parameters (Doan et al., 1984; Litterman, 1986). We will use BARs and BVARs as forecasting tool in this paper. III. METHODOLOGY AND DATA For money to be Granger-causal for inflation we require that the forecasting performance of a BVAR model including money exceeds that of an otherwise identical BVAR or BAR model excluding money. The criterion for forecasting performance is the root mean squared error (RMSE) of the forecast.5
3
The samples considered are: Nicoletti-Altimari (2001): 1980-2000, with forecasts evaluated over 1992-2000; Hofmann (2006): 1980 (1985 for some)-2005, with the forecasting period restricted to 1999-2005; Bachmeier and Swanson (2005): 1979-1992 and 1993-2003, without an explicit restriction of the testing period; Hale and Jordà (2007): euro area 1977-2006, U.S. 1984-2007, also without a discussed restriction; D’Agostino and Surico (2007): 1980-2006, with forecasts evaluated over 1990 -2006.
4
The interpretation of these findings is complicated somewhat by the combination of a large number of overlapping approaches, including, for instance, various monetary aggregates, the so-called p-star model, trend variables, and low-frequency indicators.
5
The Diebold and Mariano (1995) test is often used to test whether the difference in forecasting performance between two models is statistically significant. However, this test is not valid in our setting with recursively generated forecasts from nested models and a forecast horizon that is larger than one (Clark and McCracken, 2001). In fact, as pointed out by Clark and McCracken (2005), no formal test presently exists for this setting. There is also the argument that in forecasting significance tests are of little value in addition to the RMSE criterion (Armstrong, 2007).
6 Establishing Granger-causality out-of-sample based on forecasting performance has a number of advantages.6 Out-of-sample tests are close to Granger’s original idea of causality testing (Ashley et al., 1980), and within-sample tests can be difficult to implement in a multivariate framework. The ability of money to improve actual inflation forecasting is also of interest to policy makers. Lastly, out-of-sample forecasting performance presents a higher hurdle for usually well-parameterized VAR models than within-sample exercises. Our forecasting model is given by G (L )x t = δ + η t ,
(1)
where G (L ) = I − G 1 L − K − G p L p is a lag polynomial of order p, x t is an nx1 vector of stationary macroeconomic variables and ηt is an nx1 vector of iid error terms fulfilling E (ηt ) = 0 and E (η t η′t ) = Σ . In the fourvariate BVAR model, we would have ′ x t = (Δpt Δmt Δyt it ) , with Δpt , Δmt , Δyt , and it representing inflation, money growth, real GDP growth, and interest rates, respectively. In the trivariate, bivariate, and univariate models, we have x = (Δp Δy i )′ , x = (Δp Δm )′ , and x = (Δp )′ , respectively. In all t
t
t
t
t
t
t
t
t
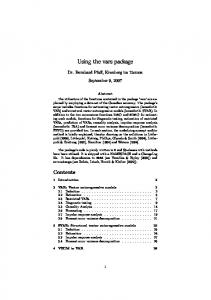
models, the lag length is set to p = 4 . The priors on the dynamics in model (1) are given by a Minnesota-style prior: For variables in levels (first differences), the prior mean on the coefficient on the first own lag is one (zero); all other coefficients in G i have a prior mean of zero. The prior for the covariance matrix is a mainstream diffuse prior. Our quarterly data ranges from 1960Q1 to 2005Q3 and were provided by the Board of Governors of the Federal Reserve System. With the exception of the interest rate, all series are seasonally adjusted. Inflation is based on the consumer price index and the monetary aggregate is M2. The interest rate is the three-month treasury bill rate. 7 All empirical models are estimated using growth rates computed as logarithmic first-differences (that is, quarter-on-quarter growth rates) of the original series in levels, and all variables are measured in percent. For ease of interpretation, however, we will present RMSEs converted into changes over the same quarter last year (that is, annual growth rates) in percent. Figure 1 presents the raw data in the form of annual growth rates.
6
Within-sample, Granger causality can be inferred from the significance of coefficients or impulse response functions (Lütkepohl, 1989; Hamilton, 1994).
7
The fact that our simulated (or “pseudo”) out-of-sample exercise is based on revised instead of real time data should have no bearing on the results. Indeed, in a recent paper, Faust and Wright (2007) argue that the use of real time or revised data does not influence the relative performance of various model- and expert-based forecasts for inflation and output.
7 Figure 1. Data. CPI inflation
Real GDP growth
16
10
14
8
12
6 Percent
Percent
10 8
4 2
6
0
4
-2
0
-4 19 6
1 19 Q1 64 Q 19 1 67 Q 19 1 70 Q 19 1 73 Q 19 1 76 19 Q1 79 19 Q1 82 Q 19 1 85 Q 19 1 88 Q 19 1 91 Q 19 1 94 19 Q1 97 20 Q1 00 Q 20 1 03 Q 1
19 61 Q 19 1 64 Q 19 1 67 Q 19 1 70 Q 19 1 73 Q 19 1 76 Q 19 1 79 19 Q1 82 Q 19 1 85 19 Q1 88 19 Q1 91 Q 19 1 94 19 Q1 97 20 Q1 00 Q 20 1 03 Q 1
2
Quarter
Quarter
Money growth
Three month interest rate
14
16
12
14 12 Percent
Percent
10 8 6
10 8 6
4
4
0 19 61 Q 19 1 64 Q 19 1 67 Q 19 1 70 Q 19 1 73 Q 19 1 76 Q 19 1 79 Q 19 1 82 Q 19 1 85 Q 19 1 88 Q 19 1 91 Q 19 1 94 Q 19 1 97 Q 20 1 00 Q 20 1 03 Q 1
2
0 19 61 Q 19 1 64 Q 19 1 67 Q 19 1 70 Q 19 1 73 Q 19 1 76 Q 19 1 79 Q 19 1 82 Q 19 1 85 Q 19 1 88 19 Q1 91 Q 19 1 94 Q 19 1 97 20 Q1 00 Q 20 1 03 Q 1
2
Quarter
Quarter
Note: Growth rates are given as annual growth rates (that is, changes with respect to the same quarter in the preceding year). All estimations use quarter-on-quarter growth rates (that is, first differences).
IV. MONEY AND INFLATION SINCE 1960 We start by comparing the out-of-sample forecasting performance of the model in equation (1) for the full post-war period. That is, we ask whether the bivariate model produces better inflation forecasts than and the univariate model and, in addition, whether the inflation forecasting ability of the fourvariate model exceeds that of the trivariate model. The out-of-sample forecasting exercise is straightforward: All models are initially estimated for a ten-year training period from 1960Q1 to 1969Q4.8 We then generate dynamic forecasts for 8
We find very similar results if we reduce the length of the training period to six years, keeping the forecasting period constant. The same holds for the subperiods discussed on the following section. Additional results available on request.
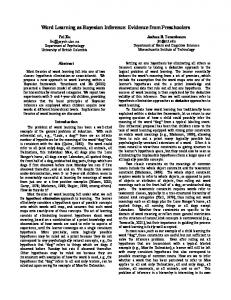
8 the first evaluation period 1968Q1 to 1970Q4, that is, up to twelve quarters ahead. Then the sample is extended one period, the models are re-estimated, and new forecasts values up to twelve periods ahead are generated. This continues until we reach the end of our sample 2005Q2. The procedure generates between 143 and 132 inflation forecasts to evaluate depending on the forecast horizon. The forecasts themselves are generated in a standard fashion. For every draw from the posterior distribution of the coefficients of a given model, a sequence of shocks are drawn reflecting the posterior distribution of the covariance matrix and used to generate future data.9 We hence get as many paths for each variable as we have iterations in the Gibbs sampling algorithm—that is, 10,000. The evaluation is then conducted using the median forecast from this generated predictive density. Figure 2 shows the results in the form of the difference between the univariate and the bivariate RMSEs (left panel) as well as the difference between the trivariate and the fourvariate RMSEs (right panel) for the post-1960 period. As discussed, the RMSEs have been converted into annual growth rates. Figure 2. Reduction in RMSE from adding money growth at different forecasting horizons, 1960-2005. Δmt )′ versus xt = (Δpt )′
x t = (Δpt
0.10 0.09 0.08 0.07 0.06 0.05 0.04 0.03 0.02 0.01 0.00
RMSE (3VAR-4VAR) (in ppt.)
RMSE (AR-2VAR) (in ppt.)
x t = (Δpt
1
2
3
4
5
6
7
8
9
10
11
Forecasting horizon (quarters)
12
Δm t
′ it ) versus x t = (Δpt
Δy t
Δyt
0.10 0.09 0.08 0.07 0.06 0.05 0.04 0.03 0.02 0.01 0.00 1
2
3
4
5
6
7
8
9
10
11
Forecasting horizon (quarters)
Notes: Shown are RMSEs for annual growth rates.
There are a number of noteworthy results. First, and perhaps most strikingly, the inclusion of money growth seems to clearly improve the forecasting performance during the full post-war period. We find a positive difference in RMSEs between the models excluding and including money growth, suggesting that indeed money growth Granger-causes inflation. This holds at all forecasting horizons except the first quarter, where the difference in RMSEs is estimated at zero.
9
it )′
Note that we restrict the sampling to draws which ensure the stationarity of the estimated models. This additional step does not change our results qualitatively and, as a rule, has negligible quantitative effects. (An exception are the full sample (1960-2005) RMSEs of the tri- and four-variate models, which both are approximately 0.7 percentage point higher if non-stationary draws are not rejected.)
12
9 Second, in quantitative terms, the improvement in forecasting performance from adding money growth over the full sample period are generally small. The largest reductions in RMSEs of about 0.09 percentage points occur at longer forecasting horizons. Finally, over the full sample period the marginal contribution of money growth is comparable across models—that is, the RMSE reduction resulting from adding money to the univariate BAR model is similar in magnitude to the reduction achieved by adding money growth to the trivariate BVAR model including real GDP growth and the interest rate. The results have potentially interesting implications. While structural interpretations of time series evidence are obviously difficult, Figure 2 does not contradict the idea that that money may have some (however small) causal or leading role in the determination of inflation.10 And in empirical terms, these findings seem supportive of the view that money, while perhaps useful in the euro area, is generally not helpful in predicting inflation in the U.S. with its vastly different financial sector organization and consumer habits. The question is, however, how robust these results are to changes in the time period under consideration.
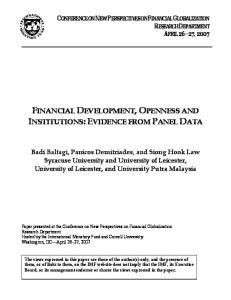
V. THE DECLINING ROLE OF MONEY DURING THE VOLCKER AND GREENSPAN PERIOD There are reasons to suspect that the relationship between money and inflation may have changed over the years. In particular, Paul Volcker’s tenure as the chairman of the Board of Governors of the Federal Reserve System, from August 1979 to August 1987, is often mentioned as a watershed between the period of high inflation following the first oil crisis and the end of the Bretton Woods system and the period of more moderate inflation that followed (see Figure 1).11 If the “great moderation” changed the relation of money and inflation, we may expect the dynamic relation between money growth on inflation to change as well. Figure 3 presents evidence for recent subperiods along the lines of the full sample exercise. The solid lines (“Post-1987”) report the improvement (or deterioration) in forecasting accuracy from adding money growth for a forecasting period starting 1987Q3—that is, postVolcker—up to the end of our sample in 2005Q2. The short-dotted lines (“Post-1989”) are based on the forecasting period 1989Q4-2005Q2. Finally, the long-dotted lines (“Post-1993”) show the results for the forecasting period 1993Q4-2005Q2. We estimate all four models 10
One of the many problems of interpreting non-structural results is that the monetary interest rate rule may introduce links between one economic variable and another that is absent in the economic structure per se. For instance, the empirical link money growth and inflation could be due to the Federal Reserve actively targeting a certain money growth rate. Of course, whether this is a relevant scenario is another question. A related issue raised, for instance, by Orphanides (2001, 2003) is that money may have leading qualities simply because central banks extract otherwise unavailable real time information on output movements from it. Then again, the empirical impact of money on inflation would be through the interest rate rule, making it hard to explain why empirically money growth adds to inflation forecast in addition to the interest rate. 11
See Goodfriend and King (2005) for a recent discussion.
10 discussed in the previous section for each of these subperiods, using again ten-year initial training periods.12 Figure 3. Reduction in RMSE from adding money growth at different forecasting horizons, 1987/89/93-2005. Δmt )′ versus xt = (Δpt )′
x t = (Δpt
0.25
0.25
0.20
0.20 RMSE (3VAR-4VAR) (in ppt.)
RMSE (AR-2VAR) (in ppt.)
x t = (Δpt
0.15 0.10 0.05 0.00
Δm t
′ it ) versus x t = (Δpt
Δy t
Δyt
it )′
11
12
0.15 0.10 0.05 0.00
-0.05
-0.05
1
2
3
4
5
6
7
8
9
10
11
Forecasting horizon (quarters) Post-1987
Post-1989
12
1
2
3
4
5
6
7
8
9
10
Forecasting horizon (quarters)
Post-1993
Post-1987
Post-1989
Post-1993
Notes: Shown are RMSEs for annual growth rates. All forecasting periods extent to 2005Q2.
The results suggest, that the forecasting performance of money growth changes over time, with a clear deterioration in more recent subperiods. Note, first, that both in the univariate/bivariate comparison (left panel) and the trivariate/fourvariate comparison (right panel) the reduction in RMSEs achieved by the inclusion of money growth in the post-1987 sample clearly exceeds the reduction reported for the full sample (see Figure 2), increasing to about 0.25 and 0.15 percentage points at longer horizons, respectively. However, the marginal impact of money growth is much smaller, in particular at longer horizons, during the post-1989 period. Finally, in the post-1993 sample, the improvement in forecasting accuracy from adding money growth falls by an order of magnitude to levels strictly below the full sample results, turning even negative at shorter inflation horizons. In other words, money growth ceases to Granger-cause inflation at all horizons in this period. The other message conveyed by Figure 3 is that the estimated trivariate BVAR model, which includes inflation, real GDP growth, and the three month interest rate, provides a fairly complete description of the forces driving inflation in more recent subperiods. More precisely, in quantitative terms the trivariate model leaves little to be gained from the addition of money growth in the post-1993 forecasting subperiod. While adding money growth reduces RMSEs by about 0.15 percentage points during the post-1987 subperiod, the maximum reduction falls to about 0.05 and 0.001 during the post-1989 and post-1993 subsample, respectively. These effects are small compared to results of the univariate/bivariate comparison during the same subperiods. 12
The forecast evaluations are based on between 73 and 62 periods for the “Post-1987” period, 64 and 53 for “Post-1989”, and 48 and 37 for “Post-1993”, depending on the forecast horizon.
11
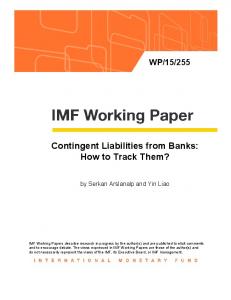
VI. HORSERACE From the perspective of policy makers, in addition to the relative performance of models with and without money, another interesting question is which of the approaches would be most useful for forecasting inflation. To answer this question, we take a look at the absolute performance of the various inflation forecasting models. To that end, Figure 4 depicts the RMSE levels for all four inflation models—univariate, bivariate, trivariate, and fourvariate—and sample periods considered in Sections 4 and 5. Panel (a) reports the RMSE levels for the full sample and the 1970-2005 forecasting period. Panel (b) does the same for the 1987-2005 subperiod, panel (c) for 19892005, and panel (d) for 1993-2005. A first result emerging is that the RMSE levels starkly differ between the full sample and the subperiods, which exclude the 1970s and most of the 1980s. While the average RMSE level at medium and long horizons is between 2 and 3.7 percent for the full sample across all models, the average is at or below one percent in the more recent subperiods. This impressive improvement in overall inflation forecasting accuracy seems to be a consequence of the reduction in inflation levels and volatility during the “great moderation” in the early 1980s— predicting price changes and avoiding large errors obviously is easier in a low-inflation environment.13 As to model selection, Figure 4 suggest that the choice between the bivariate and fourvariate money-based BVAR models is a matter of the forecasting horizon. For the full sample period, the bivariate outperforms the fourvariate BVAR. In contrast, in the more recent subperiods, the fourvariate BVAR model dominates the bivariate BVAR. In general, the differences in forecasting accuracy at shorter horizons remains small, however.
13 The moderation influenced the behavior of money growth and the other times series as well (see Figure 1). Among other things, this lead to an overall change in the dynamics underlying the estimated models. This is illustrated by Figure A1 in the Appendix, which shows the impulse response functions of the simple bivariate BVAR model of inflation and money growth for the pre-Volcker years (1960-1979) and the VolckerGreenspan years (1980-2005). A striking difference between both periods is the larger and more persistent impact of shocks 1960-1979.
12 Figure 4. RMSE levels at different forecasting horizons, 1970/87/89/93-2005 (b) Post-1987
4.0
1.9
3.5
1.7
3.0
1.5
2.5
1.3
RMSE (in ppt.)
RMSE (in ppt.)
(a) Post-1970 (full sample) 1/
2.0 1.5
1.1 0.9
1.0
0.7
0.5
0.5 0.3
0.0 1
2
3
4
5
6
7
8
9
10
11
1
12
2
3
AR
2VAR
3VAR
AR
4VAR
(c) Post-1989
5
6
7
8
9
10
11
12
2VAR
3VAR
4VAR
(d) Post-1993
1.9
1.9
1.7
1.7
1.5
1.5
1.3
1.3
RMSE (in ppt.)
RMSE (in ppt.)
4
Forecasting horizon (quarters)
Forecasting horizon (quarters)
1.1 0.9
1.1 0.9
0.7
0.7
0.5
0.5
0.3
0.3 1
2
3
4
5
6
7
8
9
10
11
12
1
2
3
Forecasting horizon (quarters) AR
2VAR
3VAR
4
5
6
7
8
9
10
11
12
Forecasting horizon (quarters) 4VAR
AR
2VAR
3VAR
4VAR
1/ Scale in panel (a) is larger than in panels (b), (c), and (d). Note: Shown are RMSEs for annual growth rates.
VII. CONCLUSION We find strong indications that including money growth Granger-causes inflation in the United States, that is, it improves forecasting performance out-of-sample. For forecasting horizons up to 12 quarters ahead, bivariate BVAR models of inflation and money growth and fourvariate BVAR models, including, in addition, real GDP growth and interest rates, consistently produce better inflation forecasts than models excluding money.
13 These results may be surprising given that current monetary theory often eschews monetary aggregates as a leading or causal factor for inflation. While any structural interpretation of time series evidence can be only suggestive, the finding that money growth Granger-causes inflation does support (and certainly does not contradict) the idea that money may have some, however small, role in the determination of inflation in the shorter run. This seems to go against the general idea of many current monetary models, where money is either excluded or strictly endogenous with regard to, in particular, interest rates and output. Thus, one way to interpret these findings is that there may be room for more general approaches taking into account, for example, financial frictions or portfolio adjustment costs. It is important to keep in mind, however, that the quantitative role played by money in forecasting inflation is limited. Including money growth, while improving forecasting accuracy as such, does not yield dramatically better predictions—in particular during more recent subperiods and when using fuller models. At least from a practical perspective, this suggests that the opportunity costs of ignoring money, while positive, may be small.
14
APPENDIX Figure A1. Impulse response functions from bivariate BVAR models including money growth and inflation, 1960-1979 and 1980-2005. (a) Pre-Volcker Period (1960-1979) CPI inflation
M2 growth
CPI inflation
s
s
0.3
1
0.2 0.5
0.1 0
0
10
20
30
40
10
20
30
40
10
20
30
40
M2 growth
0.2 1
0 -0.2
0.5
-0.4 -0.6
0 10
20
30
40
(b) Volcker-Greenspan Period (1980-2005) M2 growth
CPI inflation
s
CPI inflation
s
0.6 0.4
0.05
0.2 0
M2 growth
0.1
0 10
20
30
40
0
10
20
30
40
10
20
30
40
1
-0.2
0.5
-0.4 10
20
30
40
0
Notes: Horizon in quarters. Colored band is 68 percent confidence band. The Figures show the impulse response functions of the simple bivariate BVAR model of inflation and money growth for the pre-Volcker years (1960-1979) and the Volcker-Greenspan years (1980-2005). The impulse responses were calculated using a standard Cholesky decomposition of the covariance matrix, where CPI inflation was ordered ahead of money growth.
15
REFERENCES Adolfson, Malin, Michael K. Andersson, Jesper Lindé, Mattias Villani, and Anders Vredin (2007), “Modern Forecasting Models in Action: Improving Macro Economic Analyses at Central Banks”, International Journal of Central Banking 3, 111–44. Andrés, Javier, David Lopez-Salido, and Edward Nelson (2007), “Money and the Natural Rate of Interest: Structural Estimates for the UK, the US and the Euro Area”, Research Division Federal Reserve Bank of St. Louis Working Paper Series 2007005A. Andrés, Javier, David Lopez-Salido, and Javier Vales (2006), “Money in an Estimated Business Cycle Model of the Euro Area”, Economic Journal 116, 457-77. Armstrong, J. Scott (2007), “Significance Tests Harm Progress in Forecasting”, International Journal of Forecasting 23, 321-327. Ashley, R., Granger, C. W. J. and Schmalensee, R. (1980), “Advertising and Aggregate Consumption: An Analysis of Causality”, Econometrica 48, 1149-1167. Assenmacher-Wesche, Katrin and Stefan Gerlach (2006), “Interpreting Euro Area Inflation at High and Low Frequencies”, BIS Working Paper 195. Assenmacher-Wesche, Katrin and Stefan Gerlach (2007), “Understanding the Link between Money Growth and Inflation in the Euro Area”, in: David Cobham (ed.), The Travails of the Eurozone: Economic Policies, Economic Development, Basingstoke: Palgrave Macmillan, 10-29. Bachmeier, Lance J. and Norman R. Swanson (2005), “Predicting Inflation: Does the Quantity Theory Help?”, Economic Inquiry 43, 570-585. Bachmeier, Lance J., Sittisak Leelahanon and Qi Li (2007), “Money Growth and Inflation in the United States”, Macroeconomic Dynamics 11, 113-127. Backhus, David and Patrick Kehoe (1992), “International Evidence of the Historical Properties of Business Cycles”, American Economic Review 82, 864-888. Benati, Luca, (2005) “Long-Run Evidence on Money Growth and Inflation”, Bank of England Quarterly Bulletin Autumn, 349-55. Christiano, Lawrence and Terry Fitzgerald (2003), “Inflation and Monetary Policy in the 20th Century”, Economic Perspectives (Federal Reserve Bank of Chicago) 1Q, 21-45. Christiano, Lawrence and Massimo Rostagno (2001), “Money Growth Monitoring and the Taylor Rule”, NBER Working Paper 8539. Clark, Todd E. and Michael W. McCracken (2001), “Tests of Equal Forecast Accuracy and Encompassing for Nested Models”, Journal of Econometrics 105, 85-110. Clark, Todd E. and Michael W. McCracken (2005), “Evaluating Direct Multistep Forecasts”, Econometric Reviews 24, 369-404. D’Agostino, Antonello and Paolo Surico (2007), “Does Global Liquidity Help to Forecast US Inflation?”, Forthcoming in Journal of Money, Credit and Banking. De Grauwe, Paul and Magdalena Polan (2005), “Is Inflation Always and Everywhere a Monetary Phenomenon?” Scandinavian Journal of Economics 107, 239-259. Diebold, F. X. and Marino, R. S. (1995), “Comparing Predictive Accuracy”, Journal of Business and Economic Statistics 13, 253-263. Doan, Thomas, Robert B. Litterman and Christopher Sims (1984), “Forecasting and Conditional Projection Using Realistic Prior Distributions”, Econometric Reviews 3, 1-100.
16 European Central Bank (2003), “The Outcome of the ECB’s Evaluation of Its Monetary Policy Strategy”, ECB Monthly Bulletin June, 79-92. Faust, Jon and Jonathan Wright (2007), “Comparing Greenbook and Reduced Form Forecasts Using a Large Realtime Dataset”, NBER Working Paper, 13397. Galí, Jordi and Mark Gertler (2007), “Macroeconomic Modeling for Monetary Policy Evaluation”, Universitat Pompeu Fabra Department of Economics and Business Working Papers 1039. Galí, Jordi, Stefan Gerlach, Julio Rotemberg, Harald Uhlig, and Michael Woodford (2004), “The Monetary Strategy of the ECB Reconsidered”, Monitoring the European Central Bank 5, CEPR: London. Gerlach, Stefan (2003), “The ECB’s Two Pillars”, CEPR Discussion Paper 3689. Gerlach, Stefan (2004), “The Two Pillars of the European Central Bank”, Economic Policy, 40, October, 389-439. Goodfriend, Marvin and Bennett McCallum (2007), “Banking and Interest Rates in Monetary Policy Analysis: A Quantitative Exploration”, Journal of Monetary Economics 54, 1480-1507. Goodfriend, Marvin and Robert King (2005), “The Incredible Volcker Disinflation”, Journal of Monetary Economics 52, 981-1015. Hale, Galina and Oscar Jordà (2007), “Do Monetary Aggregates Help Forecast Inflation?”, Federal Reserve Bank of San Francisco Economic Letter 2007-10, 1-3. Hamilton, James D. (1994), Time Series Analysis, Princeton University Press, Princeton. Hofmann, Boris (2006), “Do Monetary Indicators (Still) Predict Euro Area Inflation?”, Deutsche Bundesbank Discussion Paper 18/2006. Ireland, Peter (2004), “Money’s Role in the Monetary Business Cycle”, Journal of Money Credit and Banking 36, 969-983. Jaeger, Albert (2003), “The ECB’s Money Pillar: An Assessment”, IMF Working Paper 03/82. Jones, Barry and Livio Stracca (2006), “Are Money and Consumption Additively Separable in the Euro Area? A Non-Parametric Approach”, ECB Working Paper 704. King, Mervyn (2005), “Monetary Policy: Practice Ahead of Theory (Mais Lecture 2005)”, Lecture delivered on 17 May 2005 at the Cass Business School, City University, London. Available under www.bankofengland.co.uk/publications/ speeches/2005/ speech245.pdf (accessed 5 December 2007). Kremer, Jana, Giovanni Lombardo, and Thomas Werner (2003), “Money in a NewKeynesian Model Estimated with German Data”, Deutsche Bundesbank Discussion Paper 15/2003. Litterman, Robert B. (1986), “Forecasting with Bayesian Vector Autoregressions—Five Years of Experience”, Journal of Business and Economic Statistics 5, 25-38. Lucas, Robert (1980), “Two Illustrations of the Quantity Theory of Money”, American Economic Review 70, 1005-1014. Lütkepohl, Helmut (1989), “A Note on the Asymptotic Distribution of Impulse Response Functions of Estimated VAR Models with Orthogonal Residuals”, Journal of Econometrics 42, 371-376. McCallum, Bennett (2001), “Monetary Policy Analysis in Models without Money”, NBER Working Paper 8174.
17 Nelson, Edward (2002), “Direct Effects of Base Money on Aggregate Demand: Theory and Evidence”, Journal of Monetary Economics 49, 687-708. Nelson, Edward (2003), “The Future of Monetary Aggregates in Monetary Policy Analysis”, Journal of Monetary Economics 50, 1029-59. Neumann, Manfred (2003), “The European Central Bank’s First Pillar Reassessed”, Manuscript, University of Bonn. Nicoletti-Altimari, Sergio (2001), “Does Money Lead Inflation in the Euro Area?”, European Central Bank Working Paper 63. OECD (2007), Economic Survey of the Euro Area 2007: The Role of Monetary Aggregates in Monetary Policy, OECD: Paris. Orphanides, Athanasios (2001), “Monetary Policy Rules Based on Real-Time Data”, American Economic Review 91, 964-985. Orphanides, Athanasios (2003), “Historical Monetary Policy Analysis and the Taylor Rule”, Journal of Monetary Economics, 50, 983-1022. Scharnagl, Michael and Christian Schumacher (2007), “Reconsidering the Role of Monetary Indicators for Euro Area Inflation from a Bayesian Perspective Using Group Inclusion Probabilities”, Deutsche Bundesbank Discussion Paper 09/2007. Woodford, Michael (2003), Interest and Prices: Foundations of a Theory of Monetary Policy, Princeton University Press, Princeton. Woodford, Michael (2007a), How Important is Money in the Conduct of Monetary Policy, NBER Working Paper 13325. Woodford, Michael (2007b), Does a “Two-Pillar Phillips Curve” Justify a Two-Pillar Monetary Policy Strategy?”, Manuscript, Columbia University.