Evolving Fuzzy Prototypes for Efficient Data Clustering† Ben Burdsall Mastère 2IA ENST de Bretagne, BP 832 29285 Brest Cedex, France E-mail:
[email protected] Abstract This paper proposes a novel, evolutionary approach to data clustering and classification which overcomes many of the limitations of traditional systems. The approach rests on the optimisation of both the number and positions of fuzzy prototypes using a real-valued genetic algorithm (GA). Because the GA acts on all of the classes at once, the system benefits naturally from global information about possible class interactions. In addition, the concept of a receptive field for each prototype is used to replace the classical distance-based membership function by an infinite fuzzy support, multi-dimensional, Gaussian function centred over the prototype and with unique variance in each dimension, reflecting the tightness of the cluster. Hence, the notion of nearest-neighbour is replaced by that of nearest attracting prototype (NAP). The proposed model is a completely self-optimising, fuzzy system called GA-NAP.
1. Introduction Classification problems are often solved by constructing prototypes for all existing target classes and using these prototypes to classify new instances, generally using some distance function. One or more prototypes may be used to represent each class. In a typical hyperdimensional input space, prototypes are found within the natural clusters of training data points belonging to an identical class. Clearly, classification accuracy depends mostly on the quality of the prototypes, i.e., the arrangement of clusters. Hence, prototype construction generally involves some form of data clustering. The prototype itself gives a central point or a measure of location to the cluster, while the associated distance or membership function produces an area or measure of variability for the cluster. It follows that the quality of data clustering and the subsequent accuracy of classification are influenced by three parameters: the †
Christophe Giraud-Carrier Department of Computer Science University of Bristol Bristol, BS8 1UB, England E-mail:
[email protected] number of prototypes used to represent each class, the position of each prototype within its class and the membership function associated with each prototype. Most data clustering algorithms, including the popular K-means algorithm, require a priori knowledge about the problem domain to fix the number and starting positions of the prototypes. Although such knowledge may be assumed for domains whose dimensionality is fairly small or whose underlying structure is relatively intuitive, it is clearly much less accessible in hyperdimensional settings, where the number of input parameters may be very large. Classical systems also suffer from the fact that they can only define clusters for one class at a time. Hence, no account is made of potential interactions among classes. These drawbacks are further compounded by the fact that the ensuing classification is typically based on a fixed, distancebased membership function for all prototypes. This paper proposes a novel approach to data clustering and classification which overcomes the aforementioned limitations of traditional systems. The model is based on the genetic evolution of fuzzy prototypes. A realvalued genetic algorithm (GA) is used to optimise both the number and positions of prototypes. Because the GA acts on all of the classes at once and measures fitness as classification accuracy, the system naturally profits from global information about class interaction. The concept of a receptive field for each prototype is also presented and used to replace the classical, fixed distance-based function by an infinite fuzzy support membership function. The new membership function is inspired by that used in the hidden layer of RBF networks. It consists of a multi-dimensional Gaussian function centred over the prototype and with a unique variance in each dimension that reflects the tightness of the cluster. During classification, the notion of nearestneighbour is replaced by that of nearest attracting prototype (NAP). The proposed model is a completely self-optimising, fuzzy system called GA-NAP.
This work was supported in part by the DES Defence Engineering and Science Group, UK.
The paper is organised as follows. Section 2 discusses the notion of a receptive field and shows how receptive fields allow the construction of fuzzy prototypes that can subsequently be used by nearest attracting prototype classification schemes. Section 3 details GA-NAP, an evolutionary method, based on a real-valued genetic algorithm, to generate fuzzy prototypes for efficient data clustering. Section 4 presents empirical results obtained with GA-NAP on a variety of tasks. Results obtained by other relevant methods are also included for comparison. Finally, section 5 concludes the paper and outlines some areas of future work.
2. NAP Classification In traditional nearest neighbour classifiers, training is a partially non supervised process which consists of positioning a set of prototypes in the problem space. A prototype is a representative instance of a class or part of a class. There are various methods for constructing the prototypes. Usually, a clustering technique such as K-means is used. Classification is performed by presenting a data item and assigning it to the class of the prototype to which it is nearest. Euclidean distance is normally taken as the metric for establishing the nearest prototype. Here, the concept of a receptive field [7] for each prototype is used to replace the classical, fixed distancebased function by a fuzzy membership function. A class is represented as the union of the receptive fields of its prototypes. In this setting, classification not only depends on Euclidean distance but also on strength of membership, giving rise to nearest-attracting prototype (NAP) classifiers. With NAP, classification does not have to be discrete (e.g., based solely on finding the highest degree of membership). Fuzzy classifications may be obtained by making use of the membership values produced by all the prototypes. The fuzzy sets positioned over the prototypes may have either finite or infinite support. Finite support means that, with each prototype, a fixed width is associated along each dimension. These widths define a closed perimeter that constitutes the receptive field or scope of the prototype. Asymmetric triangles centred at the prototype define the fuzzy membership functions. All points falling within the prototype’s scope are said to be attracted by it, while all points lying outside the prototype’s scope can not be affected by that prototype. Often, for each dimension, the width of the prototype is calculated to give a degree of membership of 50% for the farthest training data point along that dimension.
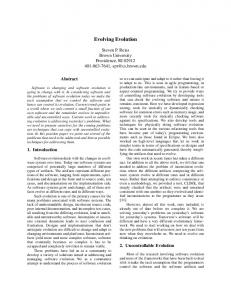
Finite support is used by most existing fuzzy systems (e.g., FRIL [1]). Finite support is simple to understand, easy to visualise and efficient to compute. However, the scope must be explicitly defined in terms of widths, which often produces gaps in the problem space. Consider, for example, the two-dimensional problem space of Figure 1, which is divided up equally into four classes. Assume that a limited and random scattering of points was used to construct the prototypes and associated fuzzy sets. If the number of points were too few to accurately define the regions then the receptive fields may well end up looking like the four inner rectangles, where the black dot denotes the position of the prototype. As it stands all points lying outside any of the rectangles remain unclassifiable, clearly an unsatisfactory solution. In practise, boundaries are extended to remove gaps between neighbouring classes. In two dimensions, this is always possible. However, it becomes impractical in higher dimensions.
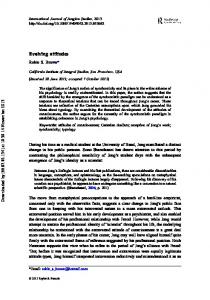
Figure 1 - Finite Support Fuzzy Sets Infinite support solves the above problem by implicitly defining class boundaries, as shown in Figure 2.
Figure 2 - Infinite Support Fuzzy Sets
With infinite support, the fuzzy membership sets placed over each prototype are defined by Gaussian functions, whose variance reflects the tightness of the cluster. Gaussian functions have been used successfully in the hidden layer of RBF networks [8]. Drawing on such successes, NAP also uses Gaussian functions. For each prototype, the membership function is defined by: Membership = e
n x −c − ∑ i i i =1 wi
where xi is the data item's ith coordinate, ci is the prototype's ith coordinate, and wi is the prototype's width in the ith dimension. The width or variance, in each dimension, is calculated during clustering and is defined as the distance between the prototype and the farthest training data item it attracts. Because each prototype gives a certain degree of membership in the interval [0,1] for all points in the problem space, boundaries become implicitly defined, as illustrated in Figure 2. Provided with identical prototypes, NAP classifiers with infinite support are more robust and flexible than their traditional nearest-neighbour counterparts. The following section focuses on the selection of the two remaining parameters affecting efficient clustering and accurate classification: the number of prototypes per class and their positions.
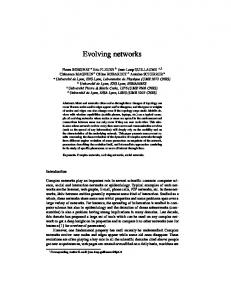
and often alter considerably the final arrangement of the clusters. It has indeed been shown that, generally, any two arrangements are not equivalent in terms of solving the problem at hand, i.e., some arrangements of clusters result in higher classification accuracy for the same data. Another important drawback is the amount of a priori knowledge required. The user must specify the number of prototypes to be used for each class. With a good knowledge of the data set, one can determine a reasonable number of prototypes for a twodimensional problem space. However, this becomes unfeasible in higher dimensional spaces. Hence, one generally keeps a fixed number of prototypes for each class. Yet, this introduces unnecessary constraints. Furthermore, the estimation of the correct number of prototypes radically affects the robustness of clusters in terms of classification. Too few prototypes and the clusters will not capture all the intrinsic class divisions in the problem space. Too many prototypes and the system will be highly susceptible to over-fitting. Figure 3 shows how classification accuracy varies for a finite RBF, based on K-means, with increasing number of prototypes (or centroids) per class. The top curve shows the accuracy on the training data whilst the bottom curve shows the accuracy on unseen test data. Over-fitting is seen in the negative correlation of the two curves. Note that classification accuracy is used to measure the success of clustering rather than the classification process itself. Ove r -fittinng in a finite RBF (Nois y IRIS flow e r s )
3. GA-NAP 100.00%
There are several problems with K-means. First, the initial positioning of prototypes is non-deterministic
95.00% Accuracy
The K-means algorithm is probably the most widely used data clustering algorithm. K-means iteratively constructs prototypes by computing centres of gravity. First, the algorithm splits the data into their separate classes. Then, for each class in turn, the algorithm chooses a predefined number n of prototypes randomly from amongst the data points. Here, n is the fixed, assumed number of clusters for each class. The data points are then clustered around each prototype, using Euclidean distance, i.e., a point belongs to a prototype if it is closest to that prototype. For each cluster, the centre of gravity is found and becomes the new prototype’s position for that cluster. After the new prototype positions have been calculated for all the clusters, the data points are re-clustered and the new centres of gravity calculated. This process goes on until all prototypes stop moving between iterations.
90.00% 85.00% 80.00% 75.00% 70.00% 2
3
4
5
6
7
Ce ntr oids pe r Clas s
Figure 3 - Over-Fitting The problem of estimating the correct number of prototypes in data clustering is well known. Some interesting work has been done in the context of RBF networks (e.g., [4]). It focuses on the detection and elimination of surplus centroids at the end of the clustering process. These elimination techniques are normally based on heuristics to find prototypes which have been precariously placed on class boundaries or
methods to measure the individual benefit of each prototype. Culling redundant prototypes certainly helps to reduce the amount of over-fitting. However, the approach is curative. Rather than trying to cure the problem, it is better to prevent it in the first place by allowing the number of prototypes to naturally evolve throughout the clustering process. This preventive philosophy is at the heart of GA-NAP. GA-NAP optimises the K-means clustering process by co-evolving two independent parameters: the prototype starting positions and the number of prototypes for each class. A real-valued, rather than a binary encoded, genetic algorithm (GA) is used. The chromosome is moved from its original genotypic form as a binary string to a more phenotypic representation. Each chromosome, or individual, encodes one set of prototype starting positions for each class, as follows. &
&
&
&
&
&
individual = [{ p11, ..., pk11 },{ p12 , ..., pk22 },..., { p1n , ..., pknn }]
fitter individuals. In other words, highly-fit individuals who are well adapted to the problem space are more likely to reproduce and hence propagate their “good” genes. After two parents have been selected, genetic operators are applied to produce a single offspring, which replaces the least fit individual in the population. Selection operates as follows. Let PopSize be the size of the population and fitness(i) denote the fitness of individual i. The total fitness, T, of the population is given by: PopSize
∑ fitness(i)
T=
i =1
fitness(i ) be the probability that T individual i is selected. The cumulative probability is defined by: Then, let
pi =
q0 = 0 i
where n is the number of classes and ki is the number of prototypes for class i. The ki's are allowed to vary continually during evolution. Hence, an individual may be over or under specified in terms of the number of prototypes it contains. In the current implementation, a practical upper bound of 7 is placed on the ki's since empirical evidence suggests that most problems require fewer than 7 prototypes per class. The GA population is initialised by creating between 30 and 60 random individuals. The individuals are ranked in order of fitness, which reflects how well an individual is adapted to its environment. To obtain the fitness of an individual, K-means clustering is first applied using the parameters encoded in the individual. Following clustering, an evaluation function measures the effectiveness of the clustering. The function used depends on the final application of the clustering. For example, if the objective is to find the number of inherent clusters present in the data set, the measure would probably be some distance-based calculation of the variability in the clusters. Here, the objective is classification. Hence, the measure used is the ability of an individual to correctly classify a sample of unseen data items using its prototypes under NAP, that is, fitness =
correct classifications × 100 size of evaluation set
Recombination, the process whereby individuals reproduce, uses a selection mechanism biased towards
qi = ∑ p j
for i ≥ 1
j =1
A random number r is chosen in the interval [0,1] and the individual i is chosen such that qi −1 < r ≤ qi . After the first individual is found, the process is repeated to choose another individual. The only difference is that the same individual cannot be chosen again. Many GAs ignore this condition and thus allow asexual reproduction. The problem with asexual reproduction is that it promotes saturation of the population by super-individuals [6]. Super-individuals are those whose fitness is well above that of the population average. Super-individuals are undesirable as they reduce exploration of the problem space and increase the chances of the population becoming trapped in a local optimum. An effective strategy for preventing super-individuals from dominating the population is discussed later. As a phenotypic representation is used to code the chromosomes, the traditional genetic operators of crossover and bit-mutation have to be modified. If a phenotypic version of Holland’s classical crossover (i.e., where two chromosomes are spliced and swapped over) were implemented, GA-NAP would produce nonindividuals, i.e., descendants which violate the problem space. In particular, it would be possible to have descendants possessing two identical prototypes. This is clearly invalid as it has no meaning in the model. There exists a number of different ways of dealing with non-individuals, ranging from repair algorithms to more elaborate ideas of fixing fitness-penalties [3].
Again, the approach taken here is preventive rather than curative. The classical crossover operator is replaced by a novel operator, called gene-pooling, and three different types of mutation are introduced. Gene-pooling takes two parents and produces a single offspring. Following [5], a population represents a pool of genes rather than a collection of individuals. A gene, here, is a single prototype’s starting position. During crossover the genes of two parents are mixed together into a kind of “genetic soup.” From this mixture, a new individual is formed by random selection of genes. The chromosome size of the single offspring is determined by a random number which follows a normal distribution centred on the average parental chromosome size. Non-individuals are eliminated by constraining the mixture of genes to contain at most one instance of each prototype. Genepooling is a valid form of crossover since the order of genes on a chromosome is irrelevant. Whilst crossover is aimed at exploitation, mutation, introduced in [9], is aimed at exploration of the problem space [10]. Exploration of the problem space, provided by the random element of mutation is vital to prevent premature convergence at a local optimum. Mutation is provided by three independent methods. These are mutation by adding a prototype, by removing a prototype and by changing an existing prototype. The first two methods, together with gene-pooling, provide a way of optimising the number of prototypes per class. Mutation by removing a prototype. Choosing an arbitrary gene class, one of the genes (prototypes) is selected at random. The probability that the prototype is removed from the chromosome is given by: pm1 =
gene length × pr max gene length
where pr has a default value of 0.67. Recall that for practical purposes, max gene length is set to 7. Mutation by adding a prototype. As in the above method, a gene class is picked at random. The probability that a new prototype is added is given by: pm2 =
( max gene length − gene length) × pa max gene length
where pa has a default value of 0.875. The new prototype is taken at random from within the data points for that class. Mutation by removing and mutation by adding are generally mutually exclusive.
Mutation by changing a prototype. Again, a gene class is picked at random and a prototype is chosen. This prototype is exchanged for any other in the data set providing that the new prototype chosen does not already exist in the gene class. The probability of this happening is given by ps which has a default value of 0.3. Mutation by changing a prototype is akin to classical mutation. The values of the parameters pr, pa and ps are chosen so that each mutation has a 30% chance of occurring for a chromosome which is half filled. In addition to the above, two extensions have been implemented in GA-NAP to enhance its optimising ability. The first extension is aimed at the problem of over-fitting, while the second extension is aimed at the problem of saturation by super-individuals. Punishment of “greedy” individuals. Individuals with more prototypes than others generally have higher fitness. This is due to the fact that they are likely to have placed their numerous prototypes near the examples in the validation set. It is therefore obvious that they should do better, at this stage, than individuals having fewer prototypes. However, the problem is that these individuals tend to over-specialise on the particular validation set used and to perform poorly on other sets (i.e., over-fitting occurs). To reduce the problem of individuals becoming greedy (i.e., using unnecessarily large numbers of prototypes), there are two solutions available. One consists of fixing the maximum number of prototypes allowed for problems known only to require few prototypes per class. However, this constrains the GA and defeats the purpose of evolution. Furthermore it relies on the user having a priori information of the problem. A more adequate solution allows individuals to evolve larger number of prototypes per class but punishes them for doing so. The idea of punishment has been used before in GAs (e.g., bucket-brigade algorithm). Punishment introduces a form of handicap which allows greedy individuals to be compared with less greedy individuals having fewer prototypes. The punishment mechanism works in such a way that if the true number of prototypes for a problem is high then individuals are still allowed to obtain these high numbers. In GANAP, punishment is computed as follows. n
punishment = ∑ α i × i =1
138 . × ( ki − 3) × fitness n
where n is the number of classes,
ki is the number of prototypes for class i, fitness is the fitness value of the individual, and αi is 1 if ki>3 and 0 otherwise. The constants in the above equation give a punishment of 5.5% to an individual that uses the maximum number of permissible prototypes for all classes whilst having a fitness of 90%. The punishment becomes more severe as the fitness of the individual increases. Punishment of less fit individuals is not required because they are unlikely to be selected and inflicting a further punishment would be an over-kill. With the addition of the punishment mechanism, the actual fitness function for GA-NAP becomes: fitness′ = fitness − punishment Life span control. A super-individual is one whose fitness far exceeds the average fitness of the population. At first sight, it seems that these individuals are exactly those that should propagate throughout the population. However, closer inspection shows that superindividuals reproduce so quickly that they dominate the population after just a few generations. Propagating super-individuals leads to rapid exploitation but is likely to result in premature convergence to a local optimum. On the other hand, too slow a convergence produces a “random walk” effect and the optimal solution will probably be found in geological time scales. A balance between exploitation and exploration of the problem space must be found. This problem was addressed in [6] by using the notion of a life span for individuals. GA-NAP follows this idea and defines the life span of an individual i, at the time of creation, as: Lifespan(i ) = β ×
fitness(i ) Mean
where Mean is the average fitness of the population and β is some constant. Each time an individual reproduces, its life span is reduced by 1. When the counter reaches 0 the individual dies and is removed from the population. Should a parent die following reproduction, its offspring takes its place rather than that of the weakest individual in the population. GA-NAP evolves its initial population of random individuals by applying the above operators and mechanisms through a number of generations. Upon convergence, the evolutionary process stops and the sets of prototype starting positions encoded in the fittest individual are returned.
4. Empirical Results To validate GA-NAP, four benchmark data sets were used, namely Iris, Diabetics, Noisy-Iris and NoisyDiabetics [11]. The noisy versions of these data sets contain the original data with substantial noise added to both the training and validation sets. All testing is performed on unseen data. Multiple simulations and cross-validation techniques were employed to increase the validity of the results. The results for GA-NAP are compared against those of a simple NAP classifier with 3 (K-means-generated) prototypes per class, an useroptimised infinite RBF network with 3 centroids per class, and an optimised multilayer perceptron (MLP). Table 1 shows the classification accuracy of each system for the four problems selected. Problem Iris Diabetics Noisy Iris Noisy Diab. Average
Inf RBF 96.3 95.1 81.7 89.0 90.5
MLP 96.0 96.0 83.0 85.1 90.0
NAP 95.6 95.2 79.9 86.3 89.3
GA-NAP 98.0 96.1 81.8 91.0 91.7
Table 1 - Comparative Classification Accuracy The fixed number 3 of prototypes per class used in the non-evolutionary models results from intensive, userdriven testing. With GA-NAP, the number of prototypes per class evolves naturally to settle on a value between 2 and 4. The cost of the evolution process is relatively low as convergence occurs within less than 5 minutes of evolution. Moreover, with no a priori knowledge nor manual fine tuning, GA-NAP results in better overall classification accuracy for the problems considered. In addition, both extensions functioned in the expected way. The life span control mechanism was tested empirically and was shown to eliminate superindividuals and reduce the rate of convergence. However, no generalisation can be made as to whether it was of significant benefit for all the problems tested. The effect of punishment for greedy individuals, however, was far more noticeable. The effect was seen in terms of a reduction of average chromosome length and reduced over-fitting of the validation sets.
5. Conclusion This paper presents GA-NAP, a self-optimising data clustering system. NAP classification, inspired by the hidden layer of RBF networks, extends traditional
nearest-neighbour classification by using infinite fuzzy support rather than distance-based membership. Armed with a robust, flexible membership function for prototypes, GA-NAP harnesses the power of genetic evolution to optimise the classical K-means algorithm by co-evolving the number and positions of prototypes needed for efficient and accurate NAP classification. GA-NAP requires no manual fine tuning or ad hoc tweaking of parameters as all input parameters are evolved automatically. The representation used by the GA is phenotypic and generic enough so as to be useful as a front-end processing step for any K-means based application. Only the fitness function needs be tuned to the particular application. Empirical results show that GA-NAP has overall better performance than standard NAP, RBF networks and MLPs. Moreover, evolution is quite rapid (typically within 2.5 minutes). One interesting result of this work is an indirect insight into RBF networks. The main difference between GANAP and RBF networks is that RBF networks do not label hidden nodes but train an extra layer of weights to the actual (labeled) output units. The relatively higher performance of GA-NAP over RBF networks seems to suggest that the extra layer of weights is of little (if any) value in terms of final classification accuracy. Hence, rather than devising new weight training procedures, the focus of the research in RBF networks should be placed in improving the unsupervised clustering process. Work has already been started in applying the techniques developed for GA-NAP to the design of optimal hidden layers for RBF networks (e.g., [2]). In addition, even though GA-NAP focuses on clustering for classification problems, the evolutionary techniques used are very generic and have a much broader applicability. In particular, with adequate fitness functions, GA-NAP may be applied to the construction of fuzzy sets that could subsequently serve for the design of fuzzy rules in expert systems.
References [1]
[2]
[3]
Baldwin, J.F., Martin, T.P. and Pilsworth, B.W. (1995). Fril: Fuzzy and evidential reasoning in artificial intelligence. John Wiley & Sons. Burdsall, B. and Giraud-Carrier, C. (1996). GARBF: A sel-optimising RBF network. Submitted to ICANNGA’97. Davis, L. and Steepstrup, M. (1987)..Genetic algorithms and simulated annealing: An overview. In Davis, L. (Ed.), Genetic Algorithms and Simulated Annealing, Morgan Kaufmann Publishers, Inc., Los Altos, CA, pp. 11-11.
[4]
Decaestecker, C. (1994). Design of a neural net classifier using prototypes. Technical Report, IRIDIA, Université Libre de Bruxelles. [5] Fogel, L.J. (1994). Evolutionary programming in perspective: The top down view. In Zurada, J.M., Marks, R.J., and Robinson, C.J. (Eds.), Computational Intelligence: Imitating Life, IEEE Press, Inc., NY. [6] Michalewicz, Z. (1992). Genetic Algorithms + Data Structures = Evolution Programs. Springer Verlag. [7] Moody, J. and Darken, C. (1988). Learning with localized receptive fields. In Proceedings of the 1988 Connectionist Models Summer School, Pittsburgh, MA. [8] Moody, J. and Darken, C. (1989). Fast learning in networks of locally-tuned processing units. Neural Computation, Vol. 1, pp. 281-294. [9] Rechenberg, L. (1973). Evolutions-strategie: Optimierung Technischer Systeme nach Prinzipien der Biologischen Evolution. Frommann-Holzboog, Stuttgart. [10] Spears, W.M. (1992). Crossover or mutation? In Whitely, L.D. (Ed.), Foundation of Genetic Algorithms II, pp. 221-237. Towards the [11] Van de Merckt, T. (1995). integration of concept learning into problemsolvers: Classification, evaluation and concept description in numerical attribute spaces. Ph.D. Thesis, Université Libre de Bruxelles.