Evolving the Structure of Hidden Markov Models for Micro aneurysms Detection Jonathan Goh, Lilian Tang, Lutfiah Al turk Abstract - Micro aneurysms are one of the first visible clinical signs of diabetic retinopathy and their detection can help diagnose the progression of the disease. In this paper, a novel technique based on Genetic Algorithms is used to evolve the structure of the Hidden Markov Models to obtain an optimised model that indicates the presence of micro aneurysms located in a sub-region. This technique not only identifies the optimal number of states, but also determines the topology of the Hidden Markov Model, along with the initial model parameters.
I.
INTRODUCTION
Diabetic retinopathy (DR) is an eye disease that has been one of the major causes of blindness in the world for adults under the age of 65 [1]. Early detection of DR through screening can prevent blindness and allow for continuation of good vision. A typical screening process involves the acquisition of retinal images from the patient followed by manual examination of each individual image by medical experts (these are actually often technicians trained by medics) in order to identify any signs of deterioration. This process is known to be inefficient, expensive and time consuming. Micro aneurysms are one of the first visible signs of DR and it is known that the amount of this clinical sign in the retina image can help diagnose the progression of the disease. Micro aneurysms are swelling of the capillaries that are caused by the weakening of the vessel walls due to high sugar levels in diabetes and eventually leak to produce exudates. In retina images, micro aneurysms appear as small reddish dots with similar intensity as haemorrhages and blood vessels. This particular sign is an important early indicator of the disease and can contribute to Manuscript received June 25, 2010. Jonathan Goh is with the Department of Computing, University of Surrey, Guildford, Surrey, GU2 7XH, United Kingdom (Phone: +44 7525754397; e-mail:
[email protected]). Lilian Tang is with the Department of Computing, University of Surrey, Guildford, Surrey, GU2 7XH, United Kingdom (email:
[email protected]). Lutfiah Al turk is with the Department of Statistics, King Abdulaziz University, Kingdom of Saudi Arabia.
helping ophthalmologists identify effective treatment for the patient at an early stage. The motivation of this work is to develop a technique that is able to detect micro aneurysms as part of a diagnosis system, so that medical experts are able to diagnose the stage of the disease with ease. However, detection of micro aneurysms is a very complex task. One of the main obstacles is the variability in the retinal image, depending on factors such as degree of pigmentation of epithelium and choroid in the eye, size of pupil, illumination, disease, imaging settings (which can vary even with same equipment), patients’ ethnic origin, and other variants. These factors affect the appearance of micro aneurysms features. They can be easily mistaken as other features in retinal images and cause ambiguity in detection. Hence, the recognition procedure of this clinical sign cannot be treated in isolation. Generally, it is agreed that Hidden Markov Models (HMM) is a useful statistical modelling tool for information extraction. In this research we try to build a contextual model using HMMs to deal with the ambiguity in micro-aneurysms detection. There are two outstanding issues. Firstly, how to determine the topology of the HMM and secondly, what is the optimised model parameters for accurate representation of the training data? While most research in HMMs have focused on applications such as speech recognition [2, 3], DNA sequencing [4], handwriting recognition [5], very little work has been carried out to statistically model and understand the context in images. Traditionally, optimising an HMM can usually be done through the refinement of the HMM after each training. Refinement can include changing the number of states, the initial distribution states and the transition probabilities before re-training the HMM. The most popular training algorithm for HMM is the BaumWelch [6] algorithm; however, this algorithm is a hill climbing algorithm and heavily depends on the initiate estimates. It is also known that bad estimates for this algorithm usually lead to a sub-par HMM. Hence, the motivation behind this work is to obtain an optimised HMM based on the initial parameters used to train a HMM. Essentially, this can be viewed as a searching algorithm in a problem space. Genetic Algorithms (GA) are stochastic search algorithms that perform a global search in the
problem space to obtain an optimal solution and have been used in various fields such as optimizing the weights and structure of a Neural Network [7], combining classifiers [8]. Kwong and Bhuriyakorn [9, 10] have applied the GA to evolve the structure of the HMM for speech recognition whereas Kyoung-Jae [4] applied this technique to DNA recognition. More recently, Xiao [11] used GA to optimise a HMM for web information extraction. Our previous work [12] has demonstrated the effectiveness of HMM in the detection of micro aneurysms as a contextual analysis model. This paper further extends our previous work to determine a structurally optimised HMM. In Section 2, we give a brief description of GA and HMM. The technique used for optimising the HMM is presented in Section 3. Section 4 describes the experiments and we summarise our work in section 5.
II. GENETIC ALGORITHMS & HIDDEN MARKOV MODELS The working mechanisms of genetic algorithms are inspired from natural selection and genetics. They operate on a population of solutions, applying the principal of the survival of the fittest in competing environment. At each generation of the algorithm, a new set of solutions is created by a process of selecting individuals according to their strengths (fitness) in the problem domain and genetically modifying them to produce offspring. This process leads to the generation of a new population of individuals that are better suited for the problem space than the individuals that they were created from, eventually reaching an optimal solution. The canonical GA loop consists of four steps: 1. Fitness evaluation 2. Selection 3. Genetic modifications 4. Replacement At the beginning of the loop, there is an initial population of chromosome which are the encoded versions of the candidate solutions. Their fitness value is obtained through a fitness function. Once the GA loop starts, the fitter chromosomes are selected as parents to generate offspring. The fitness values of the offspring are obtained and the weaker chromosomes are replaced by the stronger offspring. This loop will then repeat until the termination criterion is met. Ideally, through the natural selection and genetic modifications, the final population would consist
only of the strongest chromosomes which would be decoded as the optimised set of solutions. In our work, each solution would be encoded into a chromosome which represents the HMM structure. Typically, a HMM is characterised by: a) Number of states, M b) Transition probability distribution matrix A. A={aij}, where aij is the transition probability of the Markov chain transiting from state i to state j. c) Observation sequence, O. d) Initial state distribution, π. Hence, the HMM is represented by: λ = (A, O, π). In order for the HMM to represent the image, we need to decide upon the topology of the HMM, the number of states of the model and the transitions that are allowed between states. Training of the HMM can be carried out using the Baum Welch training algorithm which is an expectation maximisation algorithm that adjusts the model parameters to locally maximise the likelihood of the training data based on an initial estimate of the parameters. Recognition of the image is performed using the Viterbi algorithm which finds the most likely state sequence given the HMM model, λ and a sequence of observations. III. GA-HMM TRAINING In order for a HMM to be effective, the number of states and the structure of the connecting states are crucial. If a simple model is used for training, it is unlikely to obtain a high likelihood. On the other hand, if a model is too complex, the model may easily learn the training data, resulting in over-fitting of the training data. In the following sections, we demonstrate the use of GA to optimise HMMs using sub-images of micro aneurysms, background and blood vessels (refered to as MA, BG and BV respectively from here on) as the training data, not only can the algorithm automate the discovery of HMM structures, it can also optimise the initial emission and transition of the HMM by incorporating the Baum Welch algorithm into the GA algorithm. A.
Feature Extraction for HMM
The training data used for this research are 15 by 15 pixel images which are the output from the ensembles in our earlier work [12]. These images comprises of micro aneurysms (MA), background (BG) and blood vessels (BV).
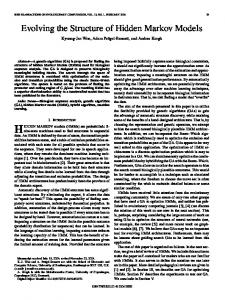
Each sub-image is divided into 9 5x5 pixel smaller sub-images as seen in Figure 1 to be used as observation sequences for the HMM.
state. Initial state transition probabilities are also randomly assigned between the initiating states and the transiting states. Transitions Type 1
Models nth
nth+1
nth
nth+1
Type 2
Type 3 nth
Figure 1 States of Sub-Image The Discrete Cosine Transform (DCT) is performed to obtain the features for each of the 5x5 pixel sub-image. The DCT is used as it can represent an image in terms of sum of sinusoids of varying magnitude and frequencies, thus obtaining the most important information in terms of just a few coefficients. Once the DCT has been applied for each observation, the result from the DCT process for each state is reshaped into a 25x1 column and used as part of a sequence for inputting into the HMM. B.
Training
For GA optimisation, the solution has to be encoded into a chromosome for evolution. In this case, since HMM uses real numbers, a real-value string was used instead of the binary string as the representation of the chromosome in the GA. The chromosome consists of the following information: 1. Number of states 2. Type of states as seen in Figure 2 3. Transition probabilities C.
Initial population
The initial population was generated randomly. For each candidate solution, a number of states, which is an integer between 4 and 11, was randomly generated, since according to Bakis [14], the number of states would usually be identical to the number of observation sequences. In this work, 9 observation sequences are used to represent the various subimages, thus the least number of states is set to 4 and the maximum number of states to 11. With the initial number of states, the transition between states can be set. For each state, there are a few different kinds of transitions that can be assigned to them as listed in Figure 2 and they are randomly assigned to each
nth+1
nth+2
Type 4 nth
nth+1
nth+2
Type 5 nth
nth+1
nth+2
nth+n
Figure 2: Transition types D.
Fitness Evaluation
As the solutions are generated, there must be a way to measure the generalisation capability of the HMM to recognise micro aneurysm sub-images. GA uses a fitness evaluation mechanism to gauge the confidence level of each solution. A higher level typically represents a better optimised solution whereas a lower level represents a weaker solution. The fitness values are usually mapped from the output of the objective function. In this research, we use the average maximum likelihood which is calculated by the Baum Welch algorithm to measure the fitness used in selecting stronger individuals from the population. The average maximum likelihood pn of the HMM, λ , that generates the observation sequence O1, O2 ... On is calculated using the following equation: pn =
⎛ T ⎞ ⎜ ∑ p (On | λ ) ⎟ / T ⎝ n =i ⎠
where T is the number of training observations sequences. E.
Selection
Selection is the phase used to determine which parents to choose for reproduction. In this work, we chose to use the Roulette Wheel Selection (RWS). RWS operates by assigning a sector according to the fitness value of each chromosome. Depending on the
value of the fitness value, the larger the fitness value the bigger the sector. The following equation is the mathematical formula used to map the fitness value of each chromosome to the size of the sector:
pi =
fi
For the states which the offspring inherited, no mutation is carried out. For the newly generated states, the transition probabilities are again, randomly generated to allow the GA to provide more explorative searching capabilities.
N
∑f
IV. EXPERIMENTAL RESULTS
i
j =i
where, fi is the fitness value and N the number of chromosomes in the population. F.
Crossover
This operation represents the major driving force in the canonical GA for optimizing the HMM. In crossover, we need to decide on a crossover point to swap parts of chromosome of the parents to produce offspring. In this work, we adopted the 1-point crossover. If both parents have the same number of states, the creation of offspring is straightforward. However, if the two parents have different number of states, there must be a decision on how many states the offspring will have. In order to solve this problem, the offspring will have the average number of states between the two parents and to make up for the additional state, the offspring will inherit the additional state for the parent as illustrated in Figure 3. G.
Mutation
Generally, the mutation operation in GA is used to introduce variations into the newly generated offspring. As mentioned previously, the Baum Welch algorithm is very sensitive to the initial model parameters. Therefore, in our work, to allow the GA to explore the problem domain, we mutate the initial transition probabilities of each offspring. Crossover: 1
2
5
3
1
3
4
1
1
2
4
1
1
3
5
3
2
1
Parent 1
A.
Data Set
The 15 by 15 training samples used to train Hidden Markov Models are obtained from 100 retina images of various sources including the Optimal Detection and Decision-Support Diagnosis of Diabetic Retinopathy database [13].
B. Experiment Setup 700 background (BG) sub-images, 700 micro aneurysms (MA) sub-images and 700 blood vessel (BV) sub-images are used to train the different HMMs. In order to test the accuracy of the models, we have a test set that consists of the 3 categories with each one consisting of 500 sub-images. C.
Experiment Performance
The GA-HMM algorithm was run according to the parameters setup given in Table 1 for optimising the various models and their average maximum likelihood are listed after the relevant generations were reached. Population Size
30 30 30 50 50 50 70 70 70
Generations
30 45 60 30 45 60 30 45 60
Average Maximum Likelihood for MA models -8.13788 -8.13988 -8.12935 -8.13263 -8.11411 -8.11642 -8.12040 -8.12388 -8.10261
BV Models -8.29446 -8.29987 -8.30488 -8.30358 -8.30123 -8.29886 -8.29577 -8.29178 -8.29268
BG Models -8.12411 -8.13859 -8.12927 -8.09699 -8.09844 -8.09783 -8.16765 -8.10768 -8.19201
Parent 2
Table 1: GA parameters
2
Offspring 1
2
Offspring 2
Considering the results listed above, each of the models with the highest average maximum likelihood was taken as the optimised GA-HMM. We then compare these results with the results obtained by the Baum Welch Algorithm with ifferent number of states to demonstrate that the GA-
Figure 3: Crossover Operation
HMM are far more optimised to represent the context of the different sub-images. The performance listed in Table 2, indicates that the optimal number of states found by the GA-HMM algorithm is identical to a manually trained HMM. Models MA BV BG
Optimised States (9) -8.10261 -8.29178 -8.09699
Average Maximum Likelihood 6 7 8 States States States -8.347 -8.215 -8.209 -8.466 -8.378 -8.342 -8.291 -8.274 -8.252
9 States -8.150 -8.328 -8.186
Table 2: Performance of Different Methods This suggests two points. Firstly, not only is our training algorithm able to find the optimised number of states to represent the image, it also outperforms those trained by the Baum Welch Algorithm, since it has a higher average maximum likelihood rate. Secondly, the GA-HMM confirms the observation made by Bakis [14] indicating that the number of states of the HMM should corresponds to the number of observation in a sequence. Ideally, it would be best to illustrate the model that was evolved. Due to space limit of this paper, we illustrate the transitions between the states in Table 3. This model is the structure that was evolved to represent micro aneurysms using 70 individuals in the population and a 60 generation cycle. The optimised model is very complex and may be not one a human user would design. Nevertheless, the model was able to fully capture the various contexts of the different categories. State Transition to States: 1 2 2 2, 3, 4, 5, 6, 7, 8, 9 3 3, 4, 5, 6, 7, 8, 9 4 4, 5, 6 5 5, 6, 7, 8, 9 6 5, 6, 7, 8 7 7, 8, 9 8 8, 9 9 End State Table 3: Transition among states
D. Experimental Results To examine the GA-HMM’s ability for image recognition, we perform an experiment with 1500 sub-images consisting of background, micro aneurysms and blood vessels. The sub-images were converted into a sequence of observations and input into the different GAHMM for recognition using the Viterbi algorithm.
The model which best matches the sequence would be used as the output label. The GA-HMM accuracy was found to be superior to those trained the Baum Welch algorithm, as demonstrated in Table 4. The recognition rate for MA is 98.21%, 94.48% for BV, and 91.2% for BG, respectively. While for the models trained by the Baum Welch algorithm, the accuracy is at 88.1%, 77.3% and 80.4%, respectively. Model GA-HMM HMM MA 98.21% 88.1% BV 94.48% 77.3% BG 91.2% 80.4% Table 4: Experimental Results of GA-HMM and HMM
V.
CONCLUSIONS
In summary, a novel way to represent images using a fully automated structure discovery technique involving GA and HMM was presented in this paper. The experimental results have shown that GA-HMM is capable of searching for a structure that is more optimised than designed structure trained by the Baum Welch Algorithm. Using the GA-HMM algorithm, not only was the algorithm able to find the optimal number of states to represent the image, it also managed to optimise the initial transition probabilities for a better trained model as indicated by its average maximum likelihood. Furthermore, the recognition rate of the GA optimised HMM models was also superior to the HMM models trained by the Baum Welch algorithm. These results demonstrate that the GA-HMM is capable of context reasoning for detecting micro aneurysms and thus facilitate finer analysis during clinical sign detection on retina images. ACKNOWLEDGEMENTS We would like to express our gratitude to Dr Tunde Peto, MD, Head of Reading Centre, Department of Research and Development, Moorfields Eye Hospital NHS Foundation Trust, for her invaluable advice and help. The authors also thank King Abdul-Aziz University, Kingdom of Saudi Arabia, and the Department of Computing, University of Surrey, UK, for their financial support to the project.
REFERENCES [1] World Health Organisation. [Internet],