In this table, we compare the Good and the Gail-Mantel approxima- tions to I sI for Tables 1, 3, and 4 of this paper, and for the largest sample sizes for which.
PSYCHOMETRIKAmVOL. 44, NO. 1. mArCH, 1979
E X A C T C O N D I T I O N A L TESTS FOR CROSS-CLASSIFICATIONS: A P P R O X I M A T I O N OF A T T A I N E D S I G N I F I C A N C E LEVELS ALAN AGRESTI, DENNIS WACKERLY, AND J A M E S M . BOYETT UNIVERSITY OF FLORIDA A procedure is proposed for approximating attained significance levels of exact conditional tests. The procedure utilizes a sampling from the null distribution of tables having the same marginal frequencies as the observed table. Application of the approximation through a computer subroutine yields precise approximations for practically any table dimensions and sample size. Key words: contingency tables, independence, chi-square, Kruskal-Wallis, computer algorithm.
1. Introduction Several recent articles have outlined methodologies for exact conditional analyses of data which are summarized in an r × c matrix of counts. Depending upon the purposes of the experimenter, several types of null and alternative hypotheses are appropriate. Some of the procedures [Agresti & Wackerly, 1977; Freeman & Halton, 1951] test for independence between two variables, while others [Klotz & Teng, 1977] are designed to compare several treatments with respect to observed responses on an ordinal categorical variable. Extentions of Fisher's [1971] now famous experiments involving the tea-tasting lady have also been considered [Wackerly, McClave & Rao, 1978]. When testing the null hypothesis of independence of two variables in a crossclassification table, various types of alternative hypotheses may be appropriate. For example, if the two variables are measured on a strictly nominal scale, we might be interested in the broad alternative of "statistical dependence". A natural test statistic in that case is the standard chi-square statistic or a nominal measure of association such as G o o d m a n and Kruskal's lambda or tau. Alternately, if both variables are ordinal categorical, we might wish to detect whether there is a monotonic relationship between the variables. In that case we might use the alternative hypothesis that the proportion of concordant pairs of observations is unequal to the proportion of discordant pairs, and employ Kendall's tau-b as the test statistic. In the case of comparing several treatments on an ordinal categorical variable, the null hypothesis of independence corresponds to homogeneity of the treatments. We might then wish to use a Kruskal-Watlis type statistic for detecting response shifts among those treatments. In practice, cross-classification tables often occur in which the overall sample size or the cell frequencies are too small to employ asymptotically derived sampling distributions for these test statistics. In such cases, as an alternative procedure we can conduct an exact test of independence, conditional on the observed marginal frequencies. Probably the best known test of this nature is Fisher's exact test of independence for 2 × 2 tables. However, The authors gratefully acknowledge helpful discussions with Professor John G. Saw which lead to the procedure for sampling the tables. Gratitude is also extended to the referees for their helpful comments and to the Northeast Regional Data Center at the University of Florida for computer support. Requests for reprints should be sent to James M. Boyett, Department of Statistics, Nuclear Sciences Center, University of Florida, Gainesville, Florida, 32611. 0033-3123/79/0300-0075500.75/0 © 1979 The Psychometric Society
75
76
PSYCHOMETRIKA
the same principle applies for any table size r × c and for whatever statistic is used to detect the condition listed in the alternative hypothesis. The approach is to 1. calculate the appropriate test statistic for every r × c array of non-negative integers having the same marginal frequencies as the observed table, 2. calculate the null probability of each table conditional on the marginal frequencies, 3. define the attained significance level to be the sum of the null probabilities of those tables which are at least as favorable to the alternative hypothesis (as measured by the test statistic) as the observed table. Let nu denote the frequency observed in the cell falling in the t~h row a n d j t~ column (1 ¼-~ will be sufficient for our purposes for any cL For example, if we desire to estimate a to within .01 with 99% confidence, we require M>_ ~
(2.576) = 16,589.44. .01
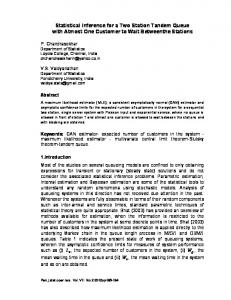
Thus, we see that M = 17,000 is more than sufficient to estimate o~ to within .01 with 99% confidence. Similarly, a sample of just M = 1700 tables is adequate to estimate a to within .02 with 90% confidence. These values of M lead to inexpensive analyses for tables where the magnitude tSI is so large that the exact analysis is not feasible. T o illustrate the approximate conditional test, we re-analyzed some tables for which exact conditional test results were reported by Agresti and Wackerly [1977] and K lotz and Teng [1977]. The exact chi-square test on Table 3 was reported by Agresti and Wackerly to yield a = .004. (To four decimal places, the level is .0038). Our approximate test yielded & = .0039 based on sampling 17,000 tables, and & = .0047 based on sampling n = 1700 tables. Alternate test statistics, such as the likelihood ratio statistic or a nominal measure
ALAN AGRESTI, DENNIS D. WACKERLY AND JAMES BOYETT
79
TABLE 3 Table Used to Illustrate Approximation of ~ in Exact Conditional Chi-square Test
10
1
6
3
5
0
5
0
1
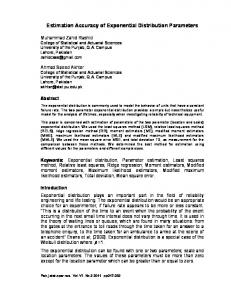
of association, could lead to different a and & values. In the examples we have studied though, these test criteria lead to very similar results. An exception to this is the FreemanHalton test, in which the tables are ordered (often in an anomalous manner) by their probabilities, rather than by an index of their deviations from the null hypothesis. Klotz and Teng reported a = .044055 for the exact Kruskal-Wallis test on Table 4, for which I SI = 32,194. Using the approximate test with 1700 tables, we obtained & = .042941. These k values are well within the limits of what would be expected due to sampling error. Of course, the most important application of the approximate test is to tables for which the exact test is impractical. We give such an application at the end of the next section.
3. Guideline For Implementation Of The Procedure In this section we develop some guidelines concerning when the approximation procedure should be used and the ease with which it can be applied in those situations. If the sample size is large enough in a particular table that an asymptotic test is clearly appropriate, then it is probably simplest to use it. For example, in testing for association between two nominal variances, the chi-square test of independence might be used if all the expected frequencies exceed five. On the other hand, if we doubt the appropriateness of the asymptotic test, but the exact conditional test seems feasible, we would use it. For example, if we wish to conclude the test within one minute of computer time (on a computer comparable to the IBM 370/165), we could use the exact conditional test when we are confident that IsI is less than about 100,000 for small tables and less than about 50,000 for larger tables (say with degrees of freedom exceeding ten). It is not simple to calculate t St exactly, a priori, in order to gauge whether an exact test can be economically implemented. In the general r × c case, no closed form expression is available for IS] as a function of the marginal frequencies. An upper bound for I S[ for TABLE 4 Table Used to Illustrate Approximation of ~ in Exact Conditional Kruskal-Wallis Test a
Response (ordered)
Group
A
B
C
D
1
i
4
2
5
2
1
9
3
1
3
4
6
3
0
aExact test conducted in Klotz and Teng [1977].
80
PSYCHOMETRIKA
various table dimensions and sample sizes is given by Agresti and Wackerly [1977] in their Table 5. Klotz and Teng [1977] gave a geometric method for evaluating IS]. However, this method itself could require considerable computer time. For example, they report that it took 17 seconds of CPU time on the UNIVAC 1110 to determine ISI for Table 1. Gail and Mantel [1977] obtained a recursive relationship which makes it possible to determine IsI through a procedure for which IsI is obtained iteratively for a sequence of submatrices of sizes 1 × c, 2 × c, .--, r × c. Their procedure also requires the use of a computer to obtain a solution, except for small tables with very small sample sizes. For the purpose of choosing between the exact and the approximate conditional tests, it is sufficient to calculate an approximation for ISI. Good [1976] conjectured an approximation for ISI of
IsI
~
1.3n4B rc~_~n~.n.]'
where
I-I ( m + n_,~:. c - 1 ) ~ ( n'j +n .~r - I B=
(n+ rc- l~ n
This approximation seems to perform well when the row or column marginal frequencies are equal. The ratio of IS[ to the approximation fell between .75 and 1.1 for all tables studied by Good in which the rows margins were equal. Another approximation to ISI was given by Gail and Mantel [1977], based on a Central Limit Theorem argument in which the vectors (n~l," • ", ntc-l), i = 1, . . . , r, are treated as independent. If the table is arranged so that r _> c, then their approximation is ISI ~ I ~
(n,.+c-I)]
2r~t--~t'~n'~-c,l
2-cl/2expl -
_
J
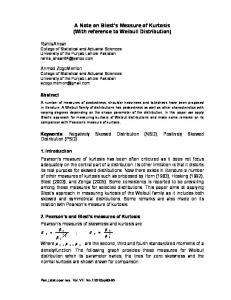
Gail & Mantel suggest that this approximation improves as r and the {n~.} increase in size. The results of utilizing these approximations on some tables for which IsI is known are presented in Table 5. In this table, we compare the Good and the Gail-Mantel approximations to IsI for Tables 1, 3, and 4 of this paper, and for the largest sample sizes for which the exact test was conducted by Agresti and Wackerly [1977], for various table dimensions with uniform marginal frequencies. In general, both approximations seem to be reasonably adequate with neither establishing a tendency to be more adequate than the other. Our experience has been that the approximations tend to be less accurate when the marginal frequencies are markedly non-uniform. In practice, we recommend that both of the above approximations for IsI be calculated and used to gauge the order of magnitude of IS I--whether IsI is in the thousands or hundreds of thousands, for example. If both approximations give values which make an exact test seem feasible (according to Table 5 of Agresti & Wackerty, 1977), then we suggest using an exact test. In most applications, use of Klotz and Teng's geometric construction or Gail and Mantel's recursive formulas for calculating the exact size of tsI would be unnecessary, since an indication of the relative magnitude of t St is sufficient for gauging the feasibility of the exact test. If we doubt the adequacy of the asymptotic approximation, and if the exact conditional test appears to be too time-consuming, then the approximation of the exact conditional significance level should be obtained. We investigated the degree of
12,798,781
14,242,526
6,956,153
Good approx.
Gall-Mantel approx.
56
Sample size
Isl
4x4
Table size
Table I
490
562
728
31
39,143
34,046
32,194
39
I 3x3 j' 3x4
Table 3 Table 4
941
958
884
I00
1 2x3
z
tn r-
>
c> Z >
82
PSYCHOMETRIKA
precision with which the attained significance level in the exact chi-square test of independence can be estimated on the Amdahl 470V/6 11 computer. Specifically, we observed the number of seconds of CPU time which is required to obtain an estimate of ~ using 17,000 random tables, for which P(t& - o~l < .01) > .99, for several different table dimensions and sample sizes. Special emphasis was given to arrays that cannot be easily handled using the exact test. Table 6 reports these results, for the cases in which all marginal frequencies are equal or within at most one of each other. These times include compiling time for the program as well as the time spent in the subroutine. In comparing the approximation procedure to the exact conditional test, two differences are suggested by Table 6. First, unlike the exact test, for a fixed sample size the approximation procedure is practically as feasible on a table of large dimensions as on one of small dimensions. This is because the same number of tables (17,000) is generated in either case for the approximation procedure, whereas IsI is dramatically larger for implementing the exact test on the larger table dimensions. Secondly, the CPU time is approximately linearly related to the sample size n in the approximation procedure, for fixed table dimensions. This is not surprising, since the number of operations required to generate each of the 17,000 tables is roughly proportional to the number of elements there are to be allocated to the cells of the table. For the exact test, on the other hand, ]S I blows up dramatically as n increases, for fixed table dimensions. In summary, comparing Table 6 to Table 5 in Agresti and Wackerly [1977], we see that the approximation procedure can in practice be used economically for those sample size-table dimensions combinations for which the exact test is impractical and the asymptotic test is questionable. Also, good estimates of a can be obtained in much less time than indicated in Table 6, if necessary. For example, P ( I & - o~l -< .02) > .90 if we generate 1700 tables, which takes roughly onetenth the CPU time indicated in that table. We mentioned in Section 1 that Table 1 could not be feasibly handled with the exact Kruskal-Wallis test, since ISI = 12,798,781. The evaluation of that table using the approximation procedure required 21.19 seconds of CPU time for generating 17,000 tables, and yielded & = .020. The corresponding approximation for 1700 tables required only 3.46 seconds, and yielded & = .024. TABLE 6 Amdahl 470V/6 II CPU Time for Approximating in the ExactChl-square Test of Independence Using 17,000 Tables
Table
Sample Size
Dimensions
20
30
2 x 7
10.58
14.14
3 x 4
10.08
4 × 4
i00
200
21.72
39.39
78.10
13.07
19.58
36.05
69.51
10.42
I 13.64
20.28
36.79
70.16
5 x 5
11.70
15.56
22.02
39.59
72.81
6 × 6
13.37
17.19
24.14
41.70
78.50
NOTE:
50
Tables on right of line cannot be evaluated in less than one m i n u ~ CPU time using the exact conditional test.
ALAN AGRESTI, DENNIS D. WACKERLY AND JAMES BOYETT
83
N o t e t h a t the values 17,000 a n d 1700 for the n u m b e r o f tables to be g e n e r a t e d are a c t u a l l y u p p e r b o u n d s for the n u m b e r o f tables r e q u i r e d to o b t a i n the desired accuracy. T h e s e q u a n t i t i e s were c a l c u l a t e d by using t h e w o r s t p o s s i b l e v a l u e for a , n a m e l y a = .50. If a is e x p e c t e d to b e closer to zero o r one, the a c t u a l n u m b e r o f tables r e q u i r e d will be s u b s t a n t i a l l y less t h a n these u p p e r b o u n d s . F u r t h e r savings in c o m p u t e r time c o u l d be a c c o m p l i s h e d by d o i n g the s a m p l i n g sequentially. F o r e x a m p l e , if it is necessary simply to distinguish w h e t h e r a < ,05 o r a > .05, the s a m p l i n g process is likely to be t e r m i n a t e d m o r e quickly unless a is close to .05, A l t h o u g h we have limited o u r discussion of exact c o n d i t i o n a l tests to analyses o f b i v a r i a t e cross-classifications, clearly the c o n c e p t o f estimating a t t a i n e d significance levels when a s y m p t o t i c a p p r o x i m a t i o n s are p o o r can be e x t e n d e d to o t h e r situations. In p a r t i c u lar, exact tests o f i n d e p e n d e n c e , o f no i n t e r a c t i o n o r o f no p a r t i a l association, are o f interest in m u l t i d i m e n s i o n a l cross-classification tables with small s a m p l e sizes. G a i l & M a n t e l ' s a p p r o x i m a t i o n for the n u m b e r o f 3 - d i m e n s i o n a l tables having a given set o f m a r g i n a l frequencies can be used to decide w h e t h e r the a - l e v e l s s h o u l d be e s t i m a t e d r a t h e r t h a n exactly calculated. A c o p y o f the F o r t r a n s u b r o u t i n e used for e s t i m a t i n g a t t a i n e d significance levels in the K r u s k a l - W a l l i s test a n d in the c h i - s q u a r e test o f i n d e p e n d e n c e is a v a i l a b l e f r o m the authors. REFERENCES Agresti, Alan, & Wackerly, Dennis. Some exact conditional tests of independence for r X c cross-classification tables. Psychometrika, 1977, 42, 111-125. Boyett, James M., & Shuster, J. J. Nonparametric one-sided tests in multivariate analysis with medical applications. Journal of the American Statistical Association. 1977, 72, 665-668. Fisher, R. A., The design of experiments (9th ed.) New York: Hafner Press, 1977. Forsythe, Alan B., & Frey, H. S. Tests of significance from survival data. Computers and Biomedical Research, 1970, 3, 124--132. Freeman, G. H., & Halton, J. H. Note on an exact treatment of contingency, goodness of fit and other problems of significance. Biometrika, 1951, 38, 141-149. Gail, M., & Mantel, N. Counting the number of r X c contingency tables with fixed margins. Journal of the American Statistical Association, 1977, 72, 859-862. Good, I. J. On the application of symmetric dirichlet distributions and their mixtures to contingency tables. The Annals of Statistics. 1976, 4, 1159-1189. Klotz, Jerome, & Teng, James. One-way layout for counts and the exact enumeration of the Kruskal-Wallis H distribution with ties. Journal of the American Statistical Association, 1977, 72. 165-169. Kolata, Gina Bari. Mathematical proofs: The genesis of reasonable doubt. Science, 1976, 192, June 4, 989-990. Lehmann, E. Nonparametrics: Statistical methods based on ranks. San Francisco: Holden-Day Inc., 1975. Wackerly, D. D., McClave, J. T., & Rao, P. V. Measuring nominal scale agreement between a judge and a known standard. Psychometrika, 1978, 43, 213-223. Manuscript received 2/24/78 Final version received 7/3/78