Schematic illustrations of the six task of the reaction time decomposition approach for the visual stimulus modality. 274 ... anova design corresponding to the one used for the cognitive ..... and J. Requin (Eds) Tutorials in Motor Behaviour.
J. Sleep Res. (2008) 17, 271–280
Sleep disordered breathing
doi: 10.1111/j.1365-2869.2008.00660.x
Executive functions and cognitive subprocesses in patients with obstructive sleep apnoea STEFANIE LIS1, STEPHAN KRIEGER1, DOROTHEE HENNIG1, C H R I S T I A N R O¨ D E R 2 , P E T E R K I R S C H 1 , W E R N E R S E E G E R 3 , B E R N D G A L L H O F E R 1 and R I C H A R D S C H U L Z 3 1 Department of Psychiatry, Justus-Liebig University Giessen, Giessen, Germany, 2Department of Psychiatry, Erasmus MC Rotterdam, Rotterdam, The Netherlands and 3Department of Internal Medicine, Justus-Liebig University Giessen, Giessen, Germany
Accepted in revised form 4 March 2008; received 11 September 2007
SUMMARY
In recent years, special interest has been focused on impairments of executive functions in patients with obstructive sleep apnoea syndrome (OSAS). However, the majority of studies have not clearly separated deficits in executive functions from impairments in other cognitive processes involved in task solving. In the present study, working memory (WM) functions of 20 patients with OSAS were compared with those of 10 age-, sex- and education-matched healthy subjects. Cognitive functions were measured four times a day; each of these measurements was accompanied by an assessment of subjective and objective daytime sleepiness. To separate dysfunctions of WM from those of additionally involved processes, n-back tasks were applied embedded in a reactiontime-decomposition approach. Deficits in n-back tasks could be observed in OSAS patients in accuracy and reaction times. However, the slowing could already be observed in simple reaction time tasks. The drop in 1-back accuracy in the morning was related to daytime sleepiness. During the afternoon, accuracy of OSAS patients dropped in 2-back tasks, an effect which correlated neither with sleepiness nor with the extent of sleep apnoea or oxygen desaturation. In conclusion, our data reflect a complex perspective upon cognitive deficits in OSAS. Cross-group differences in processing time on the higher level WM task appeared to be attributable to slowing at a more elementary cognitive processing level. In contrast, reduced accuracy during the WM task in the OSAS group could not be explained by deficits in more elementary cognitive processes. k e y w o r d s cognition, daytime sleepiness, executive function, obstructive sleep apnoea, working memory
INTRODUCTION The existence of cognitive impairments in patients with obstructive sleep apnoea syndrome (OSAS) is well established. Nevertheless, there is still an ongoing debate about the exact nature of the cognitive dysfunction underlying the impairments observable in various psychological and neuropsychological test procedures (Fulda and Schulz, 2003; Verstraeten, 2007). It is also unclear to which extent performance deficits Correspondence: Dr. Stefanie Lis, Centre for Psychiatry, Justus-LiebigUniversity Giessen, Am Steg22, 35385 Giessen, Germany. Tel.: 0049641-9945775; fax: 0049-641-9945789; e-mail: Stefanie.Lis@ psychiat.med.uni-giessen.de � 2008 European Sleep Research Society
can be linked to daytime sleepiness caused by chronically fragmented sleep or to recurrent hypoxaemia caused by nocturnal apnoea episodes. The purpose of the present study is to help determine the specific cognitive processes impaired in OSAS patients and to contribute to the understanding of the factors that influence these deficits. Impaired performance in OSAS patients has been reported in tests of various cognitive functions such as attention ⁄ vigilance, memory, psychomotor performance and executive functioning (Aloia et al., 2004). In recent years, special interest has focussed on impairments of executive functions because of their connection to prefrontal cortex (PFC) activity (Beebe and Gozal, 2002; Saunamaki and Jehkonen, 2007). The PFC is a
271
272
S. Lis et al.
brain area that may be especially affected by chemical and structural central nervous system cellular injury resulting from sleep disruption and blood gas abnormalities and known to prevent sleep-related restorative processes. Results of studies on executive functioning in OSAS are heterogeneous, i.e. some of these studies here suggested executive dysfunction (Bedard et al., 1991; Feuerstein et al., 1997; Naegele et al., 1995) whereas others have not (Kim et al., 1997; Lee et al., 1999; Redline et al., 1997; Verstraeten et al., 2004). In many studies which indicate executive dysfunctions, performance deficits are reported not only in executive tests but in all examined cognitive abilities, i.e. in all test procedures applied (e.g. Bedard et al., 1991; Feuerstein et al., 1997; Naegele et al., 1995). This could be interpreted as a global cognitive impairment which affects all domains of cognitive functioning. Alternatively, it might point to a selectively disturbed more elementary cognitive subfunction involved in all test procedures. Which of these alternative interpretations is correct is difficult to determine because most of the usually applied (neuro-) psychometric tests have been developed primarily to discriminate between subjects. They do not allow an estimation of the relative contribution of single cognitive functions to the total outcome. Therefore, they are not suited to identify the dysfunction of a single cognitive function as the cause underlying the impaired performance related to a specific disorder (Krieger et al., 2001). It also holds true for the usage of test batteries that measure different cognitive functions by using different tests. Generally, these tests differ not only in regard to their target function but also with respect to difficulty, reliability and additionally involved cognitive subfunctions. This limits the validity of direct comparisons of performance levels across subtests (see Chapman and Chapman, 1978; Goldberg and Gold, 1995). Only few tests exist which try to isolate different functions, e.g. the Digit Span Test (see Verstraeten and Cluydts, 2004). When these were applied, no disturbance of executive functions in OSAS patients could be observed (Verstraeten et al., 2004). Because of these methodological problems, Beebe and Gozal (2002) emphasized in the Journal of Sleep Research that Ôstrong research in this area involves dissociating effects on executive function tests (which are expected to be significant) from those obtained on tests of more basic skills (which are expected to be negligible)’ (page 6). A method meeting this requirement is the subtraction method first introduced by Donders (1868). It involves a series of measurement arrangements. Each setting differs from a companion setting only in that it requires one additional cognitive process for task solving. It is assumed that each subprocess requires time and thus increases processing time. This permits an estimation of the time demands of the additionally involved process by simply subtracting the reaction times (RTs) between pairs of tasks. This RT decomposition approach is based upon the assumption of the existence of discrete and distinguishable subprocesses within a serial structure of processing. Although this assumption has led to criticism by some authors in the past, this model emerged as a
parsimonious and heuristically useful approach towards cognitive processing and the identification of selectively disturbed cognitive subfunctions e.g. in psychiatric disorders (Krieger et al., 2001, 2005). The first aim of the present study was to prove whether this approach might contribute to the understanding of executive dysfunctions in OSAS. For this purpose, working memory (WM) processes as an example for one domain of executive functions were investigated with n-back tasks (Gevins et al., 1990; Verstraeten and Cluydts, 2004). The n-back tasks require subjects to compare the present stimulus with the one presented n-stimuli back. They are assumed to involve WM functions by maintaining stimulus information until the response can be executed and allow for a parametric modulation of WM load by increasing n. Thereby, demands upon maintaining, monitoring and updating the WM buffer, i.e. holding the temporal structure of the task relevant information online, increase. The n-back WM paradigm has in recent years emerged as one of the most highly used methods to study the pathophysiology of WM dysfunction in psychiatric disorders like schizophrenia (Glahn et al., 2005). The involvement of dorsolateral PFC area was shown in several brain imaging studies (Owen et al., 2005). We embedded n-back tasks in a RT decomposition approach to allow the differentiation of deficits in WM from those in elementary cognitive subprocesses such as sensory transduction, pattern integration, stimulus discrimination and response selection as well as motor preparation and execution (Massaro, 1990; Sanders, 1980). If cognitive dysfunctions in OSAS patients can be attributed to WM deficits, a poorer performance relative to controls is expected on n-back tasks compared with control tasks which do not require WM processes for task solving. Statistically, this should become obvious in variance analytical approaches as interaction effects involving the factors ÔgroupÕ (i.e. OSAS patients and control subjects) and Ôtype of taskÕ (i.e. tasks requiring ⁄ not requiring WM functions) (see Krieger et al., 2001; Verstraeten, 2007). An increase of WM demands is expected to lead to an accentuation of the performance deficit in OSAS patients compared with healthy subjects. The second aim of the study was to analyse whether performance deficits of OSAS patients can be linked to increased daytime sleepiness. Most studies analysing the relationship between daytime sleepiness and cognitive alterations in OSAS assess sleepiness by use of questionnaires like the Stanford Sleepiness Scale (SSS, Hoddes et al., 1972) or the Epworth Sleepiness Scale (Johns, 1991). It has however also been shown that subjective sleepiness is only modestly correlated with objective state sleepiness as measured by the Multiple Sleep Latency Test (MSLT) or the Maintenance of Wakefulness Test (Banks et al., 2004; Sangal et al., 1999). We therefore assessed cognitive functioning not only together with a measure of subjective sleepiness but added an MSLT as measure of objective sleepiness. As it is known that sleepiness as well as cognitive functioning show circadian variations (Blatter et al., 2005), we measured cognitive functions at � 2008 European Sleep Research Society, J. Sleep Res., 17, 271–280
Executive functions in OSAS different times of the day to assess whether changes in sleepiness were accompanied by changes in cognitive performance.
METHODS Subjects Twenty patients (19 males, 1 female) with OSAS were recruited for the study. All of them had been consecutively admitted to the sleep laboratory of the Medical Clinic II of the Justus Liebig University Hospital Giessen, Germany and had been investigated by full-night attended polysomnography (PSG). All data were visually analysed according to standard criteria. OSAS was diagnosed if the respiratory disturbance index (RDI) exceeded 10 per hour of sleep in the presence of sleeprelated symptoms (i.e. snoring, witnessed apnoeas, excessive daytime sleepiness). Mean RDI was 57.9 (± 20.2) and mean nocturnal oxygen saturation was 91.3 ± 3.6. They had no other diagnosable sleep disorder and had no previous treatment for sleep apnoea syndrome. Mean age of the patients was 53.4 ± 10.5 years. Ten healthy subjects (8 male, 2 female) were recruited as control group. Sleep disorders were excluded by means of a PSG. Mean age of the healthy controls (HC) was comparable with the age of the patients group (53.6 ± 10.5 years, independent t-test: t = 0.04, P = 0.969). Both groups were matched for education. All subjects were right-handed (Annett, 1967). All participants gave informed consent prior to participating in the study. Experimental procedure Cognitive testing was performed together with an MSLT at the day following diagnostic PSG. For this purpose, subjects spent 1 day in the sleep laboratory of the Psychiatric University Hospital of Justus-Liebig-University. They had to solve a set of cognitive tasks at four time-points (at 10:00, 12:00, 15:00 and 17:00 hours). Each performance was followed by a nap following standard MSLT procedures (Carskadon et al., 1986). Stimuli and responses Each of the four cognitive testing sessions consisted of a set of six tasks. In two sessions, visual stimuli were used, while in the other sessions acoustical stimuli were presented. Visual as well as acoustical stimuli were applied because modality of input is assumed to affect WM processes (Baddeley, 1986). A recent study confirmed that modality of input affects WM network configurations not only regarding sensory cortices but including PFC area already in simple WM tasks (Protzner and McIntosh, 2007). Stimulus modality was pseudo-randomly assigned to the four time-points of testing, i.e. each was administered one time in the morning sessions (10:00 or 12:00 hours) and another time in the afternoon sessions (15:00 or 17:00 hours). � 2008 European Sleep Research Society, J. Sleep Res., 17, 271–280
273
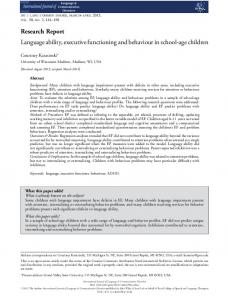
In each task, two stimulus types were presented in pseudo random order. A total of 60 stimuli were presented with 50% probability of occurrence for each stimulus type. Visual stimulus types were triangles and squares. These were presented on a computer screen (screen size: 17¢, stimulus duration: 50 ms). As acoustical stimulus types high (800 Hz) and low (1200 Hz) tones were applied through earphones. Subjects were seated in a comfortable chair in front of a computer screen. In all tasks, they had to indicate their response by moving a cursor as fast as possible from a starting button to a corresponding target button using pen movements on a graphic tablet. The starting button and target buttons were displayed on the computer screen. Trials were self-paced with subjects signalling the start of a trial by positioning the cursor at the starting button. Responses had to be initiated within 4 s after stimulus onset; slower RTs were processed as errors. Mean trial duration was 4870 ms (± 630 ms) with a mean interval of 3980 ms (± 495 ms) between response and subsequent stimulus. Cognitive tasks To assess WM functions, n-back tasks were used with two versions of WM load (1-back, 2-back). They were presented within a hierarchy of tasks with increasing processing demands (Donders, 1868; Krieger et al., 2001), i.e. together with a simple reaction task (SRT), a stimulus discrimination task (SDT), a choice reaction task (CRT) and a vigilance version of the CRT (CRT-vig). All tasks were presented at random order. Figure 1 gives a schematic illustration of the six types of tasks applied. In the SRT, subjects had to guide the cursor immediately after stimulus presentation towards the target button. This task measures the four elementary cognitive subprocesses: sensory transduction, pattern integration, motor preparation and motor execution (Sanders, 1980). In the SDT, subjects were asked to respond to one stimulus type but to ignore the other, which required a discrimination process to differentiate between the two stimuli types. In the CRT, two buttons were presented. They were labelled ÔtriangleÕ and ÔsquareÕ for visual stimuli and ÔhighÕ and ÔlowÕ for acoustical stimuli. The stimulus determined the target button. Here, a response selection stage became essential (Massaro, 1990). The CRT-Vig equalled the CRT with the exception of altered probabilities for the two stimulus types: triangles and high tones were presented with 15% probability, squares and low tones with 85% probability. In the n-back-task, the two target buttons were labelled ÔsameÕ and ÔdifferentÕ, requiring subjects to compare the stimulus presented either 1-trial (1-back) or 2-trials (2-back) back with the currently presented one. Same and different judgements were required with equal probability. The n-back task is assumed to involve WM functions. With increasing n the WM load is increased.
274
S. Lis et al.
Trial 1
Trial 2
Trial 3
Trial 4
Trial 5
SRT React to all stimuli
SDT React to triangles only
CRT React to triangles with „triangle“, to squares with „square“
Triangle Square
Triangle Square
Triangle Square
Triangle Square
Triangle Square
Triangle Square
Triangle Square
Triangle Square
Triangle Square
Triangle Square
different same
different same
CRT-vig React to triangles with „triangle“, to squares with „square“
1-back task Compare the current stimulus with that presented 1-back
different same
different same
different same
2-back task Compare the current stimulus with that presented 2-back
different same
different same
different same
different same
different same
Figure 1. Schematic illustrations of the six task of the reaction time decomposition approach for the visual stimulus modality.
Measurement variables and statistical analysis
determined and used in further analysis. To avoid confounding RT measures with error recovery and escape strategies, only correct responses were analysed. A 2 · 2 · 2 · 6 anova with the independent factor ÔgroupÕ (ÔOSASÕ, ÔHCÕ) and the repeated measurement factors Ôtime of cognitive testingÕ (ÔmorningÕ, ÔafternoonÕ), ÔmodalityÕ (visual, acoustical stimuli) and ÔtaskÕ (SRT, SDT, CRT, CRT-vig, 1back, 2-back) was conducted to analyse each of the dependent variables. The degrees of freedom in the anova were corrected according to Greenhouse and Geisser (1959). When appropriate, post hoc t-tests (two-tailed) were applied. Because of the explorative character of the study, no adjustment of the alpha level was carried out to avoid inflation of type II error.
Cognitive performance Dependent variables were the percentage of correct responses in each task as well as the RT (time from stimulus onset until reaching the target button, time resolution 5 ms). For each subject and task the median of the RT distribution was
Sleepiness Dependent variables were the score of the SSS for subjective sleepiness and the sleep onset latency in the MSLT for objective sleepiness. Sleep onset latency was defined as the elapsed time from light-out to the first epoch scored as sleep.
Subjective and objective sleepiness After each cognitive testing session, sleepiness was assessed. Subjects rated their subjective sleepiness by means of the SSS. This was immediately followed by a maximum 20 min standard PSG recording to assess objective sleepiness. Subjects lay down in a darkened room and were instructed to fall asleep as fast as possible. The recording was terminated 20 min after lights-out if there did not occur sleep, or after three consecutive epochs of stage 1 sleep or after the first epoch of another sleep stage.
� 2008 European Sleep Research Society, J. Sleep Res., 17, 271–280
Executive functions in OSAS Online staging of the PSG recordings were confirmed by an experienced psychologist who was blind for group and time of measurement. A first statistical analysis was performed separately for SSS and sleep onset latency with a 2 · 4 anova with the independent factor ÔgroupÕ (ÔOSASÕ, ÔHCÕ) and the repeated measurement factors Ôtime of sleepiness ratingÕ (10:00, 12:00, 15:00 and 17:00 hours) to analyse differences in sleepiness between groups over the day. The degrees of freedom in the anova were corrected according to Greenhouse & Geisser. To analyse differences in individual sleepiness at the time of the cognitive testing, the single sleepiness scores were assigned to each of the cognitive testing sessions and analysed with an anova design corresponding to the one used for the cognitive performance, i.e. a 2 · 2 · 2 · 6 anova. Relation between cognitive performance, sleepiness and OSAS characteristics Interdependence between cognitive performance and sleepiness was analysed using PearsonÕs correlation coefficient. Sleepiness parameters were used as covariates in the anova design, respectively, subdesigns to test whether group differences go beyond effects that can be explained by differences in subjective and ⁄ or objective sleepiness scores. To investigate whether alterations in cognitive processing of OSAS patients could be linked to RDI or hypoxaemia, SpearmanÕs rank-order correlation was calculated between RDI and mean oxygen saturation and those cognitive parameters that show alterations in OSAS patientsÕ performance.
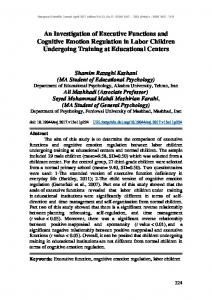
Figure 2 depicts subjective and objective sleepiness for four times of the day. No differences in SSS score emerged between OSAS patients and their HC. In contrast, sleep onset latencies in MSLT were shorter in OSAS patients than in HC (ÔgroupÕ: F(1,28) = 5.09, P = 0.032). Although the extent of this difference between groups seemed to depend on the time of day with the most pronounced difference at 12:00 hours, this could not be confirmed statistically [interaction ÔgroupÕ · Ôtime of dayÕ; F(2,64) = 1.54, P = 0.220]. When sleepiness was related to the single measurements of cognitive performance, significant differences between groups emerged neither for the SSS score nor for the sleep onset latencies that depended on whether they are visual or acoustical stimuli were presented (Fig. 3). For both groups, sleep onset latencies were increased in the afternoon compared with the morning measurements [time: F(1,28) = 4.17, P = 0.05]. Cognitive testing Results of the statistical analysis are given for both accuracy of task solving and RTs in Table 1. � 2008 European Sleep Research Society, J. Sleep Res., 17, 271–280
SSS
(a) 5
4
3
2
1 10 Healthy controls 20 OSAS 0 10 am (b)
min
RESULTS Subjective and objective sleepiness
275
20 19 18 17 16 15 14 13 12 11 10 9 8 7 6 5 4 3 2 1 0
12 am
3 pm
5 pm
Time
5 pm
Time
Sleep onset latency (MSLT)
10 am
12 am
3 pm
Figure 2. Mean and SE of daytime sleepiness for obstructive sleep apnoea syndrome patients and their healthy controls over the day. a) Subjective sleepiness (Stanford Sleepiness Scale score). b) Objective sleepiness (sleep onset latency in multiple sleep latency test).
Accuracy of task solving Obstructive sleep apnoea syndrome patients showed a lower accuracy depending on type of task and time of day (Fig. 4, time · task · group; F = 4.62, P = 0.009); accuracy only decreased when WM processes were required to solve the
276
S. Lis et al.
Table 1 Results of the 2 · 2 · 2 · 6 anova for percentage of correct solutions and reaction times % Correct F
d.f.
Reaction time P
F
d.f. P
Group 2.16 1, 28 0.153 4.83 1.28 0.036 Stimulus modality 0.78 1, 28 0.384 3.81 1.28 0.061 (mod) Mod · group 1.39 1, 28 0.248 0.95 1.28 0.337 Time 0.71 1, 28 0.405 7.53 1.28 0.010 Time · group 0.84 1, 28 0.774 0.12 1.28 0.733 Task 95.20 2, 63