The sensor data output is often in a raw, proprietary or ... sports men and women are monitored to determine the effects of various train- ... Many different systems exist to test cyclists ... As cyclists are ever concerned with gaining a competitive edge, a system ... which our system was deployed and provides an overview of the ...
Expanding Sensor Networks to Automate Knowledge Acquisition? Kenneth Conroy1 , Gregory May1 , Mark Roantree2 , and Giles Warrington1 1 2
CLARITY: Centre for Sensor Web Technologies, Dublin City University Interoperable Systems Group, School of Computing, Dublin City University, Glasnevin, Dublin 9, Ireland
Abstract. The availability of accurate, low-cost sensors to scientists has resulted in widespread deployment in a variety of sporting and health environments. The sensor data output is often in a raw, proprietary or unstructured format. As a result, it is often difficult to query multiple sensors for complex properties or actions. In our research, we deploy a heterogeneous sensor network to detect the various biological and physiological properties in athletes during training activities. The goal for exercise physiologists is to quickly identify key intervals in exercise such as moments of stress or fatigue. This is not currently possible because of low level sensors and a lack of query language support. Thus, our motivation is to expand the sensor network with a contextual layer that enriches raw sensor data, so that it can be exploited by a high level query language. To achieve this, the domain expert specifies events in a tradiational event-condition-action format to deliver the required contextual enrichment.
1
Introduction
Many new applications employ sensors or networks of sensors to automatically monitor and generate reports and analysis across domains. Increasingly, elite sports men and women are monitored to determine the effects of various training sessions on their bodies. Multiple hetrogeneous sensors are often deployed to discover physiological or biological information generated during the activity. As these sensors generate output in unstandardised and proprietary formats, examining it to identify key events or properties involves time consuming examination of multiple files. Manual alignment, integration and the application of context from which this data was gathered is required to aid with querying the information. These issues can be demonstrated by examining a sport such as cycling. Laboratory based cycling experiments attempt to quantify certain aspects of the effect of cycling on the participant. This is facilitated by gathering data such as power output (a measure of work created by the cyclist in order to overcome the forces against them, such as gradient, drag, etc.), cadence (a measure of the ?
This work is supported by Science Foundation Ireland under grant 07/CE/I1147
2
Kenneth Conroy, Gregory May, Mark Roantree, and Giles Warrington
number of times a pedal revolution is performed per minute) and heart rate, among other factors. By measuring these in a laboratory based environment, it is possible to generate a dataset that can be specific to the question being asked by researchers and free of external artefacts. Many different systems exist to test cyclists under laboratory conditions while attempting to recreate the specific demands of cycling, with each cycling ergometer (a machine designed to replicate cycling in a measurable and repeatable manner) generating and measuring its resistive force in a different manner. However, this can lead to significant differences between ergometers. For the purpose of reliability in testing, an athlete must repeat tests on the same ergometer, under the same environmental conditions, and in the same training state. This will not eliminate all the changes from test to test, but will reduce the error from testing on dissimilar systems. Scientists tend to prefer field-testing rather than laboratory testing, as it provides additional environmental factors which can effect performance. However, field tests for absolute physiological values tend to be less exact than laboratory based tests and are logistically more difficult to perform. Depending on the activity, there are many different factors that can predict eventual performance during the event. These predictors can be physiological, environmental, or equipment specific. Measurement of physiological factors is generally done via heart rate monitoring, power output measurement, respiration, and psychological scales. The information gained on physiological performance factors can give insight into how an athlete is performing during the training session, race, or event in which they are partaking. Over repeat measures it can be possible to track changes in performance and fitness of the athlete. By sensing physiological, environmental, and equipment changes and how they affect each other we are able to get a greater understanding of the changes that are occurring in both racing and training. This can potentially allow the development of targeted training sessions to investigate aspects of race performance. 1.1
Motivation
Over the past decade cycling has undergone a surge in technology aimed at the measurement and analysis of training and racing. Due to its repetitive and prolonged nature, it is possible to measure many factors during cycling once a sensor is available to monitor the variable required. Technological advances have allowed sensors and computers to reduce in size and weight dramatically bringing previously laboratory based tools to the general market. Technologies such as power measuring and GPS systems are now light enough for competitive cyclists to apply them on their bicycles. Although some of these systems integrate several sensors with one unit, many do not. This generates a problem when several different sensor sets are needed to determine the information needs described above. As cyclists are ever concerned with gaining a competitive edge, a system that will allow them to combine and investigate the data gathered from several sources is crucial to cyclists, their coach, and the scientists who can interpret the data. Thus, the goal is to provide a means of facilitating high level queries across all of these low level devices.
Expanding Sensor Networks to Automate Knowledge Acquisition
1.2
3
Contribution
In simple terms, data can be queried if we develop a protocol to transfer it into a relational database or encode the data in XML. However, through working with both exercise physiologists and cyclists, we discovered that their information needs could not be met (queries could not be expressed) with a process of supplying structure and low level semantics to sensor data. Instead, a more complex layer of contextual enrichment was required to prepare sensor data for high level query languages. Furthermore, this contextual enrichment must be specified by end users and not by computer scientists. In this paper, we present a framework and methodology for automated processing of sensor data so that it can be queried using a standard query language. While this method uses XML to provide the structre for sensor data, it is the end user (domain expert) who can add semantics to the data through the specification of data mining rules. By working closely with end user scientists, we evalute our system by meeting the information needs of the end user, allowing them to specify how data repositories are enriched with context data, and by reducing the query execution times as a result of the contextual enrichment process. 1.3
Structure
The structure of the paper is as follows: §2 introduces cycling, the domain in which our system was deployed and provides an overview of the EventSense system architecture, with the Context Profiles explored in detail in §3. §4 details our experimental evaluation and results, and in §5 we present related research. §6 details our conclusion and our current work.
2
User Requirements and Operating Architecture
In this section, we present the user requirements in the form of a query set, defined by the end users. Queries 1 to 5 in Table 1 can be expressed using XQuery but the remaining queries are more complex, difficult to express and may require long calculation times. We will then describe the architecture used enable the exercise physiologists to extract the required information. In general, the system must collect data from several independent sources, synchronise the data, and structure the data in some manner. It must also provide a facility for defining and applying event rules specific to a particular domain. In Table 1, this includes the hill classification, and complex accelerometer based algorithms for pedal cadence/vector/force and braking activity. The system needs to work in a context driven environment where the user can specify if the data comes from a training session, race, or the laboratory. 2.1
The EventSense Architecture
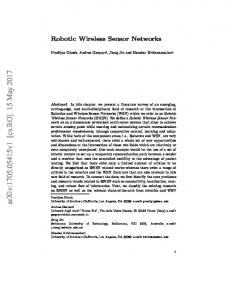
Figure 1 illustrates the architecture of our proposed solution to sensor data management. The remainder of this section details the individual processors
4
Kenneth Conroy, Gregory May, Mark Roantree, and Giles Warrington
1. 2. 3. 4. 5. 6. 7. 8. 9. 10.
Queries Find total amount of time spent above 250W (Power-measuring) Find Heart Rate for each occurrence above 250W (Power-measuring) Find total amount of time spent above 165BPM (Heart rate-measuring) Calculate average heart rate spent above 200W Find the total amount of time where pedal pivot = ’pivot range 1’ Find ’best intervals’ for highest ’1minute’ heart rate and return values for distance covered Find the average performance factors (Power/Heart Rate/Speed) for each gradient of type=’hill’ Find the average Power value when pedal vector magnitude =’peak’ Find the average speed when braking activity = ’none’ Find all occurences where gradient profile = ’flat’ and cycle cadence =’cadence range 1’ Table 1. Sample Query Set
involved to close the gap between the requirements of the domain expert and the initial format of the sensors output. These processors are discussed briefly and in the following section, we discuss Contextual Enrichment in greater detail - as this is the main focus of the paper.
Query Processing Component
Query/Event API
Integrated Data
Sensor Data
Integrate Context Repository
Contextual Enrichment
Enablement
Data Management Component
MetadataComponent
Hardware Component
Fig. 1. EventSense System Architecture
Sensor Enablement. Sensors output data in a simple plaintext format. The common approach to analysing data requires considerable manual effort using spreadsheet tools to compare results across multiple sensor files. The common approach to automation is to build proprietary wrappers for every sensor to store data in a database format. This requires new wrappers for new sensors
Expanding Sensor Networks to Automate Knowledge Acquisition
5
and database reengineering each time the structure of the output differs. Sensor Enablement is a form of structural enrichment whereby we convert all sensor data to a standard XML format using simple user defined templates. One can define how sensor output should be interpreted and structured using sensor profiles, and automatically apply data transformations based on this information. The role of the Sensor Enablement processor is to generate machine queryable XML files. Contextual Enrichment. Following Sensor Enablement, basic queries can be performed using XQuery. However, many of the queries listed in Table 1 cannot be expressed at this point as the data lacks the necessary semantics. To reduce this semantic gap, the system uses Participant and Activity Profiles to understand the deployment domain (or activity), the sensors, participants, and key events. Essentially, these are metadata constructs used to describe any object or person measured by the sensor. In the following section, we describe how the specification of event detection definitions can mine for the information necessary to end user queries. Integration. The querying needs of the coaches and sports scientists are extensive, ranging from basic sensor analysis and comparison to anthropometric based analysis of participants with multiple sensors deployed while engaged in some activity. Some information such as sensor data is extensive and specific to a certain time span, or geographic location whereas much physiological or biological data rarely changes. In general, a single sensor cannot meet information needs and multiple sources of evidence must be integrated to provide both results and highs levels of accuracy. For the current experiments used in this paper, sensors were manually synchronised and this processor was not used. However, analysis of sporting events is often chaotic and synchronisation of inexpensive sensors devices cannot be guaranteed. Thus, integration is an important part of current work. Query Interface. As all the sensor data is converted to XML during sensor enrichment, queries can be expressed in XQuery or XPath. As neither of these languages are intuitive to non-computing users, a view based system is currently employed [5] which also offers optimisation features for high volume datasets. However, Contextual Enrichment is an important enabler for query processing as will be shown in the next section.
3
Context Profiles and Event Mining
Context Profiles provide genericity to the system and thus, facilitate heterogeneity. Individuals will have different physiological characteristics, activities will have different timings, layouts and formats, and sensors will come and go, bringing new information and heterogenous structures. The activity in which
6
Kenneth Conroy, Gregory May, Mark Roantree, and Giles Warrington
participants are being measured provides the widest range of heterogeneities. For this reason, it receives a more detailed discussion here, including how it can be used to extract new knoweldge from the sensor database, that can later be exploited by the query processor. All profiles and function descriptions (discussed later) are stored in the System Repository. 3.1
Sensor, Activity and Participant Profiles
These three profiles are similar in nature. The sensor Profile allows for different sensors to be introducted at any point, providing their output is described using a template. The Activity Profile defines the activity or domain in which a set of sensors were deployed. Some of this information is standard for each activity, such as the start time, the sport involved and the list of sensors deployed. In addition, the Activity Profile defines the key elements of a deployment that are relevant for that sport and particular deployment. The Participant Profile provides the anthropometric data valid for a user at the time of deployment. There can be many participants, each with their own profile, in an activity. 3.2
Event Definition
The key componant of contextual enrichment are the Event Definitions. These enable the end user to highlight important events during exercise activity given the domain algorithms required for a certain set of sensor data. These algorithms are defined by the end users. The Event Definition uses the traditional eventcondition-action format with a sample event is shown in Example 1. The key elements are the Event, which has Condition and Action sub-elements. There may be multiple Condition elements joined by logical operators and any number of update Action elements. Example 1. Terrain Classification UPDATE WITH
Expanding Sensor Networks to Automate Knowledge Acquisition
7
UPDATE WITH UPDATE WITH ...
In Example 1, the terrain corresponding to the GPS ranges are known to be steep climb sections of a race or training session. A logical OR operator ties two ranges of GPS values satisfying the steep climb criteria. There are two ranges because the race or training session has taken place where the steep climb is not always in the same direction geographically, and the GPS values do not uniformally increase or decrease. It is standard practise for cycling based domain experts to split the climb into two or more segments to allow this definition. If the GPS sensor values for latitude and longitude match the criteria in the condition, a element is encoded within the element of the sensor data file, as specified by the action. Example 2. Vector Magnitude Classification UPDATE UPDATE UPDATE UPDATE
WITH WITH &result
WITH WITH &result
8
Kenneth Conroy, Gregory May, Mark Roantree, and Giles Warrington
UPDATE WITH UPDATE WITH &result
It is also necessary to support the use of functions to explicitly define complex algorithms, the results of which can be used as part of the condition. Example 2 shows the result of a function FnVectorMagnitude (which detects the direction and force of the power produced by the cyclist, allowing for the detection of the part of the pedal stroke at a given point in time) being used as part of the condition. In effect, we treat the output from the sensor and function in an identical manner. We support operators EQ, LT (less-than), GT, GE (greaterthan-or-equal-to) and GT. The action is always an update of a sensor data file. A simple user interface to define events means that the user is only required is to select from the list of sensors or functions; the relevant properties, decide on the criteria for satisfying an occurance of an event, and define what to update. Functions allow advanced algorithms to be applied which could not have been applied using XQuery alone.
4
Experiments and Evaluation
Experiments were run on identical servers with a 2.66GHz Intel Core2 Duo CPU and 4GB of RAM. The aim of the experiments is to compare query times on the contextually enriched data with equivalent queries on data which is only structurally enriched. We also measure the time taken for the once-off contextual enrichment, and illustrate the comparitive ease of querying for the encoded domain events. Size
Values Enabled Enriched Result Size
1 wickm.xml (Strong Cadence)
Filename (Event)
3MB
17,798
178ms
82ms
2,111
2 raim.xml (Strong Cadence)
30MB 65,536
399ms
150ms
7,631
17,798
n/a
104ms
5,652
4 raim.xml (Low Vector Magnitude)
30MB 65,536
n/a
374ms
29,490
5 wickgps.xml (Steep Climb Terrain)
150kb 655
77ms
75ms
49
3 wickm.xml (Low Vector Magnitude) 3MB
Table 2. Sample Event Detection Execution times
A summary of the experiments is presented in Table 2. Two accelerometer sensor data files were queried to detect all occurences of a low vector magnitude, and all occurences of a strong cadence. This was performed twice to detect the
Expanding Sensor Networks to Automate Knowledge Acquisition
9
cadence, once on the enabled data, where the cadence requirement is included as part of an XQuery expression, and secondly the query is performed following contextual enrichment, using a simple XQuery expression to detect occurences of a strong cadence. Due to its complex nature, the algorithm for Vector Magnitude cannot be queried using XQuery and thus, the query for low vector magnitude was performed on the contextually enriched data only. We chose two files to query, one hour-long file representing the accelerometer deployed in an hour long mountainous time trial (wickm), the second has values from an 18-hour long ultra endurance race. As shown in the table, the query time for detecting cadence is significantly reduced for the contextually enriched data. Of the 17,798 entries in wickm.xml, 2,111 matched the criteria of a strong cadence. In the larger raim.xml file, 7,631 of 65,536 entries correspond to a strong cadence. Following contextual enrichment, we can detect vector magnitude of type = Low. Due to the incresed number of results matching the criteria, the query time is longer than the query for strong cadence. The GPS based query is also performed both before and after contextual enrichment. The time taken to evaluate is similar in both cases due to the reletively small size of the input file, wickgps.xml. The main benefit of including GPS based ranges as event definitions is that it allows the end user to specify the important segments of the session which is applied directly to the data and made simple to query. GPS coordinates are bulky and having to pass them as part of a complex query to detect relevant segments of a session increases the potential for error. As GPS coordinates differ for every environment, it is necessary for the end user to have access to defining these boundaries efficiently.
Filename
Sensor
1 Cadence Classification
Event
wickm.xml
GT3X Accelerometer 1,195ms
Time
2 Cadence Classification
raim.xml
GT3X Accelerometer 12,245ms
3 Vector Magnitude Classification wickm.xml
GT3X Accelerometer 1,074ms
4 Vector Magnitude Classification raim.xml
GT3X Accelerometer 11,309ms
5 Terrain Classification
wickgps.xml Garmin GPS
114ms
Table 3. Sample Enrichment Times
The time taken to contextually enrich the rules into the sensor files is displayed in Table 3, where times for vector magnitude classification and cadence classification are proportional to the input filesize. While times can require up to 12,245ms for the 30MB file, the process needs only to be performed once. In summary, the experiments demonstrate that enablement and enrichment, with their XML and semantic overheads, can be queried using high level query languages without signifciant overhead. The main evaluation comes from our collaborators, the exercise physiologists, who provide the datasets, specify the queries, and can now extract information independently, using events and an XQuery interface.
10
5
Kenneth Conroy, Gregory May, Mark Roantree, and Giles Warrington
Related Research
[6] describes the approach to building OntoSensor, a prototype sensor knowledge repository compatible with evolving Sensor Web infrastructure. OntoSensor includes definitions of concepts and properties adopted in part from SensorML, the Web Ontology Language (OWL)[11] and extensions to IEEE Suggested Upper Merged Ontology (SUMO)[8]. Sensor ontologies are used to establish a terminology for sensors, their properties, capabilities and services. OntoSensor has a number of advantages, including self-descriptive metadata embedded in the descriptions, which can be used in various sensor discovery and reasoning applications. OntoSensor illustrates a semantic approach to sensor description and provides an extensive knowledge model. However, this approach lacks a distinctive data description model to facilitate interoperable data representation for sensor observation and measurement data. Additionally, it does not facilitate the specification or inclusion of context by the end user. In [1], the authors describe a semantic model for heterogeneous sensor data representation. A sensor data ontology is created based on the Sensor web Enablement (SWE)[7] and SensorML data component models. Semantic relationships and operational constraints are deployed in a uniform structure to describe the sensor data. The ontology based model allows machines to process and interpret the emerging semantics to create intelligent sensor network applications. However, this work is in an early stage of development, with many of its aims and goals yet to be implemented, whereas we have a working prototype system which facilitates interaction with domain experts and full query interface. In [12], the authors represent context with varying granularity with a tuple consisting of an RDF triple defining the relationship, a lifespan and a conditional confidence value. This project aims to reduce uncertainty in context integration. The method used to achieve this is combining multiple sources of information and using a Bayesian approach to calculate conditional confidence values. This is useful for the target ubiquitous computing environment but is not suitable for an ever-changing set of events to be detected using multiple sensors in multiple locations. In the core target domain of analysing sensor data corresponding to cyclists, there are a number of tools available which allow a limited analysis for sensor data. The most successful commercial application for analysing power meter data in the cycling domain is TrainingPeaks WKO+ [9]. An open source application, Golden Cheetah [4] can also be used to analyse cycling sensor data. Querying in WKO+ is limited to identifying the minimum/maximum/average data value for each stream for a lap-by-lap or specific time period defined by the user. Apart from the wattage analysis, no additional variables such as speed or current position can be applied as a filter. Querying is not supported by Golden Cheetah. In addition, Neither of these applications can support user defined events or context.
Expanding Sensor Networks to Automate Knowledge Acquisition
6
11
Conclusions
Sensor technology is used in many application areas now as a means of automated data generation and collection. However, the low level nature of these devices and the often complex query requirements of end users and specialists, means that a considerable gap exists between the information generation and end user queries. In this research, our goal was to minimse or even close that gap by allowing users to specify events that would lead to contextual enrichement of the data sources. Our system begins with an automatic process of basic enrichment which we refer to as sensor enablement. At the next point in the architecture, the end users can influence the level and type of context by specifying a series of events. Before we introduced this step many queries were difficult to express and in some cases, it was not possible to express the more complex queries. As is typical in data warehouse systems, this also leads to an improvement in query processing times as the knowledge acquisition step provides partially executed queries. Our current efforts are focused on the Integration Processor as we are currently limited to situations where each sensor can be synchronised against a common clock. As we begin to introduce sensors from outside our direct control, we must be able to auto-synchronise based on a set of algorithms we are currently developing. However, the delivery of a high-level interface for sensor data analysis provides a significant step forward for exercise physiologists where previous efforts required a manual analysis of spreadsheet data.
References 1. Barnaghi, P.M., Meissner, S., Presser, M., Moessner, K., (2009), Sense and sens’ability: Semantic data modelling for sensor networks, in Proceedings of the ICT Mobile Summit 2009 2. Botts, M., Percivall G., Reed, C., Davidson, J., (2006), OGC Sensor Web Enablement: Overview and High Level Architecture, in Proceedings of the GeoSensor Networks (GSN): Second International Conference, Springer-Verlag, pp. 175-190 3. Dey, Anind K., (2001), Understanding and Using Context, in Personal Ubiquitous Computing, Vol 5, No. 1, Springer-Verlag, pp. 4-7 4. GoldenCheetah, (2011), http://goldencheetah.org/ 5. Liu, J., Roantree, M., Bellahsene, Z., (2010), A SchemaGuide for Accelerating the View Adaptation Process, in 29th Interational Conference on Conceptual Modeling (ER’10), Springer-Verlag, pp. 160-173 6. Russomanno, D.J., Kothari, C., Thomas, O., (2005), Building a sensor ontology: A practical approach leveraging ISO and OGC models, in The 2005 International Conference on Artificial Intelligence, CSREA Press, pp. 637-643 7. Sensor Web Enablement (SWE), (2011), http://www.opengeospatial.org/projects/groups/sensorweb 8. Suggested Upper Merged Ontology, (2011), http://suo.ieee.org/SUO/SUMO/index.html 9. TrainingPeaks WKO, (2011), http://www.peaksware.com/trainingpeaks-wko.aspx 10. Wang, X, Dong, J. S., and Chin, C., Hettiarachchi, S., Zhang, D., (2004), Semantic Space: An Infrastructure for Smart Spaces, in IEEE Pervasive Computing, Vol 3, No. 3, IEEE Educational Activities Department, pp. 32-39
12
Kenneth Conroy, Gregory May, Mark Roantree, and Giles Warrington
11. Web Ontology Language, (2011), http://www.w3.org/TR/owl-features/ 12. Ye, J., McKeever, S., Coyle, L ., Neely, S., Dobson, S., (2008), Resolving uncertainty in context integration and abstraction: context integration and abstraction, in ICPS ’08: Proceedings of the 5th international conference on Pervasive services, ACM, pp. 131-140