Modeling Operator Performance and Cognition in Robotic Missions. A. Marquis .... windows and the master system monitor display, based upon the Salience or ...
Modeling Operator Performance and Cognition in Robotic Missions A. Marquis Gacy1, Christopher D. Wickens1, Angelia Sebok1, Brian F. Gore2, Becky L. Hooey2 1
2
Alion Science and Technology, MA&D Operations, Boulder Co San Jose State University, NASA Ames Research Center, Moffett Field, CA
Control of the robotic arm on the International Space Station is a challenging endeavor, not only due to the high consequence of failure, but also because the limited number and arrangement of cameras greatly increases the difficulty of maneuvering the arm. There is great potential for automation to reduce such effort, but developing the right kind and degree of automation is a key concern. Mismatches between the perspective of the operator and the view of the robotic arm, and between the direction of control and response of the arm, contribute to performance degradations. In this paper we describe the development of a computational structure that combines a set of existent human performance modules to address such issues. These modules include the Frame of Reference Transformation (FORT), the Basic Operational Robotic Instructional System (BORIS), the Man-machine Integration Design and Analysis System (MIDAS v5), and the Salience, Effort, Expectancy, and Value (SEEV) attention model as applied in a simulation model of a robotic operator termed MORRIS. INTRODUCTION As automation and advanced technologies are increasingly used in future systems ranging from such complex tasks as commercial airline piloting to the demands of space exploration, there is an increased need to validly predict how the human and the automation will interact. One formalized approach to study the impact of such automation on the human operator in a safe and non-obtrusive manner is through the use of human performance models (HPMs). HPMs play an integral role when complex human-system designs are proposed, developed, and tested. They allow designers to test known issues with the potential system, propose and exercise variations and potential solutions as well as uncover unexpected consequences (Gore, Hooey, et al., 2011). This is particularly true in the area of increasing automation on human performance. The implementation and utilization of automation in complex domains, such as space operations, poses a significant challenge for designers. Proper allocation of tasks and functions to human operators and their semi-automated systems is critical but needs to be based on a thorough analysis of automation properties and capabilities as well as a combination of performance-shaping factors. Past experience has shown that fixed designs where tasks and functions are assigned on an a priori basis often lead to unbalanced workload and a lack of system awareness on the part of the user. A more context-sensitive, dynamic approach to function allocation appears preferable; however, there is no agreement on the proper architecture for such mixed-initiative systems, and little empirical data exists on the effectiveness of different approaches (Wickens, Li, Santamaria, Sebok & Sarter, 2010). The cognitive challenges presented by NASA Robotics are an ideal system for studying these issues and developing modeling solutions to solve them. The Man-machine Integration Design and Analysis System - Function Allocation Simulation Tool (MIDAS-FAST) is being designed to address these issues, by combining human performance modules with
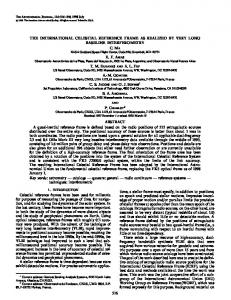
augmented decision and perception models in a 3D virtual world. In this project, we use a variety of existing HPMs and a robotic simulation to create the MIDAS-FAST tool. As part of the development of the FAST modules, the modeling environment will interface with the 3D simulation environment currently used by astronauts to learn general robot arm operational concepts and will provide guidance for appropriate task and function allocation of tasks between humans and automated agents. A key component of robot arm training includes understanding and minimizing the effects of spatial transformation, through specific camera selection and task adjustment (e.g., slowed trajectory). INDIVIDUAL SYSTEMS The BORIS Robot Arm Training Environment The Basic Operational Robotic Instructional System (BORIS) is a simulation environment consisting of a six-joint generic robot arm in a simulated “room” with tables and payload latch-points. BORIS is the primary instructional aide in the General Robotics Training (GRT) program at NASA’s Johnson Space Center (JSC), being used for training general robotic arm control concepts and camera manipulations. BORIS is designed to be conceptually thorough, by providing opportunities to encounter many of the issues with robotic arm control, while maintaining a decidedly “generic” flavor. To do this, the BORIS training environment simulates a 15m x 30m x 15m room with a six degree of freedom (6 DoF) arm attached to one of two wall mounts. The room has a number of identifiable features including a grid on all walls and several spots or images on the walls. BORIS also has the capability of inserting a large table, either for payload placement or as an obstacle, into the room as well (For an example of all such features, see Figure 1). Finally BORIS has seven camera positions: a “window” view, four cameras mounted in the corners of the vertical walls, one at the end of
the robot arm (the “end effector” or EE camera, and a camera mounted on the arm joint above the EE. The operator controls the arm through two hand controllers and receives feedback on arm position and certain features such as self-collisions and arm singularities (positions where automated arm movement fails) on a spate interface. In our HPM simulation, embodied in (simulated by) a HPM known as MORRIS, as described below, a virtual operator will be controlling the arm, giving commands and receiving the update information. The translation of the visual output to the modeling environment is described below.
grappling an object, or performing an extra vehicular activity), the type of automation (e.g., if a specific function allocation strategy or adaptive automation is used), and the reliability of the automation. The tool provides predictions of operator and system performance. MIDAS-FAST allows users to evaluate and compare predicted performance across different automation conditions, to identify the best operating situation for the particular mission. Users have the flexibility to define “best situation” according the parameters of most importance, e.g., minimal time to complete the task, most reliable performance, and/or lowest operator workload. MORRIS: A Simulation Model of the Robotics Operator
Figure 1: The BORIS training environment, showing robot arm and training room
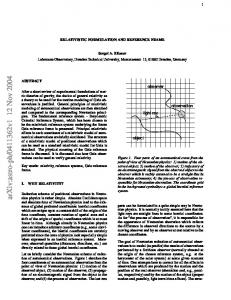
The overall architecture of MORRIS is one that attempts to capture the cognitive demands of a robotics operator using BORIS, and is based upon the experience of five of our team who went through robotics training at NASA with BORIS, compiled with advice from SME’s in robotics training at NASA, as well as the input from one astronaut, and human factors literature from Space operations (e.g., Cizaire, 2007; Kanas & Manzey, 2008). Based on these collective inputs, we developed the architecture shown in figure 2 of our simulated robotics operator called MORRIS. This architecture integrates three different cognitive models highlighted in pink: decision, spatial transformations and eye movements.
MIDAS The Man-machine Integration Design and Analysis System (MIDAS) is a NASA Ames Research Center HPM software tool that has been applied to predict human-system performance in various domains since 1986 (Gore, 2010). MIDAS is a dynamic, integrated HPM and simulation environment utilizing a task network diagram framework that facilitates the design, visualization, and computational evaluation of complex man-machine system concepts in simulated operational environments. MIDAS v5 combines graphical equipment prototyping, anthropometric modeling, dynamic simulation, HPM of operator processes (e.g. attention, memory, workload, situation awareness, etc.), and task networks that represent operator procedures to reduce design cycle time, support quantitative predictions of humansystem effectiveness, and improve the design of crew stations and their associated operating procedures. MIDAS-FAST The Man-machine Integration Design and Analysis System – Function Allocation Simulation Tool (MIDASFAST), is a NASA JSC-funded effort to predict human-system performance in space robotic missions for a variety of automation conditions. The FAST module interacts with MIDAS v5 in a number of ways, including the implementation and expansion of FORT described here. MIDAS-FAST allows users (analysts, mission planners, system designers) to specify a situation they want to evaluate. This includes the particular mission with the robotic arm (e.g., moving to a destination,
Figure 2: Morris Diagram Fundamental to MORRIS is a (1) decision model which makes three types of decisions: how to move the arm and whether to halt it in mid trajectory, if it should be approaching a hazard (a trajectory decision), what control mode of movement should be selected (e.g., speed versus precision, arm-referenced or room-referenced movements, and which camera views should be selected to be displayed in the three windows available to the robotics operator (MORRIS). All of these decisions are based in part upon certain fixed if-then rules, where the “if” defines a context, as shown. For example if the end-effector (EE) is within 1.6 m of the target, then the slow, Vernier rate control mode should be selected. Importantly however, the decisions are also based on
continuously varying utility of different choices, determined by continuous and changing variables as the arm moves through the workspace. Most of these variables are represented, cognitively, by the frame of reference with which the end-effectors is viewed in the cameras, and by which the control movement governs the arm movement. Thus the second model, the (2) frame-of-reference transformation, or FORT model provides critical inputs to all three classes of decisions. The FORT model was developed for a broader class of space manipulations (Wickens, Keller & Small, 2010), and based on extensive empirical data from spatial cognitive operations (see Wickens Vincow and Yeh 2005). In the current project, we are modifying it to account for particular costs (cognitive and perceptual-motor challenges) imposed on MORRIS within the BORIS workspace. Two examples of these are: • Line of sight (LOS) ambiguity costs. Some camera views will depict the end effector moving in a direction that is nearly parallel to the line of sight in the camera, so that movement will be highly compressed, and judgment of where the end-effector is along its trajectory is ambiguous. • Control-display compatibility costs. Some trajectory choices will be such that a rightward (leftward) movement of the control will be reflected in a leftward (rightward) movement of the end-effector as viewed on a camera (consider flying a model plane with a hand controller, as the plane is heading toward yourself). Alternatively some control movements will produce orthogonal display movements, so that the expected movement is ambiguous. The FORT model designed for MIDAS-FAST computes the spatial-cognitive penalties for each camera view, and such penalties have at least three classes of implications. First, FORT determines the overall utility of each camera view (There are 5 cameras that can be assigned to only 3 windows). If its utility is low (FORT penalty is high), MORRIS will decide to temporarily abandon that view, and assign a camera with lower penalties to the viewing window. Second, FORT influences the fluency of executing a particular trajectory. One that imposes a high control-reversal penalty for example may be initiated very slowly, or by an initial control reversal (movement in the incorrect direction). It may slow down the speed of trajectory movement, hence penalizing the overall completion time. Third, FORT computes penalties in a continuous record, and provides outputs of a workload and situation awareness profile across the mission. The final (3) model is a model of visual attention across the workspace, known as SEEV (Wickens, Goh et al, 2003; Wickens & McCarley, 2008; Steelman-Allen et al, 2009, in press). The model (previously implemented in MIDAS v5) is particularly important in MORRIS because it can predict attentional tunneling and areas of neglect, such as when an operator becomes so focused on a window guiding precise movement to a target, s/he fails to monitor another display that portrays the proximity of the arm’s elbow to colliding with an object in the workspace. Essentially SEEV predicts the moment to moment scan between the 3 different camera windows and the master system monitor display, based upon
the Salience or each display, the Effort (proportional to distance) required to move the scan from one area to another, the Expectancy that information will change in an area and, most importantly the Value of each display to the robotics subtask in question. Here “FORT meets SEEV” in that displays returning high FORT penalties are of low value and not frequently sampled, whereas those of low FORT penalties are of high value and will be sampled much of the time. FINDINGS Mapping the BORIS environment to MIDAS-FAST In most HPM simulations, many aspects of the real world, particularly the actual positions of objects and how these objects may appear on a screen, are abstracted to a level where computation using such information is fairly straightforward. Many times, the abstraction comes down to simple Boolean parameters (e.g., can MORRIS see the object or not). In MIDAS-FAST, since the model is interacting directly with the 3D environment, we needed to devise an accurate and computationally efficient manner for mapping the BORIS environment to MIDAS-FAST. This is needed both for the actual execution of the model and the subsequent analysis of data. Our approach is to break the BORIS training room into a simple set of discrete X, Y, Z coordinates, where each integer coordinate point represents a 5m distance. The important features are mapped out a 3 dimensional grid (Figure 3, with each rectangle representing a different level in the Z direction, or height).
Figure 3: Grid map of BORIS training room These features are then explicitly entered into a spreadsheet (Figure 4) as simple values (0, 0.5 or 1). For example, a 0.5 means that the table is within 5m of the point, while a 1 indicates that the table is actually “on” the point. This spreadsheet then forms the basis for the representation of the “real world” in MIDAS. New FORT parameters In the process of determining how FORT would integrate with MIDAS, we realized that there were two other potential considerations that should be included in the FORT calculations: Distance and Orthogonal translation.
visibility, the FORT value is the maximum FORT value possible, in this case seven. The region close to the table, but not actually behind provides poor visibility, which we translate to a value of two.
Figure 4: Spreadsheet mapping of BORIS grid map features Distance – In practice, the movements of the robot arm in the BORIS simulation are often quite slow, making it difficult to determine the direction of movement. This is exacerbated by the distance between the fixed camera and the end of the robot arm, such that it becomes very difficult to discern movement, even good movement, if the camera is far from the motion. Therefore we added a distance consideration which provides an additive factor to the FORT penalty Orthogonal translation – the original implementation of FORT addresses control reversals where a control movement results in the opposite system movement (e.g., moving a joystick to the left results in movement to the right). This type of situation commonly occurs when the operator is directly facing the object to be controlled. In BORIS, such situations may occur but due to the 3D nature of the simulation and the various camera angles from which an operator may observe motion, orthogonal translations are also common. In an orthogonal translation, a movement to the left or right would result in a movement either up/down, or toward/away from the camera. While disorienting, the effect isn’t nearly as strong as a full control reversal and as such is only given a penalty of half as much as the full control reversal action. Mapping FORT to the BORIS environment Along with the new FORT parameters, the existing FORT parameters must be mapped to the BORIS environment based on the cameras used. In this first phase of MIDAS-FORT development we made two key assumptions concerning the camera positions. Assumptions First, we abstracted the pan/tilt/zoom capabilities of the cameras. Making small adjustments in the pan/tilt/zoom properties of the camera are often fairly organic and common sense, such that the process doesn’t involve higher level cognitive thought. Thus for the purposes of the model we assume that the operator is using the optimal pan/tilt/zoom for the given camera. Second we assume that the Z-axis is not a factor in determining FORT angles (although it is used in determining visibility) since three of the four corner cameras are located centrally along each wall corner. Visibility maps For each static camera we generated a series of graphs which represent each of the relevant FORT parameters. First there are “no visibility” and “poor visibility” maps at Z values of -1 and 0 respectively (Figure 5). These visibility maps are only used when one of the two tables is used in the simulation. When a point is in the region of no
Figure 5: Visibility, Distance and FORT movement diagrams for Camera One of the BORIS environment FORT angle graph The next graph is the FORT angle graph which demonstrates the direction of “good motion” (green) compared to “bad motion.” (red) The green bars at each point are perpendicular to the line of sight while the red bar is parallel to the line, creating ambiguity along the line of sight. Moving along the green line thus maximizes the movement with respect to the camera view and thus constitutes “good motion” while moving along the red line minimizes the observed motion with respect to the camera, and is therefore considered “bad motion”. These motion angles are then assigned a FORT penalty between zero and three with motion along the green bar being assigned a FORT penalty of zero, and motion along the red bar being assigned a FORT penalty of three. Control reversals and orthogonal transformations The red and green lines can also be used to determine control reversals and orthogonal translations. When controlling the EE from the EE camera’s point of view, if the EE camera is pointed along the green line and facing the given wall camera, a control reversal will occur (least preferable). If it is facing away from the camera along the green line, no control reversals or orthogonal transformations will occur (most preferable). If the EE camera is facing the red line in either direction, then an orthogonal transformation will occur. Distance graph Distance is the last graph and simply represents the FORT penalty for the distance issue described earlier. If the point in question falls within the green arc, the FORT penalty is zero, whereas it becomes one when it is outside the green arc. EE and arm camera values For the EE camera, the FORT values are almost always going to be favorable compared to the other camera views, particularly when controlling the EE from the EE camera’s point of view. The arm camera is more important for obstacle detection of the EE and would not be selected over the EE camera purely on the basis of FORT calculations. To represent this preference, the arm camera is assigned a (relatively low) additional penalty of one, where the EE camera has a penalty of zero. In all cases, each of these penalties is summed to generate the entire FORT penalty for using a given camera to see a
given position with an expected camera motion. These FORT penalties are then compared across all camera views to select the optimal configuration. Calculating optimal camera views for BORIS and MIDAS-FAST
ACKNOWLEDGEMENTS
The final piece necessary to calculate the FORT values described above is to calculate the actual motion of the EE. Since in MIDAS-FAST, FORT is used in both a predictive (planning) and reactive (response) manner, we can’t simply query or calculate an immediate velocity. Rather we need to generate the predicted velocity from the simulation parameters. A BORIS mission in the MIDAS-FAST environment consists of a series of linear segments. A segment is defined by the endpoint (X, Y, Z, Pitch, Roll, Yaw) information. The FORT values are concerned with the angle of movement, so we calculate the change in X and Y by subtracting the starting position (X0, Y0) from the expected ending position (X1, Y1): ΔX = X1 - X0, ΔY = Y1 - Y0
Eq.1
From this, we can then calculate the angle (a) of movement: amove = tan-1(ΔY / ΔX)
Eq.2
This angle can then be directly compared to the angle (aFP) corresponding to the maximum FORT penalty (FP; Figure 5, lower left, red lines) for the points nearest the start and end positions. Stated formally, the FORT penalty (FP) is: FP = |cos(aFP - amove)|
and performance. The research team will be conducting empirical human-in-the-loop studies to provide operating data, to validate and improve our computational models.
Eq.3
We take the absolute value, since only the magnitude of the difference between the calculated angle and the FORT angle is important for FORT. This value (ranging from 0 to 1) can then be directly added into the total FORT calculation above. DISCUSSION In this paper we described a process for modeling and evaluating operator performance in robotic missions. In particular, we address the problem of inconsistencies between viewing position and direction of motion of the robotic arm. We have developed a technique for translating position and motion data from a 3D simulation environment to values used in the FORT model. This modular system, combining FORT, SEEV, and spatial decision models with the HPM in MIDAS and the 3D virtual environment of BORIS, will allow researchers to study and exercise the consequences of camera position over a variety of scenarios. It will also enable us to implement automation that recommends camera views based on their FORT values or predicted ability to support operators’ task performance. The addition of automation is not expected to impact the process of determining FORT values, although the calculations themselves may be used in a potential automation that suggests specific camera choices. The efforts described in this paper are expected to enable us to more accurately model robotic operator decision making
This work was sponsored by a grant from NASA Johnson Space Center. The team would like to thank Barbara Woolford, the scientific and technical monitor, Janis Connolly, and Mary Kaiser for their support, interest, and inputs to our effort. This work was performed under NASA Grant NRA #NNX09AM81G. MIDAS is a NASA Ames Research Center product (David Foyle is the NASA Civil Servant point of contact). REFERENCES Cizaire, C. (2007). Effect of 2 module docked spacecraft configurations on spatial orientation (Master’s thesis). Cambridge, MA: MIT Gore, B.F. (2010). Man-machine integration design and analysis system (MIDAS) v5: Augmentations, motivations, and directions for aeronautics applications. In P.C. Cacciabu, M. Hjalmdahl, A. Luedtke & C. Riccioli (Eds.), Human Modelling in Assisted Transportation. Heidelberg: Spinger. Gore, B.F., Hooey, B.L., Socash, C., Haan, N., Mahlsted, E., Bakowski, D.L., et al. (2011). Evaluating NextGen Closely Spaced Parallel Operations Concepts with Human Performance Models. In Human Centered Systems Lab (Ed.), HCSL Technical Report. Moffett Field, CA: NASA Ames Research Center. Kanas & Manzey, D.(2008) Space Psychology and Psychiatry, El Segundo Cal.: Microcosm Press. Steelman-Allen, K.S., McCarley, J.S., Wickens, C., Sebok, A., & Bzostek, J. (2009) N-SEEV: A Computational Model of Attention and Noticing Human Factors and Ergonomics Society Annual Meeting Proceedings, Volume 53, Number 12, 2009 , pp. 774-778(5). Steelman-Allen, K., McCarley, J. & Wickens, C. (in press).Modeling the Control of Attention in Visual Workspaces. Human Factors Wickens, C.D., Goh, J., Helleberg, J, Horrey, W., & Talleur, D.A. (2003). Attentional models of multi-task pilot performance using advanced display technology. Human Factors, 45(3), 360-380. Wickens, C.D. & McCarley, J.S. (2008). Applied Attention Theory. Boca Raton, FL: CRC Press. Wickens, C.D., Vincow, M., & M. Yeh (2005). Design applications of visual spatial thinking: The importance of frame of reference. In A. Miyaki & P. Shah (Eds.), Handbook of visual spatial thinking. Oxford, UK: Oxford University Press. Wickens C.D., Li H., Santamaria, A., Sebok, A. & Sarter, N. (2010) Stages & Levels of automation, An integrated meta-analysis. In proceedings, 2010 conference of the Human Factors & Ergonomics Society. Santa Monica: Human Factors