Expectation-Performance Compatibility in a Customer Satisfaction Context Modelled by Means of Aggregation Operators Benoˆıt Depaire Hasselt University Campus Diepenbeek 3590 Diepenbeek Belgium
[email protected]
Koen Vanhoof Hasselt University Campus Diepenbeek 3590 Diepenbeek Belgium
[email protected]
Abstract In this article, we investigate the role of the customer’s expectation in relation to the customer’s post-purchase intentions, such as recommendation and loyalty. We hypothesize that the degree of compatibility between the customer’s expectation and the perceived product performance is positively correlated to the customer’s intentions. Furthermore, we show two approaches to estimate the expectation-performance compatibility, both based on aggregation operators. Finally, we provide empirical evidence which supports the hypothesis that both negative and positive incompatibility have a negative effect on the customer’s intentions, while compatibility has a positive effect on the customer’s intentions. Keywords: Compatibility, Uninorm, Recommendation, Loyalty.
1
Introduction
Over the last four decades, customer (dis)satisfaction has taken an important role in marketing research, both from an academic as from a managerial point of view [12, 10]. Although this hasn’t always been the case, customer (dis)satisfaction is now widely recognized as an important cornerstone for customerorientated companies, irrespective of the industry they operate in [11, 10]. Research results have shown that customer (dis)satisfaction has an influence on several important aspects of a competitive business, such as repurchase intention [10], consumer retention [8, 1], firm performance [2], customer complaining behavior [10], negative word of mouth behavior [10] and eventually on shareholder value [3]. Several theoretical models have tried to explain the hu-
Geert Wets Hasselt University Campus Diepenbeek 3590 Diepenbeek Belgium
[email protected]
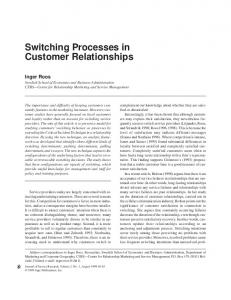
man behavior in a customer satisfaction context. One of the more dominant models is Oliver’s expectancy disconfirmation paradigm, which is shown in Figure 1. Expectation, which is the level of performance the consumer anticipates, has a direct influence on customer (dis)satisfaction. “Consumers are thought to assimilate satisfaction levels to expectation levels in order to avoid dissonance that would arise when expectations and satisfaction levels diverge. This assimilation effect results in satisfaction judgments being high (low) when expectations are high (low)” [10]. Performance also has a direct influence on customer (dis)satisfaction. Consumers are thought to become more (less) satisfied as the performance of the product or service increases (decreases), i.e. the ability of the offering to provide consumers what they need, want or desire increases (decreases) relative to the costs incurred. However, performance and expectation also have an indirect effect on customer (dis)satisfaction through subjective disconfirmation. Subjective disconfirmation is the consumer-specific experienced discrepancy between the perceived performance and the expected performance. This construct might differ from the objectively calculated disconfirmation. Subjective disconfirmation is believed to have a contrasting effect on the overall (dis)satisfaction level. If the consumer perceives a great positive (negative) disconfirmation, his satisfaction level will rise (drop). Finally, the paradigm indicates that a relationship between expectations and performance exists, although the nature of this relationship is idiosyncratic to the product or service being investigated. Up until now, the expectancy (dis)confirmation model has been discussed at the aggregate level, assuming one performance, expectation and disconfirmation score for the entire product or service. However, Oliver already argued in a 1980 paper that “disconfirmation takes place at the individual attribute level” [9]. This implies that the consumer has a certain ex-
Expectations
Calculated Disconfirmation
Subjective Disconfirmation
Satisfaction / Dissatisfaction
Performance Outcomes
Figure 1. Oliver’s expectancy disconfirmation with performance model
pectation and perceives a specific performance and disconfirmation for each product or service attribute or attribute dimension. The consumer will aggregate all these expectations, performance perceptions and subjective disconfirmation scores into an overall satisfaction score. This aggregation is a heuristic based decision-making process and can be modelled by means of uninorms [12]. In this article, we will proceed one step further in the process of customer (dis)satisfaction and we will study the customer’s intentions, such as the customer’s repurchase intentions and the customer’s recommendation intentions. More specifically, we will investigate the role of the customer’s expectation in the process of the customer’s intention. We hypothesize that the degree of compatibility between the customer’s expectation and the perceived product performance has a direct influence on the customer’s intentions. In the next section, we will formulate this hypothesis and show how aggregation operators can be used to estimate the expectation-performance compatibility. Next, we will present the results of an empirical study which will try to assess the validity of our hypothesis and compare the different measures of compatibility. Finally, an overall conclusion will be given.
2
Expectation-Performance Compatibility
The idea of considering the expectation-performance compatibility as a construct in the customer’s intention process stems from the participatory learning paradigm introduced by Yager [13, 5, 14]. The basic premise of this paradigm is that learning takes place in the framework of what is already learned and observations too conflicting with the learner’s beliefs are discarded. Central in the formulation of the participatory learning system is the compatibility measure. A high compatibility between the learner’s beliefs and the new information has a positive effect on the learning process.
Analogously, the customer’s intentions are also formed in the framework of what has already been learned about the product. Furthermore, the product experiences result in the customer’s expectation, which will act as a comparison reference for subsequent experiences. Therefore, we believe that a high compatibility between the customer’s expectation and the perceived performance must have a positive effect on the customer’s intentions. Furthermore, incompatibility implies unexpected product experiences, both negative or positive. These unexpected product experiences can make the customer uncertain about the product’s capabilities, which has a negative influence on the customer’s loyalty and recommendation intentions. We therefore formulate the following two hypotheses: Hypothesis 1 The expectation-performance compatibility is positively correlated to the customer’s intended loyalty. Hypothesis 2 The expectation-performance compatibility is positively correlated to the customer’s recommendation intention. It is important to stress that these hypotheses imply that both positive and negative incompatibility are negatively correlated to the customer’s intention. We assume that the incompatibility, caused by a much better product performance than expected, will have a negative effect on the customer’s repurchase and recommendation intention. This rather counter-intuitive effect relates to the uncertainty about the product caused by the incompatibility. In order to test these hypotheses, we need a formula to express the expectation-performance compatibility at the product or service level. However, we will first determine the incompatibility at the attribute level prior to aggregating these incompatibilities into a compatibility score at product or service level. The incompatibility at the attribute level can be expressed as the difference between the perceived performance and the expected performance. The perceived performance can easily be retrieved by means of a survey. In this article, we assume that product attribute performance is measured by means of a survey on a [0, 1] scale, with 0 denoting the lowest performance level and 1 denoting the highest performance level. Measuring expectations in the same direct manner can be misleading. Firstly, post-purchase questionnaires measure post-purchase expectations. This can differ from pre-purchase levels of expectation because expectations and performance are inevitably confounded once performance observations have began [9]. Furthermore, several levels of expectations exists. Oliver
summarizes no less than eight types of expectations, ranging from intolerable expectations over needed and deserved expectations to ideal expectations. Therefore, it might not always be clear which type of expectation is actually measured, nor which type is used as reference by the consumer. Furthermore, Cadotte et al. showed that other standards, e.g. based on experience, are also used by customers as comparison reference [4]. Therefore, we will need an indirect way to approximate the customer’s expectation in order to estimate the attribute level incompatibilities. It is in this data modelling step where aggregation operators can be applied. The first approach to determine a proxy for the customer’s expectation is based on one of the simplest aggregation operators available, i.e. the arithmetic mean. We define the average attribute performance as a proxy for the customer expectation. We will call this approach the naive approach because it only uses information from the product attributes’ performances to estimate a proxy for the customer’s expectation. The naive approach allows us to model the product attribute’s incompatibility according to Eq. 1, where µp denotes the average perceived attribute performance and Ii and Pi respectively denote the incompatibility and perceived performance of attribute i. Ii = Pi − µp
(1)
The second approach is based on a more advanced aggregation operator, i.e. the uninorm. The uninorm aggregation operator is the result of the unification of the t-norm and the t-conorm operator and was studied and presented by Yager and Rybalov [15]. It possesses an identity or neutral element ν which has no influence in the aggregation process. Vanhoof et al. have already shown in their work that uninorms can be used to model the customer satisfaction process [12]. Furthermore, they have also shown that the uninorm’s neutral element ν provides a good proxy for the customer’s expectation level [12, 11, 6]. In this research, we will use Dombi’s uninorm [7] which can be expressed mathematically as follows: Qn
U (x1 , . . . , xn ) =
α
xi Qn i=1 (1 − xi ) + i=1 xi
Qn n−1
i=1
(2)
Applied to the customer satisfaction process, satisfaction S is considered as the aggregation U (. . .) of the various attribute performance scores Pi . Because Dombi’s uninorm contains only one parameter, the
uninorm can be learned analytically at customer level. In fact, we can rewrite Eq. 2 and learn α as follows. ·
Qn
Pi α = Qn i=1 (1 − Pi )
1−S S
i=1
1 ¸ n−1
(3)
This analytical learning method allows us to determine α for each customer individually. By means of parameter α we can derive the uninorm’s neutral element (cf Eq. 4), which is a proxy for the customer’s expectation. Therefore, we can conclude that the parameter α relates to the customer’s expected performance level. However, in our analysis we will rather focus on ν than on α when it comes to the interpretation of the uninorm’s parameter. ν=
α 1+α
(4)
In contrast to the naive approach, the uninorm approach incorporates both satisfaction and attribute performance information when deriving the customer’s expectation (cf Eq. 3). We can now express the attribute incompatibility as follows: Ii = P i − ν
(5)
Next, we will need to aggregate the various attribute incompatibility scores into a compatibility score at product/service level. In order for such aggregation to be valid, the following properties must hold for the product level compatibility score C. Property 1 a) 0 ≤ C ≤ 1 b) ∀i : Ii = 0 ⇒ C = 1 c) ∀i : Ii = 1 ⇒ C = 0 In this article, we will use an overall product compatibility formula which shows strong resemblance to the compatibility measure in Yager’s participatory learning paradigm [13]. The only difference with Yager’s compatibility measure is that we will take the square of the attribute incompatibilities instead of the absolute value. Taking the square emphasizes the existing incompatibilities. We can write the overall product compatibility as in Eq. 6, with n denoting the number of product attributes. It can be easily verified that this compatibility measures possesses all the required properties (cf property 1). n
C =1−
1X 2 I n i=1 i
(6)
Given the above mathematical formulation of the overall compatibility measure and the two approaches to estimate the customer’s expectation, we can define two compatibility measures, i.e. Cµ which is based on the naive approach and Cν which is based on the uninorm approach. Next, we will verify the proposed hypotheses by means of an empirical study and we will further analyze the overall compatibility measure.
3
Empirical study
3.1
Table 2. Data set descriptives Variable name Availability Employees Help desk Information Service Invoice Satisfaction Recommendation Loyalty
Min-Max
Mode
Median
Mean
1-5 1-5 1-5 1-5 1-5 1-5 1-10 1-5 1-5
4.00 4.00 4.00 4.00 4.00 4.00 8.00 4.00 4.00
4.00 4.00 4.00 4.00 4.00 4.00 8.00 4.00 3.00
3.63 3.94 3.61 3.54 3.73 3.87 7.46 3.36 2.50
Data
This research includes data from a customer satisfaction survey performed among customers of two Belgian companies, which are direct competitors. The survey measures the performance of 6 attributes and the overall satisfaction level. The attributes were selected based on a prior qualitative research to ensure that only significant attributes were chosen. All performance scores were measured on a scale from 1 [very low] to 5 [very high] and the overall satisfaction was measured on a scale from 1 [extremely dissatisfied] to 10 [extremely satisfied]. Furthermore, intention of loyalty and recommendation were measured on a scale from 1 [not loyal/no recommendation] to 5 [loyal/recommendation]. Table 1 gives an overview of the variables available for this research, while table ?? provides descriptive statistics about the data. In total, our data set contains 950 records (48% company 1, 52% company 2).
Eq. 6, for both the naive and uninorm approach. In order to do so, we first had to recode all the variables to a [0,1] scale. Furthermore, for the uninorm approach, we had to learn the customer’s expectation (i.e. ν). Figure 2 presents the distribution of the uninorm’s identity element. This histogram illustrates that the distribution of the customer’s expectation level shows some resemblance to a normal distribution, except for the outer right tail. This suggests that extremely high expectations occur less than could be expected under the assumption of a normal distribution. 90
80
70
60
50
40
Table 1. Data set variables
30
20
Variable name
Variable description
Company Availability
The name of the company Whether or not it is easy to get in touch with employees of the company The quality of the contact with employees of the company The quality of the company’s help desk The quality of the information provided by the company The quality of the service provided by the company The quality of the invoices received by the customers The level of the customer’s overall satisfaction Whether or not the customers intend to recommend the company to friends Whether or not the customers intend to stay loyal to the company (repurchase)
10
Employees Help desk Information Service Invoice Satisfaction Recommendation Loyalty
3.2
Results
The first part of the empirical study has as purpose to assess the validity of the proposed hypotheses. Therefore, we first calculated the compatibility by means of
0 0.00
0.25
0.50 Expectation
0.75
1.00
Figure 2. Distribution of the uninorm’s identity element
In order to test hypothesis 1 and 2, the correlations between the uninorm and naive compatibility on the one hand and loyalty and recommendation on the other hand were calculated. Both hypotheses are compared against the null hypothesis which states that no correlation exists between the compatibility measures and the customer’s intentions. The results are presented in table 3 which reject the null hypothesis in favor of the alternative hypotheses. These results confirm the assumed relationship between performance-expectation compatibility and customer’s intention, hereby providing new insights into the customer’s post-purchase intentions process.
Furthermore, we also analyzed the difference of the correlation between the naive compatibility and the customer’s intentions on the one hand and the correlation between the uninorm compatibility and the customer’s intentions on the other hand (0.240 versus 0.253 for loyalty and 0.334 versus 0.352 for recommendation). As expected, the correlation between the customer’s intentions and the uninorm compatibility is stronger than the correlation between the customer’s intentions and the naive compatibility. This can be explained by the fact that the uninorm compatibility is based on more information, i.e. it also contains information from the overall satisfaction score. However, only the difference in correlation between the customer’s recommendation intention and the compatibility measures are found statistically significant at 5%. These results hint that the uninorm compatibility measure should be preferred over the naive compatibility measure in predictive analysis.
achieve expectation-performance compatibility.
Table 3. Correlation between customer intentions and compatibility measures
Finally, we also built a multinomial logistic regression model to predict customer recommendation. We used recommendation intention and the uninorm compatibility for this part of the analysis because they showed the highest correlation (0.352). Our regression model uses recommendation as a dependent variable and satisfaction, average attribute performance and uninorm compatibility as the explanatory variables. By adding satisfaction and average attribute performance to the regression model, we are able to verify if our compatibility measure truly succeeds in extracting new information from the data.
Intention
ρ(Cµ )
ρ(Cν )
Sig. diff. (2-tailed)
Loyalty Recommendation
0.240* 0.334*
0.253* 0.352*
0.14 0.04
*
Significant larger than 0 at 1% level.
The second part of the empirical study focusses on the value of the compatibility measure and its relationship to the customer’s intention. Therefore, first we calculated the average customer intentions for both companies (cf. table 4). This shows that customers of company 2 are statistically significantly more loyal and more likely to recommend their company. Next, we calculate the average uninorm and naive compatibility for both companies (cf. table 5). These results show that the second company succeeds better in meeting the customer’s expectations than the first company. Although the difference between the average compatibility of both companies is rather small, it still is statistically significant at a 5% level. These results and the positive correlation found between performanceexpectation compatibility and the customer’s intentions suggest that difference in both company’s customers’ intentions can partially be explained by company 2’s better ability in meeting expectations. Furthermore, this difference makes sense, given the fact that the first company is a newcomer to the market while the second company can be considered as the market leader. One could expect that the expectations about the newcomer are not as stable yet as those about the market leader, which makes it difficult to
Table 4. Average customer intentions per company Company 1
Company 2
2.28 3.07
2.71 3.65
Loyalty Recommendation
Sig. diff. (2-tailed) 0.00 0.00
Table 5. Average compatibility per company
Average Cµ Average Cν
Company 1
Company 2
Sig. diff. (2-tailed)
0.988 0.986
0.990 0.988
0.03 0.03
The results of this regression analysis supports the importance of the compatibility construct. Firstly, the overall predictive accuracy of the regression model dropped from 47.4% to 46.4% if the compatibility measure was removed from the model. Secondly, McFadden’s R2 , which measures how much of the total variance in the dependent variable is explained by the model, drops from 15% to 14% if the compatibility measure is removed from the model. Finally, the likelihood ratio test shows that the compatibility measure is statistically significant at 1%. Because the model also contains satisfaction and average attribute performance, we can conclude from the likelihood ratio test results that the compatibility extracts new information from the data. Otherwise, the compatibility could not have a statistically significant role in the model. Finally, although the drop in significance and McFadden’s R2 is minimal, the statistically significant compatibility construct still proves its value as its regression parameter provides an extended understanding of the customer’s intentions processes.
4
Conclusions
In this article we defined expectation-performance compatibility as a new construct in the process of customer’s intention behavior. We showed how this compatibility can be estimated by means of aggregation operators, providing two alternative approaches, i.e. the naive approach and the uninorm approach. We proved empirically that these compatibility measures are positively correlated with the customer’s intentions. This implies that both positive or negative incompatibility between the customer’s expectation and the perceived performance, has a negative effect on customer loyalty and recommendation. Furthermore, the empirical results show that both the uninorm and naive approach are positively correlated, although the uninorm approach is statistically significantly more strongly correlated with customer’s recommendation than the naive compatibility. The empirical results also showed by means of a multinomial logistic regression that the uninorm compatibility succeeds in extracting new information from our data and improves the correct prediction of a customer’s recommendation intention. Finally, we can conclude that estimating the naive or uninorm compatibility measures can be of interest to companies as it helps them understand their customer’s post-purchase intentions.
References
performance analysis. WSEAS Transactions on Business and Economics 3, pp. 101-108. [7] J. Dombi (1982). Basic concepts for the theory of evaluation: The aggregative operator. European Journal of Operational Research 10, pp. 282-293. [8] V. Mittal, W. Kamakura (2001). Satisfaction, repurchase intention, and repurchase behavior: Investigating the moderating effect of customer characteristics. Journal of Marketing Research 38, 131-142. [9] R.L. Oliver (1996). Satisfaction: a behavioral perspective on the consumer. McGraw-Hill. [10] D.M. Szymanski, D.H. Henard (2001). Customer satisfaction: A meta-analysis of the empirical evidence. Journal of the Academy of Marketing Science 29, pp. 16-35. [11] K. Vanhoof, T. Brijs, G. Wets (2003). An indirect measurement for customer expectation. In Principles of Fuzzy Preference Modelling and Decision Making, eds. B. De Baets, J. Fodor, Academia Press, pp. 109-122. [12] K. Vanhoof, P. Pauwels, J. Dombi, T. Brijs, G. Wets (2005). Penalty-reward analysis with uninorms: A study of customer (dis)satsifaction. In Intelligent Data Mining. Techniques and Applications, eds. D. Ruan, G. Chen, E.E. Kerre, G. Wets, Springer, pp. 237-252.
[1] E.W. Anderson (1994). Cross-category variation in customer satisfaction and retention. Marketing Letters 5, pp 19-30.
[13] R.R. Yager (1990). A model of participatory learning. IEEE Transactions on Systems, Man and Cybernetics 20, pp. 1229-1234.
[2] E.W. Anderson, C. Fornell, D.R. Lehman (1994). Customer satisfaction, market share and profitability: Findings from Sweden. Journal of Marketing 58, pp 63-66.
[14] R.R. Yager (2004). Participatory learning: a paradigm for building better digital and human agents. Law, Probability and Risk 3, pp. 133-145.
[3] E.W. Anderson, C. Fornell, S.K. Mazvancheryl (2004). Customer satisfaction and shareholder value. Journal of Marketing 68, pp 172-185. [4] E.R. Cadotte, R.B. Woodruff, R.L. Jenkins (1987). Expectations and norms in models of consumer satisfaction. Journal of Marketing Research 24, pp 305-314. [5] V. Cutello, J. Montero (1998). Nondeterministic aggregation operators and systems. International Journal of Intelligent Systems 13, pp 181-192. [6] B. Depaire, K. Vanhoof, G. Wets (2006). Managerial opportunities of uninorm based importance-
[15] R.R. Yager, A. Rybalov (1996). Uninorm aggregation operators. Fuzzy Sets and Systems 80, pp.111-120.


![writeissues.ppt [Compatibility Mode] - CiteSeerX](https://m.moam.info/img/260x300/writeissuesppt-compatibility-mode-citeseerx_5c302427097c47b9458b45f0.jpg)