METEOROLOGICAL APPLICATIONS Meteorol. Appl. 20: 217–223 (2013) Published online in Wiley Online Library (wileyonlinelibrary.com) DOI: 10.1002/met.1399
Expected impacts and value of improvements in weather forecasting on the road transport sector Pertti Nurmi,* Adriaan Perrels and V¨ain¨o Nurmi Department of Meteorological Research, Finnish Meteorological Institute, Helsinki, Finland
ABSTRACT: Atmospheric predictability has improved by approximately 1 day per decade during the last 20 years based on verification results of ECMWF forecast output. In Finland, locally applied accuracy measures indicate marked improvements in the quality of forecasts for the general public since the late 1980s. It is assumed that similar trends will continue to the foreseeable future. Use of weather information will allow for better options in the decision-making of various stake holders in the transport sector, such as commuters or tourists, transport infrastructure owners and transport service and maintenance operators. This paper discusses the economic impacts and value of weather forecasts on different transport modes (road, rail, air) highlighting the effects of potential improvements in forecast quality in the expected future climates in Europe. It is not only the improved quality of available weather forecasts that will define the value of information. The way in which the information is communicated and how it is being utilized by decision-makers are highly relevant steps in a weather service value chain. Rather than applying the traditional Cost-Loss model, which would relate improved forecast accuracy to increased expected utility, an alternative approach is being applied. This ‘Weather Service Chain Analysis’ (WSCA) accounts for imperfect features in the communication chain and in the use of weather information by analysing the decay of the total potential benefits via decomposing the information flow from original forecast generation to final benefit realization. Concrete estimates are provided for the road transport modes both in Finland and in Europe. Copyright 2013 Royal Meteorological Society KEY WORDS
forecast verification; forecast value; predictability; road weather forecasting; road transport
Received 22 September 2012; Revised 22 February 2013; Accepted 8 March 2013
1.
Introduction
Analysis and evaluation of weather forecast quality should be an integral component in every operational weather service. The scope and goals of the associated verification activities and the practical verification techniques being applied must be clearly defined and thoroughly designed in order to be able to realize and perform credible verification actions. At least as important as the design of the forecast verification scheme is being able to distinguish and thoughtfully cater for the user(s) of the verification outcome. Verification results are useful and beneficial only when providing answers to the various kinds of questions addressed by specific target groups like decision-makers and end-users of forecast information. When the requirements of the transport sector in regard to weather information quality are being considered, all different transport modes (air, sea, road, rail, inland waterways) have their discrete, individually specific requirements which need to be tackled and solved. Forecast verification is an efficient tool to provide guidance and support to decision-making procedures relating to weather dependent actions affecting transport. The transport sector has always been highly weather dependent, and one only needs to consider aviation or sea transport to be convinced. More recently, road transport has become
* Correspondence: P. Nurmi, Meteorological Research, Finnish Meteorological Institute, POB 503, FI-00101 Helsinki, Finland. E-mail:
[email protected]
Copyright 2013 Royal Meteorological Society
increasingly weather reliant, not the least because of increasing traffic volumes and frequency of adverse weather events affecting the roads. Good examples can be found in various papers (e.g. El Faouzi et al ., 2010; Nurmi et al ., 2010) published under the umbrella of the Standing International Road Commission (SIRWEC) since its foundation in the early 1980s (http://www.sirwec.org; http://www.sirwec2012.fi). To be able to appraise the socio-economic benefits of weather services for any transport mode it is crucial to understand the generation of the associated benefits and the underlying factors. There have been occasional quantitative assessments or assessment outlines for specific company level decision set-ups (i.e. regarding optimal timing of an activity). This paper looks at the social-economic benefits from a societal point of view, which means that originally non-priced effects (e.g. on the environment) receive a so-called shadow price, whereas transfers between groups (e.g. benefits at the expense of others) are not counted as a societal benefit (but they can be at sector or company level). This approach is also called social cost-benefit analysis (SCBA), as distinct from conventional cost benefit analysis (CBA). By accounting for induced effects of the initial benefits, which can spread out over the whole economy, a comprehensive macro-economic impact assessment can be carried out. The latter would require combined micro/macro-economic model use, which so far has not been applied to weather service benefits and goes beyond the scope of this paper. Quantitative assessments of economic impacts of weather information, and especially the, presumably favourable, effects of potentially improving weather forecasts, have been infrequent in the meteorological literature. The recently concluded
218
P. Nurmi et al.
European Union 7th Framework Programme project EWENT (http://www.ewent.vtt.fi) addressed these issues and produced new comprehensive information on the economic value of weather forecasts on transportation in Finland and in Europe as a whole, even considering climate change issues and taking into account the expected forecast quality in future climates (Vajda et al ., 2011; Levi¨akangas et al ., 2012; Nurmi et al ., 2012). This paper discusses first, in Section 2, the present and expected future forecast quality on a national and general international level. Section 3 provides a very brief overview of the general Cost/Loss analysis before introducing the Weather Service Chain Analysis (WSCA) developed at Finnish Meteorological Institute (FMI). We then focus on the road weather services and apply this new approach for the road transport mode in Section 4 and, finally, provide final conclusions in Section 5.
2.
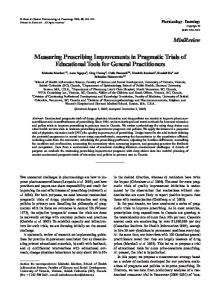
Figure 1. Thirty-year evolution of the skill (based on mean absolute error) of 24 and 48 h maximum temperature forecasts for a station in northern Finland. A 3 year moving average is applied on the data.
Long-term improvements in weather forecast quality
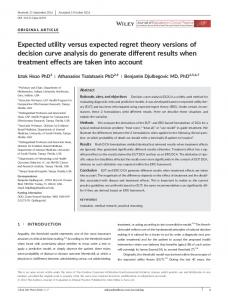
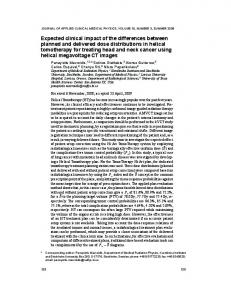
As highlighted in the introduction, it is of utmost importance for operational weather services to keep abreast of the performance of their service products. FMI has for many decades been very active in forecast verification methodology research and applying new methods in practice. Consequently, comprehensive, over-arching forecast verification systems have been operated since the early 1980s, and aggregated datasets have facilitated long-term trend analysis and evaluation of the operational forecast quality in Finland. As one example, the verification skill score time-series of Figure 1 (redrawn and updated to present day from Nurmi and Brockmann, 2007) show a remarkable improvement in ‘human-made’ maximum temperature forecasts produced for the general public. One can interpret that the 2 day forecasts (lower grey line) of the early-2000s are of the same quality as the 1 day forecasts (upper dotted line) of the early-to-late1980s. During recent years the difference between the skill of 1 and 2 days forecasts has diminished. Such clear results will not necessarily show up for all weather variables and at all geographical locations. This is very common in forecast verification which makes verification studies so challenging but also a highly interesting research area. Nevertheless, the message of Figure 1 is a clear indication of forecast quality developments during the past few decades. The previous results represented forecast quality improvements of the operational forecasters of FMI. One can also follow up quality developments of numerical weather prediction models, which are commonly used by operational meteorologists as their forecasting guidance. Figures 2 and 3 show a timeseries trend representation of forecast performance of the European Centre for Medium Range Weather Forecast (ECMWF) models in the mid-troposphere (at 500 hPa) and for surface precipitation, respectively. It is commonly considered easier to produce forecasts of the general large-scale atmospheric features than those of the surface weather. It is seen in Figure 2 that the usefulness of forecasts of the free atmosphere circulation patterns, shown as predictability in the number of days, was about 4 days in the early 1990s, ca 5 days in 2000, and presently about 6 days. The corresponding results for the predictability of model produced precipitation were 2 days in the mid-1990s and about 3.5 days, today (Figure 3). Hence, be it forecasts in the free atmosphere or for surface weather parameters, it is fair to say that the predictability has improved, on average, by 1 day per decade. It is, therefore, a justified assumption that a similar trend would continue to the foreseeable future. This postulate Copyright 2013 Royal Meteorological Society
Figure 2. Twenty-year evolution of the predictability in the free atmosphere (500 hPa geopotential height) by ECMWF. (After ECMWF.)
Figure 3. Fifteen-year evolution of the predictability of surface precipitation by ECMWF. (After ECMWF.)
is highlighted with the superimposed (by simple visual extrapolation) dotted lines in Figures 2 and 3. Long-term, historical forecast verification statistics, when available, can very neatly be transformed and applied for future planning at weather services to set explicit targets, or headline measures, on expected forecast quality during the coming years. Such user-oriented verification activities will effectively improve feedback procedures between a weather service and its various stake holders and forecast end-users. Meteorol. Appl. 20: 217–223 (2013)
Impacts and value of weather forecasting improvements Table 1. Predictability of the quantitative precipitation forecasts of FMI, 2004–2012, based on the SEEPS measure, and the short-range and long-term targets for 2013 and 2015, respectively.
Target Target
Year
Predictability (in h)
# of cases
2004 2005 2006 2007 2008 2009 2010 2011 2012 2013 2015
80.9 81.0 81.2 84.4 85.6 90.7 96.0 102.9 97.0 100 104
52 900 57 600 39 000 31 500 34 300 55 400 63 200 63 900 64 600
As an example, the Finnish Meteorological Institute has adopted the so-called SEEPS verification measure (Stable Equitable Error in Probability Space) (Rodwell et al ., 2010) as one of the meteorological key performance indicators in the Institute’s 5 year planning process. SEEPS, which was originally developed at ECMWF, was chosen as the headline measure to follow up the quality of Quantitative Precipitation Forecasts (QPF) produced by the operational weather service of FMI. For specifications and details of SEEPS, the reader is referred to Rodwell et al . (2010, 2011). Table 1 gives an indication on how the predictability of FMI’s QPFs has evolved during the years 2004–2012. Based on this verification history, a short-range target (for 2013) and a longer term goal (until 2015) have been defined. One can easily discern the annual variability – years 2004–2006 were very similar, whereas there were big changes in quality in 2010 through 2012. The relatively large differences in the number of cases in the statistics (right-hand-side column of Table 1) emphasize that different years are not necessarily directly comparable.
3. Overview of the cost/loss concept and introduction to WSCA For a long time the default workhorse for the economic valuation of weather forecast information has been the socalled Cost-Loss model (e.g. Katz and Murphy, 1997). The term Cost-Loss model has gained wide popularity in weather service circles, but among economists and decision support modellers the typical term for this kind of models is Cost-Benefit Analysis (and in the US also Benefit-Cost Analysis). In the Cost-Loss model, taking protective action involves a certain cost while absence of protection is expected to result in a larger loss if adverse weather conditions occur. The optimal decision whether to protect or not is influenced by prior knowledge of the relevant weather conditions. The weather information provider delivers this information and it can be shown that the better the quality of the forecast the larger the expected value of the decision. This model can be further developed to include the attitude towards risk of the decision-maker. Various authors have discussed the limitations of the CostLoss approach (Millner, 2009; for discussion: Lazo, 2010). Obvious extensions are for example explicit inclusion of uncertainties about the forecasts and about the effectiveness of counter measures (Teisberg and Weiher, 2009). Yet, Copyright 2013 Royal Meteorological Society
219
even though these are useful extensions of the basic CostLoss model, various problems are still not addressed, as the approach remains essentially too mechanical for application to non-perfectly informed users. Reasons for these limitations are rooted in incomplete information, limited capabilities of decision-makers to interpret weather information, transaction cost of information acquisition and processing and principalagent (split incentives) structures. In relation to forecast skill indicator development several authors have already hinted at the need for elaborating the evaluation of the forecast quality beyond the basic cost-loss model and its variations. On the one hand some strains of development try to account the effects of uncertainty and confidence on the use of weather information with more sophisticated ways (Wilks, 2001). A second line deals with variations in the appreciation and uptake capability of the weather information by the user (Patt et al ., 2005; Sharma and Patt, 2012). Combinations of the two approaches are truly scarce (an example is Millner, 2008) e.g. because management of the complexity of the different components. It is shown below that the inclusion of the user side or, rather, the entire pathway from forecast to the realized benefit needs to be accounted for in order to get a better appreciation of the socioeconomic value of the weather services. The addition of uncertainty is basically a more technical feature, which is relevant, but gets only a practical meaning in the valuation if the uncertainty can be sufficiently specified (and preferably empirically tested to get a hunch of the distribution characteristics). Furthermore, one should realize that uncertainty, in many forms, is an issue throughout the entire pathway from the forecast to the realized benefit and not just for weather forecasts as such. Perrels (2011) and Perrels et al . (2012) introduced the socalled Weather Service Chain Analysis (WSCA) which applies seven consecutive ‘filters’, or ‘stages’, through which the weather forecast services will proceed when considering the entire production chain from forecast generation to the end-user. These filters will step by step reduce the potential benefits that the original forecast might realize. In many cases a hypothetical maximum benefit potential can be estimated, i.e. assuming a perfect forecast together with 100% use among the endusers and 100% effectiveness of the end-users’ responses. Subsequently, the degree of information decay in the weather service chain can be analysed so as to approximate the actual level of realized benefits in the considered sector. Information decay refers to the fact that in subsequent stages of the weather service chain, some of the original potential gets unattainable because access, use, comprehension, etc. are not optimal. The concepts of ‘perfect forecast’ or ‘100% accuracy’ are not discussed here as they would address highly challenging forecast verification research issues per se. The seven steps (stages) are described as follows (Table 2): To what extent 1 2 3 4
the weather forecasts are accurate; the weather forecasts contain appropriate data for end-users the decision-makers have timely access to weather forecasts; the decision-makers adequately understand weather forecasts; 5 the decision-makers can use weather forecasts to effectively adapt their behaviour; 6 recommended responses actually help to avoid damage due to unfavourable weather information, and 7 benefits from adapted actions or decisions are transferred to other economic agents. Meteorol. Appl. 20: 217–223 (2013)
220
P. Nurmi et al. Table 2. The WSCA information filtering steps as specified for road vehicle drivers. Information filtering steps
Present qualities and room for improvement.
1
Weather forecast accuracy
2
Information/message customer orientation
3
Access to weather information
4
Comprehension of the information
5
Ability to respond timely and effectively
6
Actual effectiveness of responses
7
Incidence of the costs and benefits of the response
Accuracy levels good, 92% or 19 out of 21 bad weather days were predicted (Sihvola et al ., 2008, in Finland). Road weather warnings are well understood by drivers – about 90% of people understand what is meant by ‘normal’ ‘poor’ or ‘very poor ¨ orni et al ., 2010; Sihvola et al ., 2008). weather’ (O¨ High availability, user rates however only about 62% (Sihvola et al ., 2008, in Finland) messages needed about current road weather conditions including in-car systems and road sings (WIST, 2002). People mostly use personal observations over real weather information (Pisano and Nelson, 1997), bad judgements about current conditions However weather information makes the judgment about current conditions more accurate (Sihvola and R¨am¨a, 2008) – 85%. The frequency of bad weather warnings sufficient for timely responds (Lazo and Chestnut, 2002) but too high threshold for adjustments (Pisano and Nelson, 1997), education needs about driving in bad weather conditions and the use of weather information – only 20% of all drivers change their decisions, however people with weather information make changes more often than other drivers, ca 40%. More study needed on this area. Mostly right responses: (earlier departure from home, lower driving speeds, cancellations of trips and different routes used), however changes happen with too low magnitude: speed reductions too low, only 2% lower volume on road traffic when bad weather warning ¨ orni et al ., 2010) – we give numerical value of 80%. issued (O¨ Awareness on who is eventually benefitting is important to understand; part of the benefits to vehicle drivers due to lower costs of driving, network analysis needed to estimate mode substitution.
The above seven stage list can be used both in a managerial indicative fashion (e.g. by specifying options for improvement) as well as in a quantitative analytical framework. In the latter case the realized share of the original benefit potential is to be assessed by attributing fractions to the subsequent stages and calculate the product sum of the fractions. Approximations for such fractions for the road transport in Finland could be obtained from various earlier studies, and these estimates are discussed below. Even though the availability of information is ample, road weather information reaches only about 60% of the road users (Sihvola and R¨am¨a, 2008). According to their study, road weather information had usually been obtained from television or radio, internet gaining more and more important role as a source of information. Ninety percent of the road users were familiar with the road weather information services. Also the timing of the weather information is important. Drivers request about 12 h lead-times to be able to modify their travel plans (WIST, 2002). Accuracy of 12 h forecasts is then the most important weather forecast quality factor that could create value by altering people’s decisions about their travel plans. Realtime information about the weather conditions is needed by the drivers to change their travel speed and sometimes the route. Speed reductions are usually based on personal observations (Pisano and Nelson, 1997), but personal observations about the current conditions are not always very accurate (e.g. Sihvola and R¨am¨a, 2008). As Bayesian decision theory suggests, information has value only if it has an effect on decision-making. In Sihvola and R¨am¨a (2008), one fifth of the drivers had made or had considered making changes to their travel plans because of the weather forecasts. In an earlier study by Kilpel¨ainen and Summala (2002; according to Sihvola and R¨am¨a, 2008) 6% of the Copyright 2013 Royal Meteorological Society
respondents had actually changed their travel plans because of weather information. The respondents who had been actively following forecasts were more likely to modify their travelling decisions. Cancellations were not reported because the survey was conducted en route and the ones who had cancelled were not reached by either of the surveys. However, the volume of the traffic was significantly lower after forecasts of bad driving weather had been issued. Weather information has also a significant effect on the driving speed. The ones who had obtained weather information beforehand drove on average 5 km h−1 slower than the ones without weather information. One reason for this is that the ones without information evaluated road conditions to be better than they actually were (Sihvola and R¨am¨a, 2008). Because of varying degrees of speed reductions, also the driving speeds of vehicles show larger disparities during adverse weather. This increases the risk for accidents. Thus, the benefit of getting more people better informed about the weather conditions would be even bigger than the lowered risks for the drivers who would reduce speeds after obtaining the information. It would lower the overall risk level in traffic – even for the ones that were already informed about the road conditions. Better accuracy and longer lead-time of the forecasts will create a significant increase in value. The more professional the end-user in possessing meteorological understanding or processing meteorological information, the less filters after the first one (forecast accuracy) will decrease the attainable value. This means that the more skilled end-users typically yield higher total benefits than the non-professionals for whom the significance of filters two to seven will be more dramatic. Examples of professional users in the transport sector are e.g. aviation air-controllers or road maintenance authorities. The effects of the WSCA filters need to be studied in great detail Meteorol. Appl. 20: 217–223 (2013)
221
Impacts and value of weather forecasting improvements
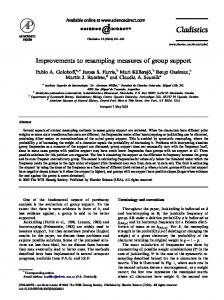
and separately from one transport mode to another to gain credible results. Figure 4 shows two hypothetical examples of WSCA application, where the left hand side distribution starts at 95% forecast quality and the right hand side at 80%. After all of the filtering stages the original 95% (80%) quality has dropped down to 50% (25%) usefulness rate in these two examples. A detailed formal account on WSCA is given in Perrels et al . (2012).
4. Analysis of the road transport mode in Finland and in Europe Different transport sectors and modes should be studied separately regarding the benefit generating effect of weather information, because the available information varies from sector to sector and is also used in different ways in different sectors. Furthermore, the type of applicable weather information varies between different end-users. Some of the major results achieved in the EU 7th Framework Programme project EWENT covering the estimated economic benefits of wintertime road weather forecasts are summarized here (Nurmi et al ., 2012). In Finland, adverse weather conditions are causing on average 47 more daily accidents when compared to ‘normal’ weather conditions. Of these surplus accidents about four cases involve casualties. This corresponds to approximately 10% of all wintertime accidents being induced by adverse weather, which is well in line with studies for Norway (Bl¨asche et al ., 2011). Consequently, it is assumed that the 10% increment in the accident rates is the reduction potential remaining for improved winter weather information. Data originating from the Finnish Transport Agency was used for quantifying the monetary impacts of increased accident rates (Tervonen and Ristikartano, 2011). They estimated the average material damage of an accident without casualties at 2950 euros and the costs of an accident with casualties at 493 000 euros. Using these unit-costs the total annual winter weather related accident costs would amount to 226 million euros per winter, given the current weather information service. An operational road weather service provides both common road users and professional road authorities with information on observed and predicted road weather conditions. Common vehicle drivers are a highly heterogeneous group of information consumers. Many drivers do not even look for or utilize weather information provided for them, and most drivers will not change their pre-trip route decisions. Therefore, most emphasis should probably be put on other elements in the information value chain than the forecast accuracy. For each filter stage of the WSCA as described in the previous section a fraction was attributed based mostly on literature review (see above). Briefly stated, some of the filters encompass more uncertainty and can be more controversial than the others. Therefore, the distribution below can be regarded as a first well-educated ‘guestimate’ (the redistribution effect of stage 7 is left out): 1 2 3 4 5 6
Forecast accuracy: 92% End-user dedicated information: 90% Access to information: 62% Understanding of information: 85% Adaptation of information: 40% Responding to information: 80%
The potential value of the wintertime road weather information service was run through the WSCA. Consequently, only 14% of the potential value is left at the final stage (#6) as seen Copyright 2013 Royal Meteorological Society
in Figure 5. Note that the 7th filter of the original WSCA concerning the potential transfer of benefits has not been included in this analysis as this filter is often less relevant in sector level analysis of benefit degeneration. Putting the 226 million euros winter weather related accident costs in this framework and the 14% of value being left would mean that savings based on presently available weather forecast information would be ca 37 million euros per winter [x = 0.14 × (226 + x ) = > x = 36.8]. Following the same procedure and postulating perfect (100%) forecast quality would result in savings of about 40 million euros, i.e. 3 million euros more than with present forecast accuracy. One should note however, that higher accuracy presumably also has a positive impact on the drivers’ responsiveness regarding weather information, as the credibility of the information improves with evidently better accuracy. The benefits can also be used in a cost-benefit framework. Regarding road weather services, the costs of information generation and communication through different media in Finland are estimated to be about 2 million euros per year. The estimated 37 million (or 40 million) euros per year would translate into a cost-benefit ratio of about 1:20 (Internal study FMI), which well above the ratios reported so far for weather services for transport in other countries (World Bank, 2008) of for Finland as a whole (Levi¨akangas et al ., 2007). 4.1.
Extension to the European level
De Palma et al . (1997) and De Palma and Rochat (1999) have studied the travel decision-making behaviour of vehicle drivers with respect to weather information in the European cities Geneva and Brussels. Their comparisons showed similarities to ours in the patterns for mode and route time choices. Likewise, Finnish studies by Sihvola et al . (2008) and Sihvola and R¨am¨a (2008) have addressed marked similarities. These independent studies would indicate that there are broad similarities in travellers’ decision-making behaviour within Europe. Despite potential cultural and institutional differences reflecting access and adoption of the services, it is felt that the WSCA approach and estimates for Finland can be generalized to the European level. Following our findings for Finland, the same 10% was applied as the proportion of accidents caused by adverse weather in Europe as a whole. The EWENT project deliverables (Bl¨asche et al ., 2011; Nokkala et al ., 2012) reported the total annual weather related road accidents in Europe amounting to 20.7 billion euros. With no weather information available the estimated costs would be ca 24.1 billion euros, i.e. 3.4 billion or 16% higher than the current cost level which represents the estimated value of current road weather information in Europe. A hypothetical 100% perfect forecast quality (applying the same analysis procedure as for Finland) would increase the benefits by 340 million euros. Improvements in the further stages in the value chain would raise the leverage of forecast improvements significantly.
5.
Conclusions
The general advancements in weather forecasting quality have been quite steady during the past decades with the atmosphere’s predictability having improved by about 1 day per decade. These improvements have also clearly translated to the quality of the final forecasts addressed to the general public and Meteorol. Appl. 20: 217–223 (2013)
222
P. Nurmi et al.
Figure 4. Two hypothetical distributions showing the (remaining) %-share of the benefit potential per information step. For each pair of bars the left hand bar represents the fraction per stage, whereas the right hand side bars represent the remaining cumulated fraction of the benefit potential. The sets of bars denote WSCA.
Figure 5. WSCA for the present-day road weather information service in Finland. For each pair of bars the left hand bar represents the fraction of the benefit potential per stage, whereas the right hand side bars represent the remaining cumulated maximum realized fraction of the benefit potential.
to specific professional users of weather information. It is justified to expect a similar trend to continue in the foreseeable future. Long-term historical forecast verification datasets (when available) can and should be used for target setting and future planning of weather services and service providers. The Finnish Meteorological Institute has for many years invested on such end-user and stake-holder focused verification approaches and, at the same time, put into practice new, scientifically sound and proper forecast verification techniques like the SEEPS measure. Further developments in weather information quality are expected also to reduce the costs caused by adverse weather, while the effectiveness of improved accuracy can vary between different transport modes. Adverse weather conditions and events can have direct and indirect effects on different transport sectors by increasing transport costs, time costs and accident risk. Weather observations and forecasts will facilitate better decisions of decision-makers and end-users. High-quality weather and climate information is of benefit to both operational short-term and strategic long-range decision-making. The more professional the end-user, the larger the potential net economic gain can be realized through the use of available weather information. However, especially in the road transport sector Copyright 2013 Royal Meteorological Society
huge savings could also be reached quite simply by means of more efficient communication to the magnitude of common end-users, who rarely accept and adopt any weather information guidance in their driving behaviour. Modern, innovative ITS (Intelligent Transport System) tools and techniques will advance this process. Rather than using the traditional cost-loss approach, we distinguished seven means (filters) which were employed to assess the economic value of the weather information chain by the so-called Weather Service Chain Analysis (WSCA). The value of the current winter road weather service in Finland was estimated to be approximately 37 million euros with present forecasting capabilities. Postulating a hypothetic (but never reachable) situation with perfect road weather forecasts, some 3 million extra euros could be saved in wintertime Finland. The respective euro figures for the whole of Europe were estimated at 3.4 billion (with present forecast quality) and 340 million (with perfect forecast quality). This research covered only the reduction in the number of accidents due to adverse weather. Improvements of some of the other facets than forecast accuracy in the value chain analysis would probably enhance the overall outcome significantly. Meteorol. Appl. 20: 217–223 (2013)
Impacts and value of weather forecasting improvements
Acknowledgements This work was partly funded by the European Commission in the context of the 7th Framework Programme project EWENT (Grant Nr 233919), which is gratefully acknowledged.
References Bl¨asche J, Kreuz M, Muhlhausen T, Schweighofer J, Ludvigsen J. 2011. Consequences of extreme weather. Extreme weather impacts on European networks of transport. EWENT Deliverable Report D3.4. http://ewent.vtt.fi/ Deliverables/D3/EWENT_D34_v1_0_20111201.pdf (accessed 2 April 2013). De Palma A, Khattak AJ, Gupta D. 1997. Commuters’ Departure Time Decisions in Brussels. Transportation Research Part A: Policy and Practice, Volume 31, Issue 3, 181-203: Brussels, Belgium. De Palma A, Rochat D. 1999. Understanding individual travel decisions: results from a commuter’s survey in Geneva. Transportation 26: 263–281. El Faouzi N-E, Billot R, Nurmi P, Nowotny B. 2010. Effects of adverse weather on traffic and safety: state-of-the-art and a European initiative. Proceedings of the 15th International Road Weather Conference, SIRWEC 2010 , 5–7 February 2010, Quebec City, Canada; 7 pp. http://www.sirwec.org/papers/quebec/45.pdf (accessed 2 April 2013). Katz RW, Murphy AH. 1997. Economic Value of Weather and Climate Forecasts. Cambridge University Press: Cambridge, UK. Kilpel¨ainen M, Summala H. 2002. Road user’s perceptions and the impacts of the road weather information service in Finland. Finnish Road Administration; Finnra Reports 59/2002. 42 pp + app. 4 pp (in Finnish), Helsinki. ISSN 1459–1553. Lazo JK. 2010. The costs and losses of integrating social sciences and meteorology. Weather Clim. Soc. 2(3): 171–173. Lazo JK, Chestnut LG. 2002. Economic value of current and improved weather forecasts in the U.S. household sector. Prepared for: Dr. Rodney Weiher Chief Economist Office of Policy and Strategic Planning. ¨ orni R, Sonninen S, Vahanne Levi¨akangas P, Hautala R, R¨as¨anen J, O¨ P, Hekkanen M, Ohlstr¨om M, Tammelin B, Saku S, Ven¨al¨ainen A. 2007. The effectiveness of the services of the Finnish Meteorological Institute. VTT Publications 665 (in Finnish). Levi¨akangas P, Saarikivi P, Nurmi P, Nurmi V, Perrels A, Vajda A, M¨uhlhausen T, Gerz T, Nokkala M, Molarius R, Ludvigsen J, Schweighofer J, Groenemeijer P. 2012. European extreme weather risk management – needs, opportunities, costs and recommendations. EWENT Deliverable Report D6, 81 pp. Available at: http://ewent.vtt.fi/Deliverables/D6/Ewent_D6_SummaryReport_ V07.pdf (accessed 2 April 2013). Millner A. 2008. Getting the most out of ensemble forecasts: a valuation model based on user–forecast interactions. J. Appl. Meteorol. Climatol. 47: 2561–2571. Millner A. 2009. What is the true value of forecasts? Weather, Clim. Soc. 1(1): 22–37. Nokkala M, Levi¨akangas P, Oiva P. (eds) 2012. The costs of extreme weather for the European transport system. EWENT Report D4, VTT Technology; 36. EWENT: Espoo, Finland. Nurmi P, Brockmann, M. 2007. A quarter century of operational end forecast verification. Proceedings of the EMS Annual Meeting, EMS2007-A-00345, 1–5 October 2007, San Lorenzo de el Escorial, Spain. http://meetings.copernicus.org/www.cosis.net/abstracts/ EMS2007/00345/EMS2007-J-00345.pdf (accessed 2 April 2013). Nurmi P, Hippi M, Juga I. 2010. Evaluation of FMI’s new forecast model of road surface friction. Proceedings of the 15th International Road Weather Conference, SIRWEC 2010 , 5–7 February 2010, Quebec City, Canada, 8 pp. http://www.sirwec.org/papers/quebec/15.pdf (accessed 2 April 2013).
Copyright 2013 Royal Meteorological Society
223
Nurmi V, Perrels A, Nurmi P, Michaelides S, Athanasatos S, Papadakis M. 2012. Economic value of weather forecasts on transportation– Impacts of weather forecast quality developments to the economic effects of severe weather. EWENT Deliverable Report D5.2, 92 pp. http://ewent.vtt.fi/Deliverables/D5/ D5_2_16_02_2012_revised_final.pdf (accessed 2 April 2013). ¨ orni R, Innamaa S, Kulmala R, Kellermann A, Ebner R, NewO¨ ton D. 2010. Evaluation Report for Optimal Data Quality in Selected European Service Cases Deliverable 6 of. QUANTIS – Quality Assessment and Assurance methodology for Traffic data and Information Services: Espoo, Finland. http://www.quantisproject.eu/QUANTIS_D6_final.pdf (accessed April 2013). Patt A, Suarez P, Gwata C. 2005. Effects of seasonal climate forecasts and participatory workshops among subsistence farmers in Zimbabwe. Proc. Natl. Acad. Sci. 102(12): 12623–12628. Perrels A. 2011. Social economic benefits of enhanced weather services in Nepal. Part of the Finnish Nepalese Project (FNEP) for improved capability of the Governments of Nepal to respond to the increased risks related to the weather-related natural disasters caused by climate change, MFA Intervention Code: 79811801, Helsinki. Perrels A, Nurmi V, Nurmi P. 2012. Weather service chain analysis (WSCA) – An approach for appraisal of the socialeconomic benefits of improvements in weather services. Proceedings of the 16th International Road Weather Conference, SIRWEC 2012 , 23–25 May 2012, Helsinki, Finland; 8 pp. http://www.sirwec2012.fi/Extended_Abstracts/002_Perrels.pdf (accessed 2 April 2013). Pisano P, Nelson G. 1997. Weather Information for Surface Transportation: FHWA Efforts Towards ITS Integration of Forecasting and Decisions. Transportation Research Board: Washington, DC. Rodwell M, Haiden T, Richardson D. 2011. Developments in precipitation verification. ECMWF Newsl. 128: 12–16. Rodwell M, Richardson D, Hewson T, Haiden T. 2010. A new equitable score suitable for verifying precipitation in numerical weather prediction. Q. J. R. Meteorol. Soc. 136: 1344–1363. Sharma U, Patt A. 2012. Disaster warning response: the effects of different types of personal experience. Nat. Hazards 60: 409–423. Sihvola N, R¨am¨a P. 2008. Drivers’ perception and understanding of driving conditions and information on driving conditions – based on road side interviews in winter time. Report for the Finnish Road Administration 16/2008 (in Finnish). Helsinki. Sihvola N, R¨am¨a P, Juga I. 2008. The implementation and evaluation of weather services for transport 2004–2007, and summary 1997–2007. Report for the Finnish Road Administration 15/2008 (in Finnish). Helsinki. Teisberg TJ, Weiher RF. 2009. Background Paper on the Benefits and Costs of Early Warning Systems for Major Natural Hazards. Submitted to the World Bank Group Global Facility for Disaster Reduction and Recovery (GFDRR): Washington, DC. https://www.gfdrr.org/sites/gfdrr.org/files/New%20Folder/Teisberg _EWS.pdf (accessed 2 April 2013). Tervonen J, Ristikartano J. 2011. Unit-costs of different cost elements in road traffic 2010. Guideline Report 21/2010, Finnish Transport Agency (in Finnish): Helsinki. Vajda A, Tuomenvirta H, Jokinen P, Luomaranta A, Makkonen L, Tikanm¨aki M, Groenemeijer P, Saarikivi P, Michaelides S, Papadakis M, Tymvios F, Athanasatos S. 2011. Probabilities of adverse weather affecting transport in Europe: climatology and scenarios up to the 2050s. Reports 2011:9, Finnish Meteorological Institute: Helsinki; 85 pp. Wilks DS. 2001. A skill score based on economic value for probability forecasts. Meteorol. Appl. 8: 209–219. WIST. 2002. Weather information for surface transportation, National needs assessment report. Report FCM-R18-2002, Office of the Federal Coordinator for Meteorological Services and Supporting Research: Washington, DC. http://www.ofcm.gov/wist_report/pdf/ entire_wist.pdf (accessed 2 April 2013). World Bank. 2008. Weather and Climate Services in Europe and Central Asia - A regional review. World Bank Working Paper No. 151. The World Bank: Washington, DC.
Meteorol. Appl. 20: 217–223 (2013)