Jul 21, 1987 - Tech- nical advances were made in several areas. We have developed a ... aleah, FL) to ensure that recovery was at least 4 x lo5 cells/mm3 ...
Cytometry 9594-599 (1988)
01988 Alan R.Liss, Inc.
Technical and Statistical Improvements for Flow Cytometric DNA Analysis of ParafEn-Embedded Tissue Brenda J. Sickle-Santanello,’William B. Farrar, Jane F. DeCenzo, Sedigheh Keyhani-Rofagha, John Klein,’ Dennis Pearl,2Harry Laufman, and Robert V. O’Toole Department of Surgery, Grant Medical Center (B.J.S-S.);Departments of Surgery (W.B.F.) and Pathology (J.F.D., S.K-R., R.V.O.), College of Medicine; Department of Statistics (J.K., D.P.); (Cancer Center (H.L.), Ohio State University, Columbus, Ohio 43215 Received for publication July 21, 1987; accepted June 3, 1988
Flow cytometric DNA analysis of paraffinembedded solid tumors has permitted review of large series of archival tissue in attempts to relate abnormal DNA content to prognosis. Limitations of the technique include: 1) a laborious, time-consuming procedure; 2) variation in technique between laboratories; and 3) lack of an objective method of computing DNA indices. Critical evaluation of our technique has shortened the time involved in dewaxing and rehydration, selectively utilized patient’s own normal tissue as the internal standard, proved reproducibility of stored specimens, standardized DNA index compu-
It is accepted that many solid tumors contain DNA content abnormalities. Since the introduction of flow cytometry, the study of such tumors has become possible. However, DNA analysis of solid tumors was hampered because it could only be used on fresh tissue. With the description of‘ a paraffin-embedded technique of flow cytometric DNA analysis by Hedley et al. (4,5),progress toward relating aneuploidy to prognosis has been made in solid tumors. Now it is possible to study retrospectively large populations of patients in whom risk of recurrence, overall survival, etc., are known and can be related to DNA analysis. The study of paraffin-embedded tumors still has some limitations, however, such as: 1) the laborious and time-consuming multi-step procedure for dewaxing and rehydrating tissue; 2) the inability to use the routine internal standards (chick red blood cells) in formalin-fixed tissue (4,5,7); and 3) the lack of an objective method of computing a DNA index, which prevents accurate comparison between studies. In a n effort to improve technique and reduce variations, all aspects of the procedure were reviewed. Technical advances were made in several areas. We have developed a way to complete dewaxing and rehydration of tissue while it is in a single processing and embedding cassette, using a technique modified from Bauer et al. (1).Shutte (7) addressed the issue of internal standards
tation, and developed a statistical analysis to confirm aneuploidy. These technical improvements and the development of a statistical analysis provide a way to shorten the procedure time and standardize the data generated from flow cytometric DNA analysis so as to improve the quality of retrospective reviews of paraffin-embedded tumors and accelerate the definition of flow cytometry’s role as a prognostic indicator. Key terms: Ploidy analysis, technical modifications, solid tumor
by using the patient’s own normal tissue and mixing this with tumor in order to determine hypo- or hyperdip loidy. Our procedure has adopted this alternative internal standard and defined its requirements. In addition, specimens are routinely analyzed 1 hour after staining; however, we have found that data were reproducible when stained specimens were analyzed after overnight refrigeration. It was also possible to store specimens after pepsinization for analysis at a later date. We have used a n objective method of setting regions on the histogram for the diploid population, the tetraploid population (as determined by Fried 1311, and any other significant population. Furthermore, a statistical analysis was developed that utilized the mean channel, cell count, and standard deviation to confirm or disprove the presence of aneuploid populations, especially in the neardiploid or near-tetraploid specimens. We report our experience with this technique on localized tumors of the breast and head and neck.
~
‘Fellow of the American Cancer Society 1985-1987. %ivestigation was supported by PHS Grant #P 30 CA 16058 13, awarded by the National Cancer Institute, DHHS. Address reprint requests to Dr. Sickle-Santanello, Dept. of Surgery, Grant Medical Center, 300 E.Town St., Columbus, OH 43215.
595
IMPROVED DNA ANALYSIS TECHNIQUE
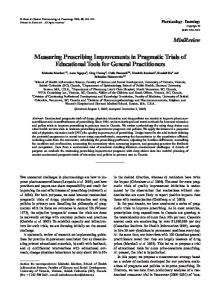
MATERIALS AND METHODS Tissue Preparation The patient’s slides were reviewed. At least two representative slides of normal and malignant paraffinembedded tissues were chosen for each patient. The appropriate blocks were retrieved and three 50-pm sections were cut from each block as well as a 5-pm section before and after each series of 50-pm sections. Occasionally, more sections were needed if the tissue was small. The 5-pm sections were stained with hematoxylin and eosin to confirm tissue homogeneity within the block. Each set of sections was wrapped in tissue paper and placed into a processing and embedding cassette. The cassette was placed in a specially designed container (a polyethylene modification of a standard cassette carrier) within a glass beaker (Fig. 1). The cassette carrier holds up to 30 cassettes. The tissue was then deparaffinized with xylene and rehydrated in a series of 99,95,70, and 50% ethanol washes, followed by a final wash in distilled water, as described by Hedley et al. (5). The entire series of steps was performed in the cassette carrier. Uniform mixing was ensured by use of a magnetic stirrer. After the final wash was completed, each cassette was opened, and the tissue was scraped from the paper and minced with curved dissecting scissors. The patient’s own normal and malignant tissue was placed in separate 15-mlcentrifuge tubes containing l mlO.5% pepsin (Sigma Chemical Co., St. Louis, MO) dissolved in normal saline plus 3% polyethylene glycol (PEG 6000) adjusted to pH 1.5 with HC1, a procedure modified from Bauer et al. (1). The tubes were incubated in a 37°C water bath
for 30 minutes, with vortexing every 5 minutes. Following inbuation, the tubes were placed in an ice bath (to decrease pepsin activity) and immediately filtered through a 53-pm nylon mesh (Small Parts, Inc., Miami, FL) into a clean 15-ml centrifuge tube. The nuclear suspensions were washed with 10 ml cold 3% PEG in phosphate-buffered saline (PBS) and centrifuged for 10 minutes at 1,500 rpm at 4°C in an IEC DPR-6000 centrifuge? All centrifugation steps were performed similarly. The tubes were decanted, and 1 ml PBS was added to each pellet and vortexed. Cell counts were obtained on a Coulter Counter ZBP (Coulter Electronics, Hialeah, FL)to ensure that recovery was at least 4 x lo5 cells/mm3 but no more than 2 x lo6 cells/mm3. When counts were greater than 2 x lo6 cells/mm3, the additional nuclei were removed. The suspensions were then centrifuged and decanted. One milliliter of cold 0.1% Triton X-100 per 1-2 x lo6 cells/mm3 (Sigma Chemical Co., St. Louis, MO) was added followed by incubation on ice for 3 minutes. Again, the nuclei were centrifuged and resuspended in Ribonuclease A (RNAase: Cooper Biomedical, Malvern, PA) at a concentration of 180 units/ ml per lo6 cells in PBS. The suspensions were incubated in a 37°C water bath for 20 minutes. The tubes were centrifuged and resuspended in 50 pglml propidiurn iodide (PI)(Sigma Chemical Co., St. Louis, MO) using 1 ml per 1-2 x lo6 cells. The stained nuclear solution was transferred to corresponding 12 x 75-mm test tubes. Each case had one normal and one malignant suspension. Finally, equal amounts from each of the two tubes were removed and mixed together in a third test tube to use as the internal standard. After overnight refrigeration, the specimens were processed.
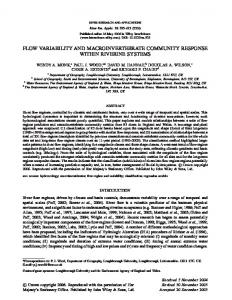
Flow Cytometry The PI-stained nuclei were analyzed on an Ortho System 50H Cytofluorograf (200 mW at the 488-nm line of a Spectra-Physics 164-05 argon ion laser) and 2150 computer system. Since the nuclei were suspended in an isotonic solution (PBS), the carrier sheath was also isotonic (6,8). At the beginning of each day, PI-stained calf thymocytes were analyzed to optimize instrument alignment as well as to generate the calibration constant (mean channel tetraploid population divided by the mean channel of the diploid population); this measurement was usually about 2.0 and was then used for the remainder of the day’s specimens to generate the upper and lower channels of the tetraploid region, as described by Fried (multiplying the constant by the upper and lower channels of the diploid population) (3). Two cytograms and one histogram were generated for each specimen (Fig. 2). The first cytogram, named PI, displayed red fluorescence pulses where x = area and y = peak. The second cytogram, named Pz, where x = red fluorescence pulse area and y = forward angle scatter pulse peak, was created to verify suspected aneuploid populations. A gating area was set on PI to select only nuclei for display and analysis of red fluorescence pulse area on a 1,000-channelhistogram named J1. @
FIG. 1. A specially designed container to hold multiple processing and embedding cassettes during the dewaxing and rehydration of parafin-embedded tissue.
596
SICKLE-SANTANELLOET AL.
m i 2 853
i_L_ "I
DE"
FI
r)WFO
FIG.2. Two cytograms, PIand Pz, and a single histogram, J1 computed for each specimen analyzed.
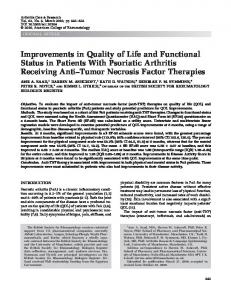
Up to three sets of data were collected on each patient; tumor, native (patient's own) normal tissue, and a mix of approximately equal numbers of nuclei from tumor and normal tissue (Fig. 3A-C). In the case of an aneuploid tumor, the normal-issue was analyzed to confirm a diploid normal, and then the tube containing the mix of normal tissue and tumor was analyzed to determine whether the tumor was hypo- or hyperdiploid. In the case of a diploid tumor, only the tumor specimen was analyzed. The tumor specimen was analyzed first, and the red fluorescencephotomultiplier (PMT)was adjusted to place the pulse area mean channel at approximately channel 200 of J1. No adjustments in the PMT were made for the remaining specimens of a single case. The nuclei were analyzed at a rate of 200 to 500 events per second. After data collection of at least 10,000 nuclei gated within PI and displayed on J1, regions were set at the half-maximum height of any prominent peak just touching the curve. An aneuploid tumor was defined as any addi-
A
B
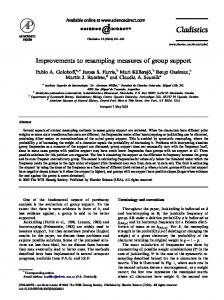
tional population excluding the diploid and tetraploid populations. At least four regions were set for each sample suspected of having an aneuploid population. The first was set around the assumed diploid peak. The second set of cursors was placed to cover the tetraploid peak, as determined by the calibration constant. The third region was set around the suspected aneuploid population, and a fourth region was used to estimate for S-phase cells and baseline noise. This was placed in a region where there appeared to be no dominant population. The 2150 computer then generated the mean channel, cell count, standard deviation (SD),and coefficient of variation (CV) for each region (Fig. 4). The DNA index (DI)for each aneuploid specimen was computed by dividing the mean channel of the aneuploid population by the mean channel of the diploid population. This was confirmed with statistical analysis.
Statistical Testing The statistical test for an aneuploid population is based on a test of whether the observed potential aneuploid peak can be explained by an assumed diploid model and possible S-phase cells. Under this diploid model, we assumed that the data was the result of a random sample of a mixture of two normal populations (diploid and tetraploid). The first population centered at an unknown mean pm (about 200) with a standard deviation Q and the other centered at Kp, with standard deviation Ka. The value of the calibration constant K (usually about 2.01, was determined by the measured fluorescence of calf thymocytes at the start of the day. The proportion of the cells that came from the tetraploid population, p, was another unknown parameter. Four regions were set for each sample suspected of being from an aneuploid population. The first was set around the assumed diploid peak at about channel 200. This region, with lower channel 1(LC1) and upper channel 1(UCl), was set where the cursors touched the histogram for the first time a t one-halfthe maximum height of the peak. This was done to reduce possible contamination from cellular debris. A second region was set at KLCl and KUCl to cover the tetraploid peak. A third
C
Flu. 3. A Histogram of aneuploid tumor. B: Histogram of native diploid normal. C: Histo gram of mix revealing hyperdiploid aneuploid tumor.
597
IMPROVED DNA ANALYSIS TECHNIQUE
5TATiSiICS Ppg
#
LC
UC
I
183 207
3 4
376 414 239 313 342 374
?
Count
::Tot
Peak
Mean
3 6 i i 36.8 i97.n is5.5 139 1.4 376.83S4.8
Total Counts = l@OB CV Skew CV(hrn)
SD
6.5 1l.E 2149 21.5 269.0 274.4 28.8 127 1 . ~ 3 r . 0 3 5 7 . : 9.4
3.3 2.8 7.3 2.6
e.im
4.7
2.738 8.862 5.849
8.8 1.7 8.9
FIG.4. Histogram of aneuploid tumor with accompanying statistics.
region was set around the suspected aneuploid region (LC3, UCd. The last interval (LC4, UC4) was used to adjust for S-phase cells and was set in a region of the curve where there appeared to be no peak. The mean channel (Mi), cell count (CJ, standard deviation (S;), and coefficient of variation was calculated by the 2150 computer for each region. To determine if C3 was too large to be explained by the diploid model, we needed to obtain estimates of p, p, and 0 ' . An unbiased estimator of p was p=C2/(C1+Cz). The reported mean channel numbers and standard deviations were based on a doubly truncated sample from a n assumed normal population, so an adjustment was made to obtain the estimated standard deviation from the parent normal population. Since the cursors were placed in a symmetric manner about the maximum peak height, a n estimate of p i s 2 = (1 - p) MI f pM2/K. Following Cohen (Z), a n estimate of u is A
u =
(1 - $)SI2 + Ej(S2/KI2
[@P(UC*)- WLC*)I-38724 .5[P(x2 6 (LC*I2) + P(x2 < (UCV)] where
=
[(l - C;)Sl2+ $(S2/KI2J/.38724,
x2 is a chi-squared random variable with 3 degrees of freedom, and @ is the standard normal distribution function. Using 0, ,&,and $, under the diploid model, the expected proportion of cells that would fall in the third interval is
The final quantity needed to compute the expected number of cells in the third interval under the diploid model was N (the total number of cells in the experiment). The 10,000 nuclei used to produce the histogram included diploid and tetraploid nuclei as well as S-phase nuclei and baseline debris. An estimate of N was the total number of cells in the first interval divided by the expected proportion of cells in this interval. Once N was estimated, then 193-Nwas the number of cells to be expected in the third interval. The observed number of cells in the third interval, Cs, was compared with this value. Before making this comparison, we first adjusted C3 for baseline debris and S-phase cells. The value C4/ (UC4-LC4) is a n estimate of the amount of baseline debris and S-phase cells per channel, so C s -C4(UC3--LC3)/(UC4 -LC4) is a n adjusted count in the third interval. A consecutive estimate of' the standard error of this numbere is .5JN. Judging two standard errors as significant evidence of a n excess number of cells in the third interval, we classified a population a n aneuploid if
These calculations were then programmed in BASIC.
RESULTS Sixty-seven specimens of localized breast carcinoma were evaluated. Only four specimens were considered inevaluable, two because of inadequate cell recovery and two because of significant baseline debris and S-phase cells, preventing population discrimination. The aneuploid rate was 60% (38/63). The median DI of aneuploid tumors was 1.67, with a range of 0.83 to 2.92. Improvements in technique allowed discrimination of near-diploid and near-tetraploid populations (Figs. 5, 6). Four specimens had two aneuploid populations (Fig. 7). The median CV for aneuploid and diploid tumors was 3.0 and 3.1, respectively, based on a mean channel of approximately 200. Forty-one specimens of localized head and neck cancers were evaluated. Two were inevaluable, one because of inadequate cell recovery and one because of increased baseline debris and S-phase cells. The aneuploid rate was 23%(9/39).The median DI of aneuploid tumors was 1.46, with a range from 0.74 to 1.79. There were no multiple aneuploid specimens. The median CV for aneuploid and diploid tumors was 3.7 and 3.0, respectively. Seventeen specimens were evaluated for comparison of results performed 1 hour and 24 hours after staining (Table 1). There was no significant difference in the results. Comparison of specimens cut at 30pm and 50pm yielded lower nuclear fragmentation with 50-pm sections.
598
SICKLE-SANTANELLO ET AL.
2.5
Table 1 Comparison of 1-Hour us. 24-Hour Poststain DNA Analysis f N = 17)
Time (hours)
FIG.5. Representative histogram of near-diploid aneuploid breast tumor.
234
II
wninm
FLL ~ E S I OF PI
FIG.6. Representative histogram d near-tetraploidaneuploid head and neck tumor.
DISCUSSION Prognostic indicators of many types of solid tumors have relied primarily on histologic variables, which are subjective and vary between observers. Flow cytometric DNA analysis is a procedure that permits objective evaluation of a potentially important prognostic indicator. Large numbers of patients and prolonged follow-up are necessary in order to establish the prognostic importance of DNA content abnormalities in solid tumors. The development of a technique by Hedley et al. in 1983 (5) that utilized archival paraffin-embedded tissue permitted review of large retrospective series. However, the technique of paraffin-embedded flow cytometric DNA analysis is a long, tedious procedure and is fraught with difficulty in reproducing data. We closely evaluated our technique (modified from Hedley (51, Bauer (11, and Schutte (7)) and attempted to shorten, standardize, and add objective statistical confirmation of histogram data. The thickness of the sections cut from paraffin blocks has been controversial. Stephenson et al. (9) evaluated
. :2
FIG. 7. Representative histogram of breast tumor with multiple aneuploid populations.
DNA index Mean
Median
1
1.74
24
1.75
2.01 2.01
section thickness and found that at a thickness less than 50-pm,there was a progressive increase in nuclear fragmentation, evidenced by increased baseline debris seen on the histogram; in addition, the greater probability of transection of the larger nuclei led to a decrease in the relative peak height. We have confirmed microscopically that the incidence of nuclear fragmentation is lower at 50-pm compared with 30-pm sections, and we advocate the use of this thickness. Dewaxing and rehydration is the most laborious and time-consuming step of the procedure. Most techniques advocate performing this step in glass centrifuge tubes with serial centrifugation and decantation or aspiration. Not only is the time of dewaxing and rehydrating lessened by performing all of the steps in a single cassette, but the chance of losing tissue with each decantation or aspiration is minimized. Constant mixing of the reagents is ensured by use of a magnetic bar underneath the cassette holder. Initial reports by Hedley ( 5 )performed cell counts with a hemocytometer just prior to staining, while recent papers advocate using a Coulter Counter ZBI or similar machine. We compared hemocytometer counts and machine counts to be certain that the Coulter Counter was not counting nuclear fragments. Very small fragments are eliminated by setting the lower threshold at 8 pm. There was no difference between the two techniques. Therefore, the machine count is preferable because of its objectivity and shortened time. Reagent quality was very important in our technique. The purity of RNAase, specifically, is variable. We improved resolution of individual peaks and had lower CV's when the highest grade of each reagent was used. In most cases, specimens were rejected if the CV was greater than 5.0. Individual aliquots should be prepared from the stock reagent based on the sample size, since RNAase will lose activity with repeated thawing and refreezing. Most authors describe performing flow cytometric DNA analysis 1 hour after staining. Since the tissue preparation is time-consuming (4-6 hours) and since access to a flow cytometer may be limited, we evaluated two stages at which specimens may be stored. The first stage involves completing the staining procedure with overnight refrigeration a t 4°C. Comparison of results at 1hour and 24 hour poststaining revealed no difference. The second stage at which storage can be performed is just after pepsin neutralization with PEG dissolved in PBS prior to addition of Triton X-100, The specimens should be centrifuged, 1 ml of PBS should be added, and @
599
IMPROVED DNA ANALYSIS TECHNIQUE
they should be stored at 4°C. Similar results have been seen when the same specimen has been processed as usual (24 hours) and at intervals from 1 week to 3 months. These findings have implications for laboratories processing large numbers of samples as well as centers without a flow cytometer that desire DNA analysis. Schutte (7) initially recognized that native (patient’s own) normal paraffin-embedded tissue could be used as the internal standard. Chick or trout red blood cells cannot be used with formalin-fixed tissue. This factor previously limited the application of the paraffin-embedded technique because, without a n internal standard, hypo- or hyperdiploidy of aneuploid tumors cannot be established. Schutte’s method has been very effective, but it is important to analyze tumor and normal tissue separately prior to mixing the specimens. In the case of a diploid tumor, there is no need to analyze the normal tissue. However, another diploid block is usually analyzed to confirm homogeneity of the tumor. In the case of an aneuploid tumor, the patient‘s normal tissue is analyzed to assure a diploid normal prior to analyzing the mix. In a small (1.5%)percentage of cases, we have been unable to mix the patient’s normal and malignant tissue because the diploid peaks do not overlap, possibly because of differences in fixation that we cannot control using archival specimens. Since the inability to overlap diploid peaks is so infrequent, we feel justified in increasing the workload to improve the accuracy of our technique. We questioned why a 514-nm wavelength was not used routinely for PI-stained DNA analysis, since that is the optimal wavelength for red fluorescence excitation (8). Most studies use a 488-nm wavelength to perform single- and two-color analysis. After investigation of the differences between the two wavelengths, it was evident that there was less baseline debris between populations, and peaks were better defined at the 488-nm wavelength. Another limitation of flow cytometric DNA analysis is the subjective manner in which data are evaluated. Symmetric cursor placement (around a population) at one-half the maximum height of the peak is a n objective and reproducible way to analyze populations, and in turn serves to estimate the mean channel, CV, and SD. To improve the accuracy of the instrument, a calibration constant determined by the PI-stained thymocytes is initially established each day. This procedure is based on the mathematical assumption that the fluorescence intensity of cells in each compartment of the cell cycle is normally distributed, with the mean of the Gz and M (tetraploid) compartment having a channel location approximately twice that of the GI (diploid) compartment
(3). This calibration constant accurately determines the tetraploid population and will help to clarify the neartetraploid aneuploid populations. Finally, the development of a statistical analysis to validate a suspected aneuploid population limits the bias inherent in the viewer’s placement of the cursors around a region and improves our ability to detect small aneuploid populations (as low a s 3.1%) that may have been previously overlooked.
CONCLUSIONS The evolution of a technique to perform flow cytometric DNA analysis on paraffin-embedded tumors has benefitted studies relating prognosis to DNA content abnormalities. However, there is little consensus on the technique. Our group has critically evaluated several aspects of this procedure and found many ways to shorten, standardize, and objectify both the technique and results of flow cytometric DNA analysis. Even though DNA content abnormalities and their relation to prognosis in solid tumors remains in the research phase, we hope these technical advances and statistical analyses accelerate the definition of flow cytometry’s role as a prognostic indicator.
LITERATURE CITED 1. Bauer KD, Clevenger CV, Endow RK, Murad T, Epstein AL, Scar-
pelli DG: Simultaneous nuclear antigen and DNA content quantitation using paraffin-embedded colonic tissue and multiparameter flow cytometry. Cancer Res 46:2428-2434, 1986. a. Cohen AC: Estimating the mean and variance of normal populations from singly truncated arid doubly truncated samples. Ann Math Stat 21557-569, 1950. 3. Fried J Method for the quantitative evaluation of data from flow microfluorometry. Comput Biomed Res 9:263-276, 1976. 4. Hedley DW, Friedlander ML; Taylor Iw:Application of DNA flow cytometry to paraffin-embedded archival material for the study of aneuploidy and its clinical significance. Cytometry 6:327-333,1985. 5. Hedley DW, Friedlander ML, Taylor IW,Rugg CA, Musgrove E A Method of analysis of cellular DNA content of paraffin-embedded pathological material using flow cytometry. J Histochem Cytochem 31:1333-1335, 1983. 6. Martens ACM, van den Engh GH, Hegenbeek A: The fluorescence intensity of propidium iodide bound to DNA depends on the concentration of sodium chloride. Cytometry 2:24-25, 1981. 7. Schutte B,Reynders MMJ, Bosman FT, Blijham G H Flow cytometric determination of DNA ploidy level in nuclei isolated from paraffin-embedded tissue. Cytometry 626-30,1985. 8. Shapiro H M Practical Flow Cytometry. Alan R. Liss Inc., New York. 1985. 9. Stephenson RA, Gay H, Fair WR, Melamed MR: Effect of section thickness on quality of flow cytometric DNA content determinations in paraffin-embedded tissues. Cytometry 7:41-44,1986.