2014 5th IEEE PES Innovative Smart Grid Technologies Europe (ISGT Europe), October 12-15, Istanbul 1
Experience of Communication Problems in PLC-based AMR Systems in Finland Bashir Ahmed Siddiqui, Pertti Pakonen, Pekka Verho Department of Electrical Engineering Tampere University of Technology Tampere, Finland
[email protected] Abstract— According to Finnish legislation, at least 80% of the energy meters had to be remotely readable and provide hourly based data by the end of 2013. The expansion of AMR system has certainly set higher demand for the reliability of the communication link when hundreds of meters establish communication link with data concentrator. This paper discusses the architecture of different Automatic Meter Reading (AMR) systems and gives some insight to the level of conducted disturbances which may cause PLC communication problems in commonly used AMR systems. It also proposes potential solutions to overcome the PLC communication problems. On-site measurements have been carried out to study the behavior of different system in real networks with various electronic loads. The results indicate that large number of PLC links failed to operate in the field due to the high frequency noise generated by electronic loads at frequencies close to the PLC carrier frequency. The presence of high frequency disturbances in the PLC frequency range caused by customer loads obstructed the communication of AMR systems which is a matter of concern for DNOs. Index Terms— Power Line Communication, Automatic Meter Reading, High Frequency Interference, Switched-Mode Power Supply, Frequency Converter
I. INTRODUCTION The idea of sending communication signals over power line is as old as the telegraph itself. Power Line Communication (PLC) is currently an emerging technology, consequently gaining much attention for various applications such as Internet, home entertainment, home automation and enabling easy deployment of Automatic Meter Reading (AMR) systems which is of most interest because of its rapid growth in the recent era. The inherent communication infrastructure presented by power line makes it a favorable solution for AMR systems. PLC-based AMR system is a technology to gather and transfer data from energy meter to data concentrator using power line. It may also be used to update energy meter parameters or software or to control customer loads. Therefore, reliable operation of the AMR system is important. AMR systems using PLC network have been used in Europe since 1980s and is likely to increase in the context of improved energy services and efficiency [1].
In recent years, a large growth in the usage of electronic loads i.e. variable speed drives (VSDs), fluorescent lamp with electronic ballast, switch-mode power supplies (SMPS), uninterruptible power supplies (UPS) etc. have been observed in the power networks. All these devices use fast switching technique which produces high-frequency distortion in the distribution network. On the other hand, due to the introduction of remotely readable energy meters, power network is used increasingly as a communication medium in addition to the power distribution. The power lines were not designed for data transmission and as a result they exhibit unpredictable levels of channel noise, signal attenuation and distortion which seriously affect the performance of the communication system. In Europe, the available frequency range for PLC in low voltage (LV) network is regulated by CENELEC standard EN 50065-1 [2]. It specifies the allowed maximum frequencies and signaling levels in the LV network. However, standardization in the frequency range 3…150 kHz to limit the emissions by customer equipment is practically non-existent so far. This is one of the reasons why PLC may be disturbed by the emission of customer equipment. This paper discusses the architecture of different AMR systems installed in Finland which uses different MAC layer protocol. It also presents practical cases of disturbances found in the PLC-based AMR systems which affected the communication between energy meters and data concentrator. Additionally, it proposes some potential solutions to the interference problems. II.
COMMUNICATION TECHNOLOGIES USED BY FINNISH DNO S In April 2011, Tampere University of Technology (TUT) in co-operation with Finnish Energy Industry conducted a questionnaire to Finnish Distribution Network Operators (DNOs) to get an idea about the communication technologies used in the meter and the interference problems experienced so far, especially related to the PLC systems. A total of 18 Finnish DNOs having a total of 1 935 275 energy meters took part in the questionnaire which covers approximately 2/3 of the energy meters in Finland. At the time of the questionnaire, 847 071 meters were remotely readable which corresponds to
978-1-4799-7720-8/14/$31.00 ©2014 IEEE
2
44% of the meters covered by the questionnaire. A total of 13 DNOs answered the questionnaire concerning the communication technologies used by them. Fig. 1 depicts the share of different communication technologies used by individual DNO and in all DNOs (in total). This statistic covers a total of 769 578 energy meters in Finland. It is clearly visible that the share of energy meters using PLC was already during the survey very high and it was expected to increase to be the dominant communication technology by the end of 2013. A more detailed analysis of the questionnaire is presented in [3]. The survey clearly exhibits that PLC is the potential candidate for AMR systems in Finland. It also brings a challenge for AMR manufacturer to ensure reliable communication link between meter and data concentrator. 100% 90% 80% 70% Radio Meshnet MELKO PSTN RS GSM PLC
60% 50% 40% 30% 20% 10% DNO 10 DNO 11 DNO 12 DNO 13 DNO 14 DNO 15 In total
DNO 1 DNO 2 DNO 3 DNO 4 DNO 5 DNO 6 DNO 7 DNO 8 DNO 9
0%
Figure 1. Share of communication technologies used by different DNOs in energy meters.
III. AMR SYSTEM ARCHITECTURE AMR refers to the collection of data from electronic meters and then automatically transmit the collected data via communication medium without human intervention. A general AMR network consists of a master node (data concentrator) polling several slave nodes (energy meters) to collect data and transfer it to the central unit. The following section discusses most common modulation schemes as well as medium access control protocol used in AMR systems. A. Modulation Schemes Power lines exhibit highly variable and unpredictable levels of channel noise, signal attenuation and impedance. Furthermore, the permissible signal levels for communication defined by the European standard EN 50065-1 restrict the transmission power and limit the bandwidth. However, the standard does not specify which modulation technique should be used. Therefore, to achieve reliable communication in this potentially hostile environment, appropriate modulation scheme is necessary. Three commonly used digital modulation techniques for PLC are: 1) Frequency Shift Keying (FSK): The simplest form of frequency shift keying is binary FSK. BFSK uses two
discrete frequencies to represent logic 0 and 1. BFSK is widely used modulation scheme for communication over powerlines. This modulation technique is very resilient to narrow band interference [4]. 2) Phase Shift Keying (PSK): The most basic form of PSK is the binary PSK where logic 0 and 1 are represented by 180° phase shift. Platt [5] outlined that both BFSK and BPSK are robust yet simple but FSK scheme performs better over any phase delay introduced into the channel. 3) Orthogonal Frequency Division Multiplexing (OFDM): OFDM is a robust modulation technique proposed by Open PLC European Research Alliance (OPERA). OFDM techniques have offered great advantage in countering interference across signals, and are helpful for high-speed transmission in an environment of multipath and fading channels. Several systems based on different modulation schemes have been developed as discussed in [6]. Most vendors, however, do not specify the modulation schemes or other technical details of the PLC system in public documentation. However, one commercial product based on Spread FSK (SFSK) modulation and polling scheme is discussed here [7]. B. MAC Layer Protocol Many standardized or proprietary MAC layer protocols are available for AMR application. Despite the AMR systems widespread use, it is difficult to find information on medium access method used by different vendors. This section explains different routing protocol used in the AMR system. Many AMR systems employ a general polling/broadcast mechanism as a centralized medium access method. The polling protocol is based on automatic repeat request (ARQ) where messages are sent with an error detecting code following a timer for retransmission in case of failure [8]. When energy meter receives the polling message, it immediately transmits the data to the concentrator unit. It also transmits an acknowledgement (ACK) which indicates successful transmission as well as end of the transmission. In case of failure, energy meters keep repeating the retransmission procedure until reaching some predefined time period. This summarizes the polling mechanism of most common AMR systems installed in Finland. Recently AMR systems of a new routing protocol have been installed in Finland where both meter and data concentrator can initiate the communication. They use carrier sensing multiple access (CSMA) protocol where a node sense the carrier before transmitting on a shared transmission medium. The presence of carrier wave on the transmission medium is used to determine whether other nodes are transmitting because each access node connected to the network does not transmit any carrier wave except their own packet transmission. If the carrier wave is sensed on the communication channel, the channel is called ‘busy’ otherwise, it is ‘idle’. If the channel is sensed as idle, access node starts to communicate immediately. On the contrary, if the channel is sensed as busy, access node waits for the transmission in progress to get over before initiating its own transmission.
3
IV. MEASUREMENT METHODOLOGY All the measurements reported in this paper were made with a Rhode & Schwarz ESPI-3 test receiver/spectrum analyzer, ESH2-Z3 passive voltage probe and EZ-17 current probe. For practical reason, all measurements have been done with a resolution bandwidth of 1 kHz, which is a good tradeoff between adequate frequency resolutions and short sweep time for both 0…150 kHz and 0…1 MHz bands. The EMC standard defines the measurement bandwidth of 200 Hz for frequencies up to 150 kHz and 9 kHz for frequencies 150 …30 MHz [9]. In practice, 200 Hz bandwidth requires such a long sweep time even for 0…150 kHz band that it makes it impossible to make a single sweep measurement between the transmission bursts of the PLC system to identify underlying disturbance signals. In EMC standards, the emission limits are usually given for quasi-peak detector. However, peak detector has been used for measurements in this paper which is available in most spectrum analyzers. At pulse repetition frequencies of greater than 10 kHz, the measurements of quasi-peak and peak detector are within a range of a couple of dB [9] so the effect of different detector on results can be considered very small.
connected to that particular feeder. The current and voltage behavior of the conducted disturbances were measured at the main distribution board of the press. Fig. 2 shows the disturbance voltage signal with amplitude 66 dBμV present at approximately 71 kHz due to the switching frequency of the power supply. Fig. 3 shows the spectrum of the conducted current with and without the power supply connected to the network. It also shows the lower and upper PLC frequency. It is evident from the figure that the switching frequency is very close to the PLC carrier frequency of about 75 kHz. Although the amplitude level of the disturbance signal is not very high it blocked the communication. The AMR system based on CSMA protocol sensed this signal as a carrier wave, thus considered the channel as busy and never initiated the communication. After disconnecting the supply from the mains, the communication started immediately. 120 110 100
Switchin frequency of the power supply, approx. 71 kHz
90
Voltage [dBPV]
One advantage of using the latter system is that, in case of network reconfiguration (if a customer has to be fed from another secondary substation in case of network construction, services or black out) there is no need to re-configure the data concentrator unit for establishing connection with customer energy meter. Both meters and concentrator unit can establish connection with each other which is not the case with the former system. Regardless of different MAC layer protocol, both AMR systems have experienced PLC link failure.
80 70 60 50 40 30 2
DISTURBANCE CASES AND ON-SITE MEASUREMENTS OF E LECTRONIC LOADS
One of the most common sources of PLC disturbances in both the survey and the field measurements were found out to be the switched-mode power supplies (SMPS). SMPS have wide applications in various areas, mainly because of its low weight, smaller size, efficiency and wide input range tolerance. Frequency converters are also commonly used in ventilation system in block of flats where many AMR meters can be found. For example, ventilation fans use frequency converters and there may be frequency converters also in water circulating pumps of heating systems which may cause PLC reading problems. Authors investigated practical cases where customer’s equipment equipped with switching power supplies were producing narrowband interference in the frequency range 3…150 kHz which ultimately blocked the communication. One case is also investigated where frequency converters prevented the PLC reading of a large group of meters in a block of flats. Following section presents on-site measurement results carried out for different AMR systems to identify the source of disturbances. A. On-site Measurements of PC Power Supply Switched-mode power supplies are commonly found in personal computer and laptops. In this case, switching power supply of desktop computer in a printing press prevented the PLC communication of AMR meters for all the customers
4
6
8
Frequency [Hz]
10
12
14 4
x 10
Figure 2. Disturbance caused by single phase switched-mode power supply of desktop computer. Computer on, Average Computer off, Average
110 100 90
Current [dBPA]
V.
80
Switching frequency of the Power Supply, approx. 71 kHz
PLC signal
70 60 50 40 30 20
2
4
6
8
Frequency [Hz]
10
12
14 4
x 10
Figure 3. Frequency spectrum showing PLC and disturbance signals caused by switching power supply of desktop computer.
B. On-site Measurements of Ethernet Router The switching power supplies can cause significant amount of interference in the frequency range 0…150 kHz. In
4
this case intact power supply of Ethernet router found in a block of flats prevented the PLC communication of AMR meters. The current and voltage behavior of the conducted disturbances were measured at the feeding point of the main distribution board of the block of flats. Fig. 4 shows the voltage disturbance level of about 85 dBμV present at approximately 72 kHz. 120
Switching frequency of the power supply, approx. 72 kHz
110 100
Voltage [dBPV]
90 80 70 60 50 40 30 2
4
6
8
Frequency [Hz]
10
12
14 4
x 10
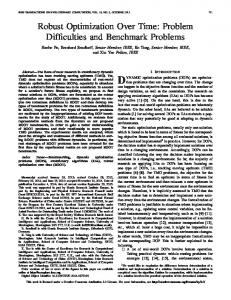
C. On-site Measurements of Cellular Base Station In this case interference was caused by 4G/LTE cellular phone base station switched-mode power supply which prevented the PLC communication of AMR meters which use simple polling protocol. All the measurements were performed at the main distribution board of the secondary substation close to the terminals of the concentrator. Fig. 6 shows the max hold measurements done with peak detector when the base station is on and off (also the PLC signals are shown in the figure). It also shows a single sweep measurement from a moment when the PLC-concentrator is not transmitting. With switched-mode power supply base frequency, about 44.5 kHz, the disturbance voltage measured with 1 kHz resolution bandwidth is about 104 dBμV and with second harmonic frequency, 89 kHz, the disturbance voltage is about 75 dBμV. The problem seems to be the second harmonic frequency which hits right between the PLC frequencies. Although the disturbance voltage is not very high but it was adequate to block the communication between meter and data concentrator. There have been several similar disturbance cases in Finland where data concentrator was unable to receive the signal from meters. 140
Figure 4. Disturbance caused by single phase switched-mode power supply of Ethernet router.
120
100 90 80 70 60 50 40
120 110
Ethernet on, Average Ethernet off, Average
PLC signal
100
Current [dBPA]
80 70 60 50 40 30 2
4
6
8
Frequency [Hz]
10
12
2
4
6
8
Frequency [Hz]
10
12
14 4
x 10
Figure 6. Cellular base station power supply noise voltage frequency spectrum.
Switching frequency of the power supply, approx. 72 kHz
90
Emission Peaks at 44.5 kHz & 89 kHz
110
Voltage [dBPV]
Fig. 5 shows the spectrum of the conducted current with and without the Ethernet router supply connected to the mains. Both PLC frequencies are also visible in the spectrum. The disturbance signal present at 72 kHz is again quite close to the upper PLC frequency of 75 kHz. Due to the presence of this signal, the CSMA protocol based AMR system did not initiate the communication at all considering the channel as ‘busy’. After disconnecting the router from the mains, the PLC communication started immediately.
Base station on, single sweep Base station & PLC, max hold Base station off, max hold
PLC Signal
130
14 4
x 10
Figure 5. Frequency spectrum showing PLC and disturbance signals caused by switching power supply of Ethernet router.
D. On-site Measurements of Frequency Converter In this case air ventilation frequency converters of a parking hall were interfering the PLC reading of newly installed AMR meters in a block of flats which also use polling protocol. The parking hall had six frequency converters (5.5 kW each) located in the main distribution room. Fig. 7 shows the disturbance voltage frequency spectrum measured at the main distribution board of the parking hall close to the secondary substation when all the frequency converters were on and off. Due to their high conducted disturbances the meter reading was blocked in several adjacent blocks of flats. It can be noticed from the figure that around the PLC frequency range, the disturbance voltage is slightly lower than at frequencies above 150 kHz but high enough to prevent the communication.
5
140
substation for monitoring high frequency phenomena in LV network. It can continuously monitor the LV network to identify the disturbance source. Due to the computation power of real-time monitoring device, the concept of wideband measurements could also be applied at secondary substation for other purposes for example, partial discharge monitoring and condition based maintenance of underground cable, cable accessories and transformers. These monitoring functions can play a vital role in improving the performance of the power systems by helping the operators in network planning and operation, fault location and maintenance.
All frequency converters on All frequency converters off
130 120
Voltage [dBPV]
110 100 90 80 70 60 50 40
PLC signal 1
2
3
4
5
6
Frequency [Hz]
7
8
9
10 5
x 10
Figure 7. The conducted interference voltage frequency spectrum when all frequency converters were on and off.
VI. POTENTIAL SOLUTIONS TO INTERFERENCE PROBLEMS So far, there are not many standards setting conducted emission limits for electrical apparatus in the frequency range 2…150 kHz. For example, IEC/EN 61000-6-3 sets limit only for frequencies below 2 kHz and above 150 kHz [10]. According to CISPR 11, the conducted disturbances of induction cooking appliances in the frequency range 50 to 148.5 kHz should be below 80 to 90 dBμV. Based on the measurements, it can be concluded that even conducted emission clearly smaller than those defined in CISPR 11 still interfered the PLC communication. One way to reduce the effect of disturbances is to install an EMC filter between the device causing the disturbances and the network. Although the commercially available EMC filters are often designed to attenuate conducted disturbances at frequencies above 150 kHz their attenuation is still relatively high at frequencies 60…95 kHz, where, for example, most of the AMR meter PLC systems operate. Standardization on the frequency range 2…150 kHz is currently under development and in that work the need of smart meter PLC should be taken into account. One possible solution is to define conducted disturbance limits low enough to guarantee the operation of AMR meter PLC systems on the whole frequency range. If it is not possible, another possibility might be to allow higher disturbance emissions at some frequencies not so relevant to PLC and to define lower limits only for the frequency range of e.g. 50…95 (or 148.5) kHz, at which most of the AMR meter PLC systems operate. Data concentrators are mainly located at secondary substations. It is clearly evident from the measurement results that the presence of high frequency noise close to data concentrator affects the PLC communication of a large number of meters. Measurement of high frequency components produced by, e.g., switch-mode power supplies and frequency converters is a challenge in the real-network because AMR systems are not capable of monitoring them. One solution from network operator end could be to add a real-time monitoring device as discussed in [11] at secondary
VII. CONCLUSION HF disturbances caused by different electronic loads are problem for the PLC signals. HF disturbances often originate in loads which use switching techniques and these products are increasing rapidly because of the advantages they offer. The switching frequencies of these products are in the same frequency range which is regulated by CENELEC for LV PLC communication. Many AMR systems vendors have introduced different MAC protocol to provide a reliable communication link. However, the used protocols have not been publically documented. In this paper, interference cases for AMR systems using CSMA as well as polling protocol were studied by on-site measurements. Both systems failed to offer reliable communication link already at a relatively moderate HF disturbance levels produced by electronic loads, specifically single phase switched-mode power supplies. The presence of HF disturbances close to PLC frequencies were interpreted as carrier wave by CSMA based AMR systems which resulted in silent mode but the communication was established as soon as the disturbance source was removed from the mains. Polling based AMR systems did not interpret the noise as carrier and tried to establish the communication but could not succeed due to the noisy channel. MAC protocol uses different error control method to check the consistency of the delivered message and to recover the data determined to be corrupted. In the studied cases, the system could not even use error detection scheme because of its failure while establishing the communication link. Based on the measurements, conducted disturbances even lower than those specified e.g. in CISPR 11 cause PLC malfunction in AMR systems regardless of the used MAC protocol. According to the questionnaire made to Finnish DNOs, it seems that by the end of 2013 approximately 30…50% of the approximately 3 million energy meters in Finland will use PLC communication in LV network. The deployments of smart meter using PLC have been already widely applied in other countries as well. Thus, it is important to maintain the network in a condition where the PLC system can operate successfully. REFERENCES [1]
"CENELEC SC 205A Mains Communication Systems, Study report on electromagnetic interference between electrical equipment/systems in the frequency range below 150 kHz," Doc. SC205A/Sec0260/R, April 2010.
6
[2]
Signalling on low-voltage electrical installations in the frequency range 3 kHz to 148.5 kHz. Part 1: General requirements, frequency bands and electromagnetic disturbances, CENELEC Standard EN50065-1, Aug. 2000. [3] P. Pakonen, M. Pikkarainen, B. A. Siddiqui, P. Verho, "Electromagnetic Compatibility between Electronic Loads and Automated Meter Reading System Using PLC," 22nd International Conference on Electricity Distribution CIRED, Stockholm, Sweden, June 2013. [4] I. H. Cavdar, "Performance Analysis of FSK Power Line Communications Systems over the Time-Varying Channels: Measurements and Modeling," IEEE Transaction on Power Delivery, vol. 19, no. 1, pp. 220-229, Jan 2004. [5] Platt, G., "Domestic Power Line Carrier Communications," Final year project thesis, Dept. of Electrical Engineering, University of Newcastle, Australia, October 1999. [6] Wong, S. K., Moghavverni, M., "A Robust System for Data Transmission over the Low Voltage Distribution Network," Proceedings of the Student Conference on Research and Development, Shah Alam, Malaysia, 2002, pp. 399-402. [7] P2LPC Data Concentrator, Iskraemeco, Energy Measurement & Management, Slovenia. [Online]. Available: http://www.iskraemeco.si/emecoweb/eng/products/bdf/P2LPCKoncentrator_ang.pdf [8] Josep M. Selga, Agustin Zaballos, Xavier Cadenas and Guiomar Corral, "Analytical modeling of polling in PLC-based AMR systems," IEEE INFOCOM06, Barcelona, 2006. [9] C.I.S.P.R. specification for radio interference measuring apparatus and measurement methods, C.I.S.P.R. 16 Second edition, International Special Committee on Radio Interference, 1988. [10] Electromagnetic compatibility (EMC) - Part 6-3: Generic standards Emission standard for residential, commercial and light-industrial environments, IEC Standard 61000-6-3 Ed. 2.0, June 2006. [11] Bashir Ahmed Siddiqui, Pertti Pakonen, Pekka Verho, "A novel device for real-time monitoring of high frequency phenomena in CENELEC PLC band," Journal of Smart Grid and Renewable Energy, vol. 3, pp. 152-157, May 2012.