Prasad Calyam, Abdul Kalash, Neil Ludban, Sowmya Gopalan,. Siddharth Samsi, Karen Tomko, David E. Hudak, Ashok Krishnamurthy. Ohio Supercomputer ...
Fourth IEEE International Conference on eScience
Experiences from Cyberinfrastructure Development for Multi-user Remote Instrumentation Prasad Calyam, Abdul Kalash, Neil Ludban, Sowmya Gopalan, Siddharth Samsi, Karen Tomko, David E. Hudak, Ashok Krishnamurthy Ohio Supercomputer Center, 1224 Kinnear Road, Columbus, OH 43212 {pcalyam, akalash, nludban, sgopalan, samsi, ktomko, dhudak, ashok}@osc.edu
Abstract— Computer-controlled scientific instruments such as electron microscopes, spectrometers, and telescopes are expensive to purchase and maintain. Also, they generate large amounts of raw and processed data that has to be annotated and archived. Cyber-enabling these instruments and their data sets using remote instrumentation cyberinfrastructures can improve user convenience and significantly reduce costs. In this paper, we discuss our experiences in gathering technical and policy requirements of remote instrumentation for research and training purposes. Next, we describe the cyberinfrastructure solutions we are developing for supporting related multi-user workflows. Finally, we present our solution-deployment experiences in the form of case studies. The case studies cover both technical issues (bandwidth provisioning, collaboration tools, data management, system security) and policy issues (service level agreements, use policy, usage billing). Our experiences suggest that developing cyberinfrastructures for remote instrumentation requires: (a) understanding and overcoming multi-disciplinary challenges, (b) developing reconfigurable-and-integrated solutions, and (c) close collaborations between instrument labs, infrastructure providers, and application developers.
I. I NTRODUCTION Increased access to high-speed networks has made remote access of computer-controlled scientific instruments such as microscopes, spectrometers, and telescopes widely-feasible over the Internet. Some of these instruments are extremely expensive and their purchase costs several hundred-thousand dollars. Hence, remote instrumentation (RI) allows remote users to utilize these instruments when they are not being used by local users. In addition, routine maintenance and operation of these instruments requires significant investment in staffing. By cyber-enabling these instruments for RI, instrument labs can charge for remote access on an hourly-usage basis to obtain a greater return-on-investment on their instruments. When used for research and training purposes pertaining to e.g., materials modeling or biological specimen analysis, these instruments generate large amounts of raw and processed data. The data corresponds to low-to-high resolution images, and text files that range from a few hundred KB to several GB. Using cyberinfrastructures that include webportals, networking, storage, and computation: (a) the RI workflows involving instrument technicians and remote users can be streamlined, and (b) an unified interface can be developed for data annotation coupled with archival at mass storage systems. The archived data can subsequently be retrieved for analytics that involves computation and visualization. The processed data can in turn be archived at mass storage systems. Thus, cyberinfrastructures for RI not only provide “at-theinstrument” experience for remote users, but also enable them to efficiently manage distributed resources over the Internet. *This work has been supported in part by the Ohio Board of Regents.
978-0-7695-3535-7/08 $25.00 © 2008 IEEE DOI 10.1109/eScience.2008.58
Assuming a sample has been shipped to an instrument lab and has been loaded into the instrument, there are two basic RI work-flows. The first work-flow is called remote observation, where a remote user or multiple remote users only view the instrument-control software screens in real-time. For this, they use desktop-sharing applications that could be any of the variants of Virtual Network Computing (VNC) solution [1] - [4]. The remote user(s) could interact with an operator physically present at the instrument over a telephone, VoIP call or videoconference to perform all the control actions. The second work-flow is called remote operation, where a remote user or multiple remote users view the instrumentcontrol software screens and also control the instrument in real-time using any of the VNC solutions. The multiple remote users could be geographically dispersed members of a virtual community. They can be students obtaining hands-on training, or researchers - each with unique expertise - jointly analyzing the sample under study. Successful implementation of these work-flows generally requires web-based tools and secured high-speed networks. The webbased tools include web-portals that manage for e.g. user accounts, instrument scheduling, data repositories, and communications featuring voice/video/text. Secured high-speed networks include a well-designed network at the instrument lab to avoid compromise of resources by intruders and adequate bandwidth provisioning between the instrument and remote user sites. There are several efforts that have aimed at developing cyberinfrastructures for serving the RI needs of researchers and students. Gemini Observatory [5] is an initiative that uses Internet2 to allow remote researchers to manipulate their twin telescopes. NanoManipulator [6] is another initiative that uses Internet2 to allow remote control and visualization of images from their scanning probe microscopes. The Stanford Synchrotron Radiation Laboratory [7] has a highly successful RI service for researchers involved in macromolecular crystallography using beam lines. Notable education outreach programs such as Japan NIMS [8] and UIUC Bugscope [9] have been developed, where remote microscopy is being made accesible to several high school students. The remote microscopy in these efforts involves remote observation and operation of samples (e.g. insects, plants, and metals) that have been pre-loaded at a scanning electron microscope. Moreover, web-services and middleware frameworks such as [10] and [11] have been developed to increase interoperability and extensibility of cyberinfrastructure resources for RI. Besides such past efforts, several instrument labs are seeking cyberinfrastructures for RI to derive the inherent benefits. Also, they are being mandated to cyber-enable their instruments by funding agencies such as the National Science Foundation who want to avoid duplications in instrument investments [12].
293
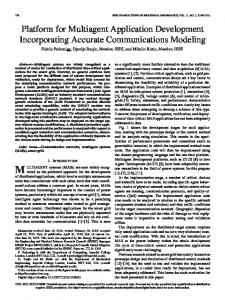
Ohio Supercomputer Center (OSC) is leading a pilot RI program in partnership with instrument labs at The Ohio State University (OSU) and Miami University (MU). The goal of this pilot program is to develop a cyberinfrastructure that supports RI efforts leveraging OSC’s software development expertise, state-wide fiber-optic network viz., OSCnet, high performance computing, and mass data storage resources. In this paper, we describe our experiences in developing and deploying a cyberinfrastructure that aims to satisfy the technical and policy requirements of multi-user RI for research and training purposes. Specifically, we provide detailed descriptions of two notable solutions we are developing: (i) Remote Instrumentation and Collaboration Environment (RICE) - for desktop sharing and multi-user collaboration during a RI session, and (ii) Remote Instrumentation Web-portal (RI webportal) - for multi-user RI session setup, experiment progress monitoring and data management. In addition, we present our deployment experiences of commerical/open-source solutions as well as our custom solutions using three instrument-specific case studies: (i) Scanning Electron Microscopy, (ii) RamanFTIR Spectroscopy, and (iii) Nuclear Magnetic Resonance Spectroscopy. In these case studies, we detail some of the technical and policy challenges we had to address. The technical challenges include bandwidth provisioning for optimum last-mile user experience, collaboration tools involving voice, video and text video communications, data management, and system security. The policy challenges include service level agreements, use policy, and usage billing. The remainder of this paper is organized as follows: Section 2 lists the salient RI requirements for research and training purposes. Section 3 describes the RICE and RI web-portal solutions that we are developing to support the RI requirements. Section 4 describes three case studies that convey our solution deployment experiences. Section 5 concludes the paper and suggests future work. II. R EMOTE I NSTRUMENTATION R EQUIREMENTS In this section, we list the salient technical and policy requirements for RI that we gathered while working our instrument lab partners at OSU and MU. A. Technical Requirements 1) Bandwidth Provisioning: Every instrument has unique control software with variations in the screen content and control actions. Consequently, the end-to-end bandwidth demands between the instrument site and remote user site are different for each instrument to be usable by a remote user. Figures 1(a) and 1(b) show examples of control software screens that have live video feed, and text-and-graph content, respectively. Transferring optimum quality screen images in real-time from the instrument to be usable for a remote user requires end-to-end bandwidth amounts that need to be quantified with usability studies. In addition, if the control software is interactive, some amount of end-to-end bandwidth needs to be dedicated for the control traffic depending upon the level of interactivity. Further, if multiple remote users are expected to simultaneously connect to an instrument, appropriate bandwidth has to be provisioned at the intermediate routers for the instrument traffic flows. 2) Collaboration Tools: For remote observation and operation work-flows, in addition to using VNC, the instrument technician and remote users need to be able to effectively communicate with each other. For this, collaboration tools that support “peer-to-peer voice/video” or “voice/video conferences”
(a) Screen with live video feeds Fig. 1.
(b) Screen with text-and-graph
Video activity levels in instrument control screens
combined with “text-chat” are useful. In the multi-user session case, collaboration tools need to support a “presence” feature, which indicates who is controlling/viewing the session. In addition, the operator must have the ability to manage control privilege amongst the remote users i.e., operator must be able to grant or revoke control such that only one remote user controls the instrument at any time. Furthermore, web-camera video that is accessible via web-browsers to the remote users can provide a “surveillance” feature, which allows remote users to view the instrument lab personnel or instrument status (e.g. device display panels, sample holder). 3) Data Management: During an RI “session” where a sample is being analyzed, experiments are run and data sets (i.e., images or text files) are generated. The analysis could involve visual inspection of the sample coupled with image captures or experiment configuration script(s) invoked to generate text files. Several related sessions commonly correspond to a “project” involving one or more samples. The data archival must handle metadata and provenance of the data sets e.g., session timestamp, session owner(s), study context, or project name; such information can be user-specified or parsed from experiment configuration script(s). Given that instrument computers are shared resources with limited storage capacities, instrument labs generally transfer the data sets of their users to mass data storage systems. The archived data sets thereafter must be searchable and downloadable for analytics involving computation and visualization. The user interface for data archival and retrieval could involve applications such as secure-shell (SSH), web-portals (HTTPS), or web-services with standardized interfaces. 4) System Security: Given the ever increasing cyber-attack threats on the Internet, securing both the network in which the instrument resides, as well as the data sets of the instrument users is vital. On one hand, securing the network involves restricting the accessibility of the network ports to the instrument lab computers from other networks on the Internet. The basic TCP ports that need to be selectively opened (using for e.g., firewall rules) to computers on the Internet include: (i) port 5900 for VNC desktop clients, (ii) port 80 for VNC’s and webcamera’s web-browser clients, (iii) port 22 for SSH, and (iv) port 443 for HTTPS. In addition, if voice and video calls need to be facilitated from the instrument lab, TCP port 1720, and a range of UDP ports (vendor-specific) need to be opened. On the other hand, securing the data sets involves authenticating and restricting file system access on the instrument computer with the appropriate read, write and execute permissions. The permissions are applicable for the instrument users, as well as the remote computers that transfer instrument data sets onto a mass data storage system.
294
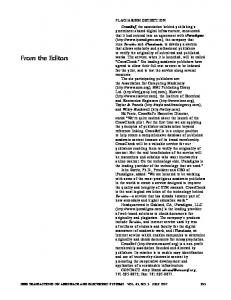
B. Policy Requirements 1) Service Level Agreements: The three primary stakeholders involved in developing and maintaining cyberinfrastructures for RI are: (i) instrument labs, (ii) infrastructure providers, and (iii) application developers. The infrastructure providers offer services and technical support for networking, data storage and computation to the instrument labs, and also include groups responsible for physical facilities. The application developers build and customize software/hardware to address the RI requirements. They could refer to the instrument vendors or third-party vendors that utilize and integrate the instrument lab and infrastructure provider resources. Given the multi-disciplinary issues involved in supporting multiuser RI, the instrument labs need to establish Service Level Agreements (SLAs) with both the infrastructure providers and application developers for routine RI operations and on-going maintenance. The SLAs serve as a mechanism to convey expectations and identify groups responsible for development and upkeep of the RI cyberinfrastructure components. 2) Use Policy: Given that the use-time of scientific instruments is valuable and there are security/privacy issues involved in RI, instrument labs should maintain a “Use Policy” document. This document could describe use policies such as: (a) considerations for obtaining user accounts for remote observation/operation and/or data management, (b) scheduling priorities for local/remote users, (c) guidelines to enable/disable remote observation/operation to avoid remote users violating privacy of local users working on the instrument, (d) privileges for expert/novice users in single-user as well as multi-user RI sessions, and (e) procedures for fail-safe to recover from cases where local/remote users become incapacitated during an RI session. These use policies can then be used by application developers to build the necessary software components to implement the use policies and maintain audit-trails of usage, and problem scenarios in routine RI operations. 3) Usage Billing: In addition to the high-cost involved in initially acquiring expensive scientific instruments, substantial costs are involved to maintain the instrument equipment whose life-span can range upto ten years. These costs include the remuneration of personnel responsible for the routine operations of the instrument as well as the fees for physical facilities, networking, storage and computation resources. Hence, appropriate “resource units” need to be defined for use-time of the instruments. The usage billing can then account for the fees (e.g. fee/hr, fee/session) corresponding to the resource units consumed. Given that an RI session setup or remote observation generally requires additional efforts on part of the instrument operator, setup and operation surcharge fees could be included in the usage billing. III. R EMOTE I NSTRUMENTATION S OLUTIONS In this section, we describe the solutions we are developing to support the RI requirements listed in Section 2. First, we describe the features of our RICE solution. Following this, we describe the features of our RI web-portal solution. A. Remote Instrumentation Collaboration Environment RICE is based on the Ultra VNC solution [1] for the Windows operating system but has several enhancements on both the client and server sides. The enhancements are customizable and are targeted to handle collaborative tasks such as voice conferences and text-chat between multiple participants during RI sessions in a self-contained manner. Figure 2 shows the
Fig. 2.
RICE in an active multi-user session
RICE client software [13] in an active multi-user session on a cyber-enabled Raman-FTIR microprobe at the OSU’s Department of Chemistry. RICE supports features such as: video quality adjustment slider, VoIP, text-chat, multi-user presence, network health monitoring, and remote dual-screen resolution. The video quality adjustment slider is used to manually adjust frame rates and video encoding rates to suit the end-to-end network bandwidth between the remote user site and instrument lab. To handle peer-to-peer VoIP as well as VoIP conferences, the open-source Ohphone and OpenMCU solutions [14] have been integrated into RICE. We developed a text-chat feature in RICE using a custom session signaling protocol (SSP). The text-chat uses colored text to distinguish messages of the local user from the remote users. The self-contained VoIP and text-chat features are useful for the participants to communicate control-lock exchanges and other messages in an RI session. The SSP protocol is also used to provide the multi-user presence feature that displays and updates in realtime, the names and roles of the users connected. The presence feature is coupled with a control-lock passing feature that grants instrument control to a single user at any given instant. The restrictions are enforced based on the user roles in an RI session: “administrator”, “viewer” or “controller”. By default, the administrator always has control privileges, and has the ability to pass another session control-lock to any one of the viewers. A remote user who is a controller can directly pass the control-lock to any other remote user via the RICE client interface, without intervention of the administrator. The network health monitor in RICE shows real-time network status in terms of round-trip delay and loss metrics. The network status grades indicated by a traffic light graphic are: “Good” (green color), “Acceptable” (amber color), and “Poor” (red color). The monitoring is coupled with a network performance anomaly detection scheme that is based on the “plateaudetector algorithm” [15]. Once an anomaly is detected, RICE warns and blocks users control-actions during impending and extreme network congestion periods, respectively. Thus, the control status can be either “open”, “warning”, or “blocked” depending on the network congestion levels. The motivation for this feature in RICE is as follows: if adequate end-to-end bandwidth is not provisioned, network congestion may result that causes time-lag and packet drop events, which impair the
295
Fig. 3.
Problem with dual-screen resolution with Ultra VNC
Fig. 4.
Increased dual-screen resolution with RICE
Fig. 6.
control software screen images at the remote user end. This inturn could lead to improper user control of the instruments mechanical moving parts. Such improper user control may ultimately result in physical equipment damages that are prohibitively expensive to fix. Although ‘limit switches’ in some well-designed instruments mitigate damage due to such user error, there are always unexpected cases where such limit switches may not be effective. The remote dual-screen resolution feature allows a remote user to mimic an extended desktop setup with dual-monitors at the instrument computer. The extended desktop provides additional real-estate for users to run multiple application programs simultaneously. The openly-available Ultra VNC distribution does not support dual-screen resolution at the remote VNC client as shown in Figure 3. We developed a software-patch for the Ultra VNC in RICE that increases the display resolution geometry to successfully render the dual-screen resolution at the remote VNC client as shown in Figure 4. B. Remote Instrumentation Web-portal Our RI web-portal components are being built using the Pylons Python web framework [16] with customizations for handling user accounts, remote observation/operation, experiment setup/progress-tracking, and data management. The RI web-portal also integrates the RICE solutions customized for different instruments. Figure 5 shows the RI web-portal architecture. The portal interface comprises of: (a) web-pages that allow managing user accounts of the technician(s) as well as the remote users, and (b) web-pages that enable the operator(s) and remote users to request various application service processing. The application service processing corresponds to: turn ON/OFF remote observation/operation, RICE client/server download, new experiment configuration setup, experiment progresstracking, instrument technician and remote user communications, and viewing accounting/monitoring logs for usage billing. The application service interacts with the data service for data storage at OSC’s mass storage system, and data retrieval through the web-portal. Similarly, third-party analysis clients such as Matlab or TopSpin can be made to interact with the data service for analytics-driven data retrieval and
Remote instrumentation web-portal states
processed data storage. We plan to develop web-services that will allow applications using standardized remote instrumentation middleware-frameworks such as [10] and [11] to interface with our data service. In addition, we are developing a web-portal component to handle the collaboration tools functionality for text-chat, multiuser presence and control-lock passing through the web-portal interface. This component is useful in cases where firewalls at remote sites block the SSP messages from the RICE server to the RICE clients. In such cases, the RICE clients can still provide the multi-user collaboration tools functionality by interacting with this web-portal component. Figure 6 shows the RI web-portal states to create and view instruments, projects and sessions. Some of the session states are common to both the instrument technician and the remote user(s). The other session states applicable only to the instrument technician are shown in dotted lines. Upon user login, all the instruments supported by the web-portal are listed. Once a particular instrument is selected, both the past as well as the current projects and related RI sessions are listed. If a particular session of a project is selected, data sets corresponding to the session experiments are shown. Only the instrument technician has the privileges to create new instruments, projects and sessions in the web-portal. Before creating a new session, the instrument technician is assumed to have taken the following steps: (i) instrument technician has obtained the experiment configuration from one or more remote users, (ii) an RI session has been scheduled on the instrument calendar and RICE client download instructions have been sent to the remote user(s), and (iii) the remote user sample has been loaded into the instrument at the scheduled time for the session. At this point, the instrument technician enters the project/session details into relevant forms in the web-portal. Thereafter, the instrument technician is prompted to turn ON the RICE server at the instrument side from the web-portal. Once the RICE server has started, the remote users can connect to the instrument using their RICE clients and observe/operate the instrument control-software screens using the control-lock passing. The instrument technician is also allowed to update the progress of the experiment in the web-portal for the remote users to monitor the experiment progress. Such remote monitoring is particularly useful when experiments could last for several hours or even days. After
296
Fig. 5.
Remote instrumentation web-portal architecture
the session is completed, the instrument technician is prompted to turn OFF the RICE server. Now, the RICE client sessions expire and the remote users will no longer be able to reconnect to the RICE server with the previous session credentials. Subsequently, a data transfer is automatically initiated to copy the experiment data from the instrument computer to the mass data storage system at OSC. The instrument technician and remote users can view and download the transferred experiment data via the web-portal. IV. R EMOTE I NSTRUMENTATION C ASE S TUDIES In this section, we present three case studies that describe our deployment experiences of commerical/open-source solutions as well as our custom RICE and RI web-portal solutions to address the RI requirements listed in Section 2. A. Scanning Electron Microscopy The first case study relates to our experiences with cyberenabling a Scanning Electron Microscope (SEM). Specifically, we describe our deployment experience of ThinkLogical’s Keyboard, Video, and Mouse over IP (KVMoIP) appliance solution [3] to connect to the SEM from different LAN locations and Internet locations. We also describe our early efforts in developing an analytics service in our RI web-portal for automated image processing of several SEM images using Matlab. Our partner in this case study is the Center for Accelerated Maturation of Materials (CAMM) at OSU’s Department of Material Science and Engineering. CAMM has acquired some of the world’s most powerful scanning and transmission electron microscopes for analysis and modeling of material compostions. As part of CAMM’s Visualization, Instrumentation and Modeling (VIM) program [17], CAMM uses OSCnet to allow remote industry and defense lab collaborators to access their instruments. 1) KVMoIP Appliance Deployment: We deployed ThinkLogical’s KVMoIP appliance solution at the SEM and conducted two sets of usability studies with actual SEM users. This solution requires installing a KVMoIP appliance at both the SEM side (located at OSU’s main campus in Columbus, OH) and the remote user side. The first set of usability studies were conducted under different LAN conditions: (i) GigE LAN (remote user with a direct connection to the SEM), (ii) Isolated LAN (remote user at a different room in the same building as the SEM), and (iii) Public LAN (remote user in a different building on the OSU campus). Detailed results
Fig. 7.
Matlab-based image processing tool
of this usability study are described in [13]. In essence, we observed that KVMoIP solutions that require appliances at both the instrument side and remote user side produce very high image quality. This can be attributed to their dedicated FPGAs for video processing of the instrument control-software screens (SEM’s control-software screen shown in Figure 1(a)). However, they consume enormous amounts of bandwidth for good remote operation experience (quantified by user opinion). Specifically, their end-to-end bandwidth requirements are in excess of 25 Mbps depending on the spatial and temporal changes in the images. The second set of usability studies were conducted from remote locations on the Internet: (i) Demonstration floor at the 2006 Supercomputing Conference in Tampa, FL, (ii) Demonstration floor at the 2006 Internet2 Fall Member Meeting in Chicago, IL, and (iii) Conference room at Stark State Community College in Canton, OH. For good remote operation experience, we had to co-ordinate with the technology infrastructure groups at OSU and the remote locations. In the co-ordination, we had to ensure that there were no rate-limit bottlenecks, and that the remote observation session traffic was not disrupting other users’ application traffic. Good remote operation experience was observed even when end-to-end network measurements indicated bottleneck hop-bandwidth of approximately 45 Mbps and peak round-trip delay of 60 ms on the network paths. There was also an instance in the Canton usability study, where good remote operation experience was observed when a network fault caused 20% packet loss over a prolonged duration. In this case, we concluded that this network fault impact was offset by the adequate end-to-end bandwidth available between the Canton and SEM sites.
297
Fig. 9.
Fig. 8.
Cyber-enabled Raman-FTIR spectrometer at OSU
2) Matlab Image Processing: Images collected from SEMs are each typically 10-15 MB in size, and most high resolution images are relatively larger in size. Frequently, multiple images of the sample regions are analyzed to isolate characteristic features or to construct 3D views of sample surfaces. Analyzing batches of images involves applying a sequence of image processing filters (e.g. blurring/de-blurring, dilation/opening) that take several hours or even days to complete. The completion times depend upon the nature and number of the filters. Existing analyses at CAMM are being done using Adobe Photoshop (with Fovea Pro 4 plug-in) filters. OSC has begun a study to develop more efficient methods of image processing using Matlab’s Distributed Computing Server and the Parallel Computing Toolbox. The goal of this study is to achieve faster image processing using Matlab-based image processing filters that leverage OSC’s computational resources. Figure 7 shows a prototype implementation of an interactive Matlab image processing tool being developed at OSC that is used offline to determine the appropriate set and sequence of filters for a particular analysis. Once the filters are identified, they are input to concurrent Matlab processes running on multiple CPUs such that each process analyzes a subset of the entire image set. In addition to reducing computation time, the added advantage of deploying such filters is that they can be integrated into the RI web-portal being customized for managing SEM image datasets. B. Raman-FTIR Spectroscopy The second case study relates to our experiences with cyber-enabling a Raman-FTIR Spectrometer. Specifically, we describe the deployment experience of two variants of our RICE solution in a LAN environment. We also describe our RICE testing from a remote location on the Internet with a last-mile wireless network connection. Our partner in this case study is the OSU’s Department of Chemistry (OSU Chemistry), who recently acquired a RamanFTIR Spectrometer through an NSF CRIF:MU program [12] grant. The Raman-FTIR Spectrometer is shown in Figure 8 and is being used for joint Raman and FTIR spectroscopies on the same spot of any sample. The instrument control computer has advanced network and multimedia cards, and is operated using a dual-monitor setup. Further, the surveillance feature is being supported using a 4XEM web-camera that can be remotely controlled using a built-in web-interface. As part of their grant, OSU Chemistry is using OSCnet to allow their collaborators at California State University, Dominguez Hills and Oakwood University, Huntsville to access their RamanFTIR Spectrometer.
Local overlay error message upon remote RICE client reset
We deployed our RICE solution on the Raman-FTIR Spectrometer (shown in Figure 2) and conducted several sets of LAN tests. One set of LAN tests we completed successfully involved running the RICE clients using both “Administrator” and “General” login accounts on computers with Windows XP as well as Windows Vista operating systems (OS). In addition, we successfully tested the RICE clients in a LAN using both 32-bit as well as 64-bit Windows Vista OS computers. Although there were no major OS portability issues, we faced several display related problems. One of the major problems was the Ultra VNC problem with dual-screen resolution that we discovered and resolved as explained in Section IIIA. Another display problem occured when the instrument computer and remote computer resolutions did not match. This resulted in visible gray regions in the RICE client in both full-screen and dual-screen modes. Also, sometimes the RICE client had refresh problems due to the limitations in the Ultra VNC auto-refresh implementation. We devised a “reset” feature in RICE that disconnected and reconnected the RICE client without affecting the collaboration tools features. Although this solved the refresh problem on the RICE client side, a new overlay error message problem arose on the instrument computer (RICE server side) as shown in Figure 9. The error message grayed-out the instrument camera feed, whose restoration required restarting the instrument controlsoftware application. This problem was determined to be due to the instrument vendor implementation of the instrument control-software, and the instrument vendor was notified to provide a problem resolution. We noted that this problem is one of the many problems that the instrument vendors are facing with their instruments being increasingly cyber-enabled, unlike in the past. We discovered another interesting display problem when using the Ultra VNC solution on certain kinds of microscopes at OSU Chemistry and at the MU Electron Microscopy Facility. Figure 10 shows this problem, which we refer to as the “pink-screen” problem that is caused by the Graphical Processing Unit (GPU) in the instrument computer. The GPU processes the instrument’s in-built-camera video feeds without the knowledge of the instrument computer OS. Given that the Ultra VNC relies on the instrument computer OS to update the video feed region, the pink screen problem arises. Further investigation suggested that this problem does not occur with the instrument software because their software interacts with the GPU to read the video feed separately and overlays atop the instrument control panels. We overcame this problem in RICE by developing a variant that is based on the Real VNC solution [2] coupled with the Adder KVMoIP appliance [4]. The Adder KVMoIP appliance is different from the ThinkLogical KVMoIP appliance described in Section IVA because it requires installing the KVMoIP appliance only at the instrument side. On the remote user side, any Real VNC based client can connect to the KVMoIP appliance.
298
Fig. 10.
“Pink-screen” GPU problem
Fig. 12.
Fig. 11.
RI cyberinfrastructure deployment for MU NMR
Besides solving the pink screen problem, the added advantages of this RICE variant are: (a) RICE server previously was functional only with Windows OS at the instrument side, but now can function independent of the OS on the instrument side, and (b) No software installation is necessary on the instrument computer and thus the instrument CPU is not used for processing RICE client connections. We also tested RICE from the Demonstration floor at the 2008 Cyber-enabled Instruments Workshop in Arlington, VA. Before the demonstration, we had to co-ordinate with the technology infrastructure group at OSU for opening up the necessary network ports. The last-mile network connectivity at the workshop was a wireless network connection. The fullscreen mode and collaboration tool features of RICE such as VoIP call and text-chat response times worked well without any problems. However, the dual-screen mode of RICE consumed most of the access bandwidth, which resulted in poor remote control experience of the Raman-FTIR Spectrometer. C. Nuclear Magnetic Resonance Spectroscopy The third case study relates to our experiences with cyberenabling a Nuclear Magnetic Resonance (NMR) Spectrometer. Specifically, we describe our deployment experience of the RI web-portal integrated with RICE. Our partner in this case study is MU’s Department of Biochemistry (MU Biochemistry), who recently acquired an 850 MHz NMR spectrometer through grants from both NSF and the Ohio Board of Regents. This NMR purchase is the first of its kind at an institution in the United States and is
Experiment setup in MU-NMR web-portal
being used to study protein structures and complexes, ligand binding thermodynamics, and metabonomics of biofluids. As part of their grants, MU Biochemistry is using OSCnet to allow their collaborators at Bowling Green State University, Ohio University, Muskingum College and Talawanda High School to access their NMR Spectrometer. Our RI cyberinfrastructure deployment for the MU NMR is shown in Figure 11. In this deployment, we use the RICE variant based on the Real VNC solution. The RICE client can be downloaded from our RI web-portal that is being customized to suit the MU NMR lab policies related to user accounts, user privileges and data management. Figure 12 shows experiment setup web-page of the MU NMR web-portal whose functionality has been explained earlier in Section III-B. The RICE client can be used for remote observation/operation of the TopSpin computer that controls the NMR electronics. The web server hosted at OSC interacts with a “data cache server”. This server is used to enable the instrument technician at MU to transfer the experiment data from the NMR to OSC’s mass data storage upon experiment completion. Network security issues have been addressed to allow only restricted access from OSC and remote user computers to the MU NMR lab. However, the OSC hosted web-portal is open to the Internet. Given such a deployment of OSC equipment at MU, we had to co-ordinate with the MU campus technology infrastructure group regarding on-going system maintenance and security considerations. V. C ONCLUSION In this paper, we described our experiences in developing a cyberinfrastructure for multi-user RI by partnering with renowned instrument labs at OSU and MU. We detailed both the technical and policy issues involved in RI cyberinfrastructures. We also described how we are developing and deploying RI solutions such as RICE and the RI web-portal to cope with many of these issues. In addition, we discussed our deployment experiences relating to bandwidth consumption, and display issues with off-the-shelf VNC solutions and instrument-control software. To successfully reap the benefits of RI for research and training purposes, we showed that several multi-disciplinary challenges need to be addressed. The multi-disciplinary challenges spanned areas that include instrument administration, networking, computer systems, software engineering,
299
databases, computation, economics, and governance. Using a case study approach, we showed how the deployment of our RI solutions required their design to be customizable to suit the needs of different instrument labs. Further, we showed that extensive co-operation between personnel at instrument labs, infrastructure labs and application developers was necessary at every step of the cyberinfrastructure development and deployment. Our future work is to enhance the feature set and customizability of our RI solutions. Some of the open issues that remain in our study relate to handling the policy issues of the instrument labs. We hope these open issues will be resolved as we have more deployment experiences supporting large numbers of RI users. Building upon the experiences and RI solutions described in this paper, our aim is to develop a robust cyberinfrastructure that leverages OSC’s state-wide resources and the instrument investments - to improve user convenience and significantly reduce costs. ACKNOWLEDGEMENTS We thank Dr. Peter Collins, Daniel Huber, Robert Williams, and Prof. Hamish Fraser of OSU CAMM for their testbed participation, RICE and web-portal features development inputs, and sample graphics. We also thank Gordon Renkes of OSU Chemistry for testbed participation, RICE features development inputs, and screenshots of RICE in active sessions. Further, we thank Prof. Michael Kennedy, Aaron Goodpaster and Dr. Keyang Ding of MU Biochemistry for their testbed participation, and RICE and web-portal features development inputs. Finally, we thank the following OSC staff members for their discussions and contributions in the RI cyberinfrastructure development: Manirupa Das, Dr. Thomas Bitterman, Ramya Gopalan, Dr. Steve Gordon, Terry Lewis, James Gregory, and Liusong Yang. R EFERENCES [1] [2] [3] [4] [5] [6] [7] [8]
[9] [10]
[11] [12] [13] [14] [15] [16] [17]
Ultra VNC - http://www.uvnc.com Real VNC - http://www.realvnc.com Thinklogical KVMoIP Appliance - http://www.thinklogical.com Adder KVMoIP Appliance - http://www.adder.com K. Hodapp, J. Jensen, E. Irwin, et. al., “The Gemini Near-Infrared Imager (NIRI)”, Journal of the Astronomical Society of the Pacific, 2003. K. Jeffay, T. Hudson, M. Parris, “Beyond Audio and Video: Multimedia Networking Support for Distributed, Immersive Virtual Environment”, Proc. of EUROMICRO, Pages 300-307, 2001. Stanford Synchrotron Radiation Laboratory (SSRL) http://www2.slac.stanford.edu/vvc/ssrl.html K. Furuya, M. Tanaka, K. Mitsuishi, N. Ishikawa, A. Tameike, M. Date, A. Yamada, Y. Okura, “Public Opened Internet Electron Microscopy in Education Field”, Microscopy and Microanalysis Conference, Volume 10, Pages 1566-1567, 2004. UIUC Bugscope Project - http://bugscope.beckman.uiuc.edu I. Atkinson, D. Boulay, C. Chee, et. al., “Developing CIMA-based Cyberinfrastructure for Remote access to Scientific Instruments and Collaborative E-research”, Proc. of ACM International Conference Series, Volume 249, Pages 3-10, 2007. T. Molina, G. Yang, A. Lin, S. Peltier, M. Ellisman, “A Generalized Service-Oriented Architecture for Remote Control of Scientific Imaging Instruments”, Proc. of E-Science and Grid Computing Conference, 2005. Chemistry Research Instrumentation and Facilities: Departmental MultiUser Instrumentation (CRIF:MU), NSF Program Solicitation - 07-552, 2007. P. Calyam, N. Howes, A. Kalash, M. Haffner, “User and Network Interplay in Internet Telemicroscopy”, ICST/ACM IMMERSCOM, 2007. Open H.323 Project - http://www.openh323.org A. McGregor, H-W. Braoun, “Automated Event Detection for Active Measurement Systems”, Proc. of Passive and Active Measurement Workshop, 2001. Pylons Python Web Framework - http://www.pylonshq.com The Ohio State University CAMM VIM Program http://www.camm.ohio-state.edu
300