Miguel A. Sanz-Bobi, Aurelio Garcia-Cerrada, Rafael Palacios, Jose Villar. Instituto de Investigaci6n Tecnol6gica, Universidad Pontificia Comillas, Albert0 ...
Experiences Learned from the On-line Internal Monitoring of the Behaviour of a Transformer Miguel A. Sanz-Bobi, Aurelio Garcia-Cerrada,Rafael Palacios, Jose Villar Instituto de Investigaci6n Tecnol6gica, Universidad Pontificia Comillas, Albert0 Aguilera 23, 28015 Madrid, Spain Jose Rolin, Bernard0 Morin Uni6n ElCctrica Fenosa, S.A. Capitin Haya, 53,28020 Madrid, Spain
-
Abstract Knowledge of the health of power transformers is important to prevent high costs caused by failures and to maintain the quality of the service. On-line monitoring and diagnosis seem to be the right way to reach this objective. In this paper a set of experiences related to the installation of vibration and temperature sensors inside a test transformer will be described. Different types of sensors have been tested, and some of them discarded because of induced electromagnetical noise. Some of the main results and conclusiom are shown in this paper. These experiences are included in a more general project called TRAFES, whose main objective is the continuous monitoring and diagnosis of large power transformers.
I. INTRODUCTION TRAFES [I] is a project developed to know the health of power transformers during its operation, suggest criteria for the design and construction of new ones, and more generally, improve the existing knowledge their internal behaviour. The Spanish electrical utility Uni6n ElBctrica Fenosa is the project leader, and supports it conjointly with OCIDE, manager of the electrical research program PIE. TRAFES is conceived as a tool for on-line diagnosis of power transformers using the signals coming from internal and external sensors. It is also able to interpret gases concentration and physico-chemical properties from the oil analysis. It is based on a fuzzy expert system and uses a set of models for the characterisation of the transformer behaviour to detect anomalies. The aim of this paper is to present our experience about the location, measurement and testing of sensors inside a test transformer, which is one of the research areas of the project. Since there is not much bibliography about this kind of experiments [2]-[3], this paper tries to somehow contribute in this field.
working conditions of the transformer. All the experiences were carried out in the power plant with the important and valuable help of its staff. In. FIRST EXPERIENCE The main objective of the first experience was to determine a feasible way to locate and install vibration and temperature sensors (taking into account possible insulation and electromagnetical problems). This would allow the analysis of the quality of the output signal of the installed sensors. Different types of sensors were used to compare their outputs. Figure 1 shows the sensor location. Accelerometer #I and #4 were ICP type, the others were charge type. Temperature sensor T2 was a PT-100, and the others were thermocouples. The winding accelerometers were fixed to an insulating support, adhered with epoxy cement to the winding varnish. Several materials were tested for the support, and fibber glass was finally chosen for its better insulating properties. Teflon was tested but no way to fix it to the windings was found. Every electrical contact was covered with silicone to improve electrical isolation. n6
.T4
11. EXPERIENCES INSTALLING SENSORS INSIDE A POWER TRANSFORMER There is not much knowledge about neither the internal behaviour of real transformers, nor its internal instrumentation. To overcome this lack of experience, internal sensors were installed inside a real 75 kVA - 15 kVl380 V transformer of the Narcea coal power plant, and several tests were carried out. The most important objectives of this research were, the study of possible location of vibration and temperature sensors, the analysis of possible materials for fixing the sensors to the internal parts of the transformer, the installation of sensors inside the transformer and the evaluation of sensor performance and sensibility at different
0-7803-394M)/97/S10.00
0
1997 IEEE.
I
Figure 1: 1" experience sensors location To acquire the vibration signals a HP 3565 with 4 simultaneous fast channels controlled by a HP330 workstation, and a HP spectrum analyser with one input channel were used. Vibrations were sampled at around 1 kHz frequency. For temperature signals a Datalogger with 23 slow channels controlled fiom a conventional PC was used. Temperatures were sampled every 5 seconds. During this first experience the transformer operated unloaded and at 30% of its rated load. Temperature signals were clean enough from noise (probably due to average and filter effect of the Datalogger) and non significative differences (less than 1 "C) were detected between the
TC3-11.1
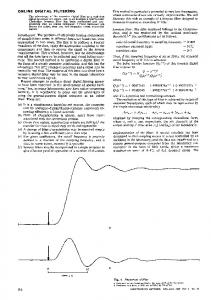
thermocouple and the PT-100 located at the top of the tank. However by the end of this first week the PT-100 showed an anomalous infinite resistance. With respect to the vibration measurements, it was proved that vibration measurements were feasible inside the transformer, in spite of the high magnetic and electric fields. The sensitivity of sensors and measurement equipment was enough to detect winding vibration. Measurements confirmed the expected vibration frequencies therefore approving the mounting procedure of sensors and cables. Electrical and mechanical tests of the isolating elements used to fix the accelerometers to the winding were necessary to enhance accuracy of the absolute values of the real vibration. We found that the electrical noise induced in the ICP accelerometers was larger than the noise in the charge accelerometers. In figure 2 the spectrum of the accelerometer #4 for frequencies up to 1 kHz is shown. This graph shows peaks at 50 Hz, 100 Hz, 150 Hz, 200 Hz, 250 Hz ... only the components at 100 Hz, 200 Hz, 300 Hz ... correspond to vibrations of the winding [4].Using accelerometers without pre-amplifier the components at 50 Hz, 150 Hz, 250 Hz ... are smaller. The spectrum for accelerometer #5 is shown in figure 3. (Note that both accelerometers were mounted together). This important result was also confirmed using the multichannel data acquisition system (HP3565) to ensure the same magnetic and electric conditions for all the sensors in the winding. Accelerometers #2 and #5 (charge type) behaved better than accelerometers #1 and #4 (ICP type) under every load condition tested.
Figure 2: accelerometer #4 spectrum “VP.3 309
Sam& . .. .
PRUSED e.1mRe. 5-c 4’ e’* .. , .. ,,. ... ... .. m . . . . . : ........ : ,................. :. 1....____ :._____. _____... :_._.... :.......’ .... . . . il
_ .
.
.
..
..
..
..
.
.
Figure 3: accelerometer#5 spectrum
Core vibrations could not be analysed because of an installation problem. The signal from accelerometer #6 was a 50 Hz sinusoidal function so large that the data acquisition system was saturated. The sensor had been mounted using a magnet over the core of the transformer, which was connected to ground. But the accelerometer was connected to the shield
of its cable and this shield was also grounded at the data acquisition system. Therefore we had a ground loop were 50 Hz were induced. IV. SECOND EXPERIENCE Several reasons were taken into account to carry out a second experience. Firstly, due to the unsatisfactory behaviour of the ICP accelerometers it was decided to remove them from the transformer. Additionally better new accelerometers had to be installed replacing many of the existing ones. Secondly the core accelerometer installation and the PT-100 problem previously detected had to be corrected. Figure 4 shows the sensor location. Temperature sensor T1 was a thermocouple and the others were PT-100. 6
n5
3,: T-7
8
Figure 4: 2” experience sensors location During this second experience the transformer operated from no load till 65% of its rated load. While the transformer was unloaded temperature measurements behaved normally. However operating at 65%, the input integrated circuit of the Datalogger was destroyed and no more temperature measurements could be taken during this experience. With respect to vibration measurements the following observations can be made. Since the study of natural frequencies may contribute to know how the transformer responds to the excitation produced by internal forces, we tried to obtain the natural frequencies of the tank, core and windings by experimental modal analysis. We found more than 20 modes for frequencies from 0 up to 1 kHz. The exact frequencies were difficult to calculate and they depend on the temperature of the transformer. Just a few impact tests did not give us enough information for the analysis of such a difficult system. Connecting the transformer we found a good relationship between the load and the vibration level. As we were expecting, vibration levels at 100 Hz, 200 Hz and 300 Hz increase with the load of the transformer. Variations depend on the point of measurement and on the operating condition (such us temperature). The values of the vibration level of accelerometers #2 and #3 for different loads are shown in figure 5 . An explosion took place in transformer while we were trying to clarify the strange signals obtained from the sensors mounted on the winding. An electric arch jumped probably between the winding and one of the sensors or cables. Because of the lack of a differential protection, several arches were created so it is difficult to know where
TC3-11.2
the fault really began. As a consequence some sensors were destroyed, signal cables were melted and data acquisition systems and computers were partially damaged. Although it is not possible to assure the origin of the fault, we suspect that the cement used to mount the accelerometers may have failed (special considerations about the maximum allowable cement temperature should be made in a definitive installation). From the beginning we were obtaining inexplicable signals from accelerometers #1 and #4. The accelerometer #1 presented a 50 Hz component equivalent to an acceleration of 70 d s 2 , while the corresponding values for accelerometers #2 and #3 were 0.01 d s 2 . This made us think that the accelerometer #1 could have dropped. The accelerometer #4 presented a component at 7.5 Hz, which is a very slow frequency for structural vibration of electric noise. We think that this component could be produced by the pendular movement of the accelerometer hanging from its own cable. We checked that the 7.5 Hz component was also present after disconnecting the transformer, while the other signals became negligible. 0.020
All of the accelerometers were B&K 4383. Figure 6 show temperature and vibration sensors location. T5 and T6 were the only thermocouples, the others being PT-100. The same equipment used during the second experience was used in this last one, after being repaired. Different tests were carried out for different load conditions. Transformer load was changed from 0 to maximum load (44A). The transformer operated normally with the installed sensors during six month, and no temperature or vibration problems were detected. Figure 7 shows a typical evolution of the top of the tank and winding temperatures. This experiment confirms that the new mounting procedure was appropriate for the measurement of winding vibrations. The increasing vibration level with the load was also confirmed.
1
35‘
I 10
20
10
20
30
40
50
60
30
40
50
60
0.01s
3
1 .-
0.010
=9
0.005
I O.Oo0
time (minutes) AoocleumM#ZZ
Figure 7: intemal transformer temperatures
Accclaombam
Figure 5: accelerometer #2 and #3 spectrum VI. CONCLUSIONS V. THIRD EXPERIENCE The vibration measurements of the precedent experience and the unfortunate accident revealed that probably an accelerometer detached from its location. The transformer was repaired and the winding accelerometer supports were fixed during the repairing with the cement normally used by the manufacturers. A small wood ring was put between the fibber glass support and the winding to improve the electrical isolation. The support was additionally fixed with a small fibber glass ribbon attached to the winding. Again every electrical contact was covered with silicone, but also each sensor cable was inserted in a fibber glass envelope to improve its electrical isolation.
Ti 3 3
TZ
6
c
5 =I
T3
Several experiences about the installation and measurements from sensors inside a power transformer have been described. This knowledge is necessary for the development of TRAFES project for on-line monitoring of power transformers. Both mounting and signal problems arose but were solved along the experiments. Proper measurements have been made and proved to be feasible. As a result a sensor installation procedure has been developed to be used for internal transformer monitoring.
REFERENCES [l] M. A. Sanz-Bobi, A. Garcia-Cenada, R. Palacios, J. Villar et al., “TR@S: Expert System for Diagnosis of Power Transformers”, CIGRE Symposium about Diagnostic and Maintenance Techniques. Paper 110-20. Berlin, Germany, 1993. [2] W. H. Hagman et al., “An Adaptive Transformer Monitoring System”, International Symposium for Demonstrations of expert Systems Applications to the Power Industry, Montreal, Canada, 1989. [3] J. L. Kirtley et al., “Monitoring the Health of Power Transformers”, IEEE Computer Applications in Power, January, 1996. [4] J. C. Lavalle, “Failure detection in transformers using vibrational analysis”, MS Thesis, MIT, Cambridge, MA, USA, 1986.
Figure 6: 3d experience sensors location
TC3-11.3


![Experiences and Lessons Learned from Namibia [PDF]](https://m.moam.info/img/260x300/experiences-and-lessons-learned-from-namibia-pdf_647a2545098a9e24118b45e6.jpg)