1
Experiential Sampling on Multiple Data Streams Mohan S. Kankanhalli, Jun Wang, and Ramesh Jain, Fellow, IEEE
Abstract— Multimedia systems must deal with multiple data streams. Each data stream usually contains significant volume of redundant noisy data. In many real-time applications, it is essential to focus the computing resources on a relevant subset of data streams at any given time instant and use it to build the model of the environment. We formulate this problem as an experiential sampling problem and propose an approach to utilize computing resources efficiently on the most informative subset of data streams. In this paper, we generalize our experiential sampling framework to multiple data streams and provide an evaluation measure for this technique. We have successfully applied this framework to the problems of traffic monitoring, face detection and monologue detection.
Index
Terms—
Computing, Attention
Dynamical Systems, Experiential Experiential Sampling, Sampling, Visual
and experiences, the system should collate the relevant data and information of interest related to the task. Thus, the system interacts naturally with all of the available data based on its interests in light of the past states in order to achieve its designed task.” To achieve this, we proposed a sampling-based dynamic attention model. The current environment is first sensed by uniform random sensor samples and based on experiences so far, compute the attention samples to discard the irrelevant data. Higher attended samples will be given more weight and temporally, attention is controlled by the total number of attention samples. Hence, the multimedia analysis task at hand can select its data of interest while immediately discarding the irrelevant data to achieve efficiency and adaptability. In this paper, we continue our discussion and generalize the theoretical framework of experiential sampling on a single data stream to multiple data streams and provide an evaluation measure for this technique. We then apply this framework to the problems of traffic monitoring, face detection and monologue detection to show the effectiveness of our framework.
I. INTRODUCTION
II. RELATED WORK
ultimedia information processing usually deals with spatio-temporal data which have the following attributes: • It consists of a multiplicity of usually correlated data streams. Thus, it does not exist in isolation – it exists in its context with other data. For instance, visual data comes along with audio, music, text, etc. • They possess a tremendous amount of redundancy. • The data is dynamic with temporal variations with the resultant history. However, many current approaches towards multimedia analysis do not fully consider the above attributes which lead to two main drawbacks – lack of efficiency and lack of adaptability. Therefore, to tackle these two problems, in [1], we articulate the following goal for multimedia systems: “system should sense the data from the environment. Based on the observations
Since human perception is greatly aided by the ability to probe the environment through various sensors along with the use of the situated context, it has inspired context aware computing in the human computer interaction research community [10]. The basic idea there is to help the computer respond more intuitively to the human user based on the context. A comprehensive review of context aware computing can be found in [10][11]. Our thrust is towards making multimedia analysis systems interact naturally with multiple data streams by considering the current context and past history. The ability to “focus” the “consciousness” in human visual perception has inspired research in non-uniform representation of visual data. The basic idea is to do adaptive sampling which is basically the selection of the most informative samples in a data stream. Visual attention in human brains allows a small part of incoming visual information to reach the short-term memory and visual awareness, consequently providing the ability to investigate more closely. There is a growing interest in the study of the visual attention phenomenon by psychologists [2][4]. The phenomenon of inattentional blindness is particularly interesting in which human subjects have been found not to observe major objects when paying attention to some other objects [4]. It has been found to be a useful aid in finding evidence for resolving the controversy between the conflicting spotlight and object models of visual
M
Manuscript received April 28, 2004, and accepted Dec. 4, 2005 M. S. Kankanhalli is with the School of Computing, the National University of Singapore. Kent Ridge, Singapore 117543 (Phone: (65) 6516-6738 Fax: (65) 6779-4580 e-mail:
[email protected]). J. Wang is with the Faculty of Electrical Engineering, Mathematics and Computer Science, the Delft University of Technology, the Netherlands. (e-mail:
[email protected]). R. Jain is with the Bren School of Information and Computer Sciences, the University of California, Irvine. (e-mail:
[email protected]).
2 attention. The spotlight model hypothesizes that visual attention is concentrated in a small contiguous region (“spotlight” or “zoom lens”) which can move around in the field of vision. In contrast, the object model states that attention can be focused on spatially discontinuous objects (or a group of disparate objects). Experimental evidence seems to suggest that the human visual attention mechanism appears to be a combination of both models [2]. Computational modeling of visual attention has been investigated for potential usages in planning and motor control [9], video summarization [6] and object recognition [7]. The computational model of visual attention maintains a two-dimensional topographic saliency map by employing a bottom-up reasoning methodology [5]. Reference [8] attempts to model the influence of high-level task demands on the focal visual attention in humans. There is also the foveation technique [13][15] for maintaining a high-resolution area of interest in an image. A uniform-resolution image can be foveated to transform into a spatially varying resolution image by either a log-polar [13] or a wavelet approach [14]. All these approaches recognize the need for doing adaptive sampling. But their approach is usually static. However, in humans, attention varies with the nature of task. In addition, visual attention is adaptive. This means it will vary depending on the visual environment and has a self-corrective mechanism utilizing experiences. Interestingly enough, psychologists have observed that unexpected objects have a lower probability of being observed when attending other objects [2]. This strongly suggests the human perceptual system has a concrete notion of history which is encoded as a priori probabilities. Thus, attention will vary over time. Unfortunately, the above saliency map based visual attention models and foveation approaches are image based that do not provide a mechanism to evolve and adapt attention dynamically. Contrastingly, our sampling framework naturally expresses the dynamics of attention of a system. What is particularly appealing is that the attention states as well as the state-transitions are captured as a closed-loop feedback system. Moreover, the earlier adaptive sampling approaches consider only a single data stream. Our framework explicitly considers multimedia which consists of a multiplicity of correlated data streams. And these streams need not be audio or video – it can be any type of multimedia data including data not perceived by human sensors like infrared or motion sensors. The Sampling Importance Resampling (SIR) method which can be used for modeling evolution of distributions was proposed in [17]. The dynamics aspects were developed in [18]. In a SIR filter, a set of particles, which move according to the state model, multiply or die depending on their “fitness” as determined by the likelihood function [21]. A general importance-sampling framework that elegantly unifies many of these methods has been developed in [16]. A special case of this framework has been used for the purpose of visual tracking in [12]. Though we also utilize the sampling method, we use it to maintain the generalized notion of attention. To the best of our knowledge, this is the first use of the sampling technique to maintain the dynamically evolving attention. Thus, unlike [12],
the number of samples dynamically changes for the purpose of adaptively representing the temporal visual attention. This is in tune with the growing realization that computing systems will increasingly need to move from processing information and communication to the next step: dealing with insight and experience [3]. One of the key technical challenges in experiential computing is information assimilation, i.e., how to process in real time the disparate data received by multiple sensors. Our research in this paper aims to provide a sampling based dynamical framework to tackle this problem in the multimedia domain.
III. HANDLING MULTIPLE DATA STREAMS Let us assume that we are given S1, S2 … Sn synchronized data streams belong to the space of multimedia data streams M . These data streams have K types of data in the form of image sequence, audio stream, motion detector, annotations, symbolic streams, and any other type that may be relevant and available. Also, metadata for each of the streams MD1, MD2 …, MDn is available in the context of the environment. This metadata may include things like location and type of the sensor, viewpoint, angles, camera calibration parameters or any other similar parameters relevant to the data stream. Since a data stream is usually not directly very useful, some feature detectors must be applied to each data stream to obtain features that are relevant in the current environment. We assume that the multimedia system is a discrete time (or a sampled continuous time) dynamical system. When features are based on time intervals, they will be considered as detected at the end of interval, which is denoted as t, where t=1,…,T. Given the above data environment, there are now many very interesting problems that one faces, including the following that are directly relevant to the main theme that we wish to address in this paper: • How to focus on the most relevant data in a particular data stream? • How to focus on the most relevant data in multiple correlated data streams? • For the given task, what is the minimum number of data streams required? • How does one sample the data streams? How can one minimize sampling for maximizing the efficiency? • Can one use alternate data streams to perform the same task with different costs? • Given that M streams are necessary for a given task, how does one combine the information from the data streams? We believe that this issue of determining which data streams are relevant and even among those streams which ones provide most relevant information at any given moment is a very important problem that needs to be addressed and has been ignored in the current literature. Current multimedia systems, usually start with the assumption that there is a given set of n data streams, unfortunately in most cases n=1 making it a signal analysis rather than a multimedia problem, and one must
3 deduce or extract all information from there to build the schema representing the environment. There are other issues related to semantics and indexing that we do not wish to address here. Now we are ready to define what experiential sampling is and then address this in the remaining part of the paper. A. Optimal Selection of Data Streams We have seen in the earlier section that for a single media stream case (which could have multiple local feature streams), the goal oriented attention driven analysis can be succinctly described by:
SID = S M ( f L , aG ) = arg max P ( H | f L , aG ) ∴ SID = arg max P ( H | f L ) ⋅ P ( aG | E ) H
We will now extend this scenario to the real multimedia case when multiple correlated media streams are considered. Our work adopts an approach similar to that of [20] and generalizes their ideas for multimedia systems. As described earlier, there are n media data streams S1, S2 …Sn. These data streams consist of K types of data such as image sequence, audio stream, motion detector, annotations, symbolic streams, and any other type that may be relevant. We assume that these streams are synchronized. Further, we assume that metadata MD1, MD2, …MDn for each stream is available from the original sources that helps in interpreting the data stream in the context of the environment. And since in most cases feature detectors will be applied to each data stream in the context of the corresponding metadata for each data stream, we can represent the multimedia data as a (possibly) correlated features stream set F = { f j } , where fj is the jth feature stream where
1 ≤ j ≤ N such that N ≥ n and there is at least one feature stream derived from every multimedia data stream. So, now our equation (7) can be modified to include the multiple correlated multimedia data streams scenario to:
SID = f M (F, aG ) = arg max P( H | F, aG ) H
(1)
H
Clearly, there is some amount of noise in every data stream fj and also there is a tremendous amount of redundancy among them. The questions raised earlier in Section 3 boil down to the question of selection of appropriate features stream set for the goal to be achieved. More formally, let us assume that a set of
F feature streams allows the system to achieve goal G. We also assume that each feature stream contains only partial information to achieve the goal and there is redundancy (overlap) of information among the various feature streams. Let us also assume that there is a cost function associated with the use of each subset of F . Our problem now can be defined as: (a) to identify a lowest cost subset of feature streams
Φ ∗ ⊆ F such that the goal G can be accomplished.
to develop an optimal procedure for determining this ∗
subset Φ . Assume that when the full set of data streams F is available, we have: (2) PF (G | H , f j ) > α , 1 ≤ j ≤ N where PF (G | H , f j ) denotes the probability that the goal of correctly identifying the hypothesis of the symbolic identity when it is actually true, given the N feature streams information and 0 < α < 1 denotes the confidence level. Our problem can now be restated as: ∗
H
∴ SID = arg max P( H | F) ⋅ P (aG | E )
(b)
(a) identify a lowest cost subset Φ of feature streams such that (3) PΦ ∗ (G | H , f j ) > α , 1 ≤ j ≤ N . (b)
determine the optimal procedure to identify the feature ∗
stream subset Φ assuming we have a method to determine whether an arbitrary subset Φ ⊆ F satisfies
PΦ (G | H , f j ) > α , 1 ≤ j ≤ N .
(4)
Note that the total cost is normally related to the total computation cost of the feature streams subset or perhaps can be the hardware cost of obtaining the feature streams or could be related to the energy consumption of obtaining the feature streams (particularly in case of low power appliances). Let us quantify the cost of using a subset of feature streams Φ by
cΦ and let us assume an a priori probability p Φ that this subset can achieve the goal G. The idea of having these probabilities is that it allows for an identification strategy to be developed to obtain the lowest cost feature stream set. So we can not only identify which subset that can achieve the goal but also provides a mechanism to determine how to identify this optimal subset. This optimization problem is posed as a Markovian decision process. We also try to provide a set of assumptions under which this optimal strategy can be developed. Of course, by changing these assumptions, we can better study the structure of this problem and can lead to better identification algorithms for different problem instances. B. The General Multiple Stream Problem We will first present the results in a general setting and then narrow down some specific instances of the problem. In the general case, let us assume that we are given a multimedia system with a set of F feature streams. We make the following assumptions: (1) The goal G can be achieved when the full set of N feature data streams F is available. If we do not have this assumption, there is no optimization problem to solve. (2) Any combination of i feature streams (i < N ) has a lower cost than any combination of i + 1 feature data streams. This allows for the fact that for any specific combination of i data streams to be of less cost than that of any other set of i data
4 streams. Note that this may not be a realistic assumption. Relaxing this assumption is an open problem. (3) If the a priori probability that the multimedia system can achieve goal G using a combination of i feature streams is p i , then we have:
0 = p 0 < p1 ≤ p 2 ≤ … ≤ p N −1 < p N = 1
(5)
What this essentially states is all feature data streams have an equal capability of providing information for achieving goal G. We will modify this assumption later on for a specific instance of the general problem. (4)
If a combination of feature data streams
Φ A cannot
achieve the goal G, the probability p|B| remains the same for all sets of feature data streams B ⊃ A . Moreover, if a combination of feature data streams
Φ A achieves the goal G,
the probability p|C | remains the same for all sets of feature data streams C ⊂ A . (5) The cost of finding out whether a subset of feature data streams can help achieve the system goal or not is a constant equal to c. This assumption basically states that there is a constant cost procedure to determine whether the given subset Φ is sufficient to achieve the system goal G. One can conceivably have a benchmark data set with ground truth to perform this test. We can now cast the feature stream subset selection problem as a decision problem on a directed graph. The nodes of the directed graph are the elements of the power-set of F . Each node of the graph represents a combination of feature data streams. Two vertices A and B are connected by an edge directed from B to A iff |B| = |A| + 1 and A ⊂ B . Node φ of the graph is the empty node which corresponds to the use of zero feature data streams. An example of a directed graph for a multimedia system with three feature data streams is shown in Fig. 1. We note that the directed graph provides the combinations of possible feature data streams. The idea of the identification procedure is to quickly identify the node with the least cost which allows for the multimedia system to achieve goal G. Each subset of feature data streams (corresponding to a node) can be tested for fact whether it achieves the goal G or not. Note that the node containing F i.e. containing all the feature data streams does achieve goal G (from assumption 1). The node φ cannot achieve the goal G. If a node A can achieve the goal G, then node B ⊃ A can also achieve the goal G. Conversely, if a node A cannot achieve the goal G, then node B ⊃ A also cannot achieve the goal G. These are fairly obvious statements. We now need a set of definitions: (1) Node B of the directed graph is a child of node C in the graph iff there exists a directed path from C to B. (2) Node B of the directed graph is a parent of node C iff there exists a directed path from B to C.
(3)
Let
ξ be a set of nodes with A ∈ ξ . A reachable set
ξ conditioned on the fact that A can achieve goal G, is a set composed of all nodes in ξ whose cost is less than that of from
A. (4)
Let
ξ be a set of nodes with A ∈ ξ . A reachable set
ξ conditioned on the fact that A cannot achieve goal G, is a set composed of all nodes in ξ except node A and its children in ξ . from
(5) A reachable set is a set that results from applying an arbitrary sequence of tests (for testing whether a node can achieve goal G) according to the definitions 3 and 4 above. Now, we are ready to pose the problem as a Markovian decision problem with perfect observations. The information state of the process is the set of nodes of the directed graph which have not yet been checked whether they can achieve goal G and could potentially correspond to a least cost combination of feature data streams. Therefore, an information state is a reachable set. Let V(Q) denote the minimum expected cost (of testing) when the state is Q. Then V(Q) satisfies the optimality equation:
V (Q) = min{c + pi ∗ V ( N iG ) + (1 − pi ) ∗ V ( N iG )} (6) i∈Q
Note that G denotes that the system goal is achievable and
G denotes that the system goal is not achievable. We will now provide a solution to the above equation under the assumptions stated at the beginning of this section. Theorem 1: If p l + p l +1 ≥ 1 for l = 1, … , N − 2 , then an optimal test strategy for identifying the feature stream subset
Φ ∗ is to test the combinations of feature data streams in an increasing order of feature data stream cost. Proof: The proof for this theorem is structurally similar to the proof of Theorem 3.1 of [20]. What this theorem states is that if one tests the combination of feature data streams in this manner, an optimal feature ∗
stream subset Φ is guaranteed to be identified with the least cost. What is a more interesting result is the following corollary which precisely computes the value of V(Q) for the optimal subset: Theorem 2: Let Q be a reachable set. Then the minimum expected cost associated with Q is nl −1
nl +1 −1
n =0
n =0
V (Q) = c ∗ [∑ (1 − pl ) n + (1 − pl ) nl ∗
∑ (1 − p
l +1
)n
(7) nh −1
+ … + (1 − pl )nl ∗ (1 − pl +1 )l +1 … ∗ (1 − ph−1 ) nh −1 ∗ ∑ (1 − ph ) n n =0
Proof: This proof is similar to the proof of corollary 3.1 of [20]. We will now examine a special instance of the above generalized setting.
5 C. Analysis of the Constant Fusion Probability Instance Let us now examine the generalized setting under a more constrained assumption 3 of section IV.B. If we assume the following modified assumption:
straightforward. For one data stream, we had NS sensor sample. If we have Φ
∗
data streams, then we can allocated a fixed
NS(i) number of sensor samples for sensing the environment for each data stream where
(3’) The a priori probability that the multimedia system can achieve goal G when a combination of i feature data streams is utilized for 1 < i < N − 1 , is equal to a constant probability p. 12
123
1
3
13
23
1 < i ≤ Φ ∗ . Again, the notion of
attention saturation can also be used with generalization. For one data stream case, we had NA attention samples. We now define attention saturation for a single feature stream Fj as follows:
ASat Fi (t ) = f N ∫ P ( a (t ) | E (t ) ) f i
φ
(9)
Then for all the data streams, we have the total amount of attention saturation as:
ASat (t ) = ∑ ASat fi (t )
2
fi
Fig. 1. The directed graph for three feature data streams case.
The earlier assumption is constrained to consider the fact that any subset of feature data stream set has equal probability of achieving the system goal. This may not be a very realistic assumption but it is a practical assumption to make when no prior empirical evidence is available in which case it is fair to assume p = pi = 1 for all subsets i. This essentially means that 2 any subset is equally like to achieve the system goal and we would like to identify the subset with the minimum cost. Theorem 3: Let Q be an information state with i and j being two elements of Q. If p ≥ (1)
1 , then: 2 | QiG | + | Q Gi | ≤ | Q Gj | + | Q Gj |
If
and | Qi |≤| Q j |≤| Qi | , G
G
G
| QiG |≤| Q Gj |≤| QiG | then
Vi (Q ) ≤ V j (Q ) where Vi (Q) denotes the expected cost of testing all k ∈ Q when the information state is Q and follow the optimal test strategy afterwards. (2) An optimal test strategy is to test combinations of feature stream sets in an increasing order of their cost. The minimum expected cost associated with Q is |Q|−1
V (Q) = c ∗ ∑ (1 − p) n .
(8)
n =0
Proof: This proof is structurally similar to that of Theorem 3.2 of [38]. What is interesting is the above theorem provides an upper-bound of V(Q) as
c . p
D. Attention Saturation for Multiple Data Streams If we have multiple data streams, we need to be able to decide how many sensor and attention samples to allocate to each data stream. The case of sensor samples is quite
Now we can easily compute the number of attention samples for each individual data stream using:
N Afi (t ) =
N max • ASat fi (t ) ASat (t )
(10)
Thus, we can compute the number of attention samples required for each data stream in way which proportional to the amount of attention required for that stream normalized over the total attention saturation. E. Evaluation We use ideas from foraging theory to evaluate the efficacy of the experiential sampling technique. When people explore data and assimilate information, people try to maximize their rate of gaining valuable information over cost. In the information foraging theory [19], it has been formulated as maximizing the rate of gain of valuable information per unit cost R:
R=
G TB + TW
(11)
where G is the total net amount of valuable information gained (the attended samples), TB is the total amount of time spent between information patches (time to sense the environment using sensor samples and compute the context) and TW is the time within the information patches (time to obtain the attention samples and to perform analysis time on them). Therefore a “good” method should have the ability to maximize R at any given time. The intuitive idea is that the amount of computation required for determining attention should be small enough so that the savings obtaining by doing the task only on the attended samples clearly dominates this factor. Thus, we can obtain an overall gain. Our attention samples are used to collect the relevant information. If the attention model is accurate, the attention saturation ASat(t) intuitively measures the relevant information regarding the goal in a given time slice. We can define G = ASat(t) (when ASat(t) ≠ 0). The cost of obtaining the sensor samples CS can be treated as TB while the cost of obtaining
6 attention samples CA and performing local analysis (Eq. (1)) on attention samples CF can be treated as TW. L
Based on the above, the rate of gain of valuable information per unit cost of our approach RE is equal to:
RE (t ) =
ASat (t ) N A (C A + CFL ) + N S CS
(12)
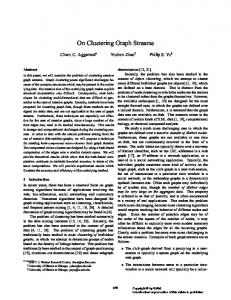
Frame 3 NA = 0
Frame 191 NA =272 Frame 193 NA =147
Since the cost of obtaining both sensor samples CS and attention samples CA is much smaller than the cost of performing local analysis CF , the second part of the L
denominator in Eq. (NSCS as well as CA ) can be removed. Consequently, by replacing NA from equation (26), equation (30) becomes:
RE (t ) ≈
ASat (t ) 1 = N Max ASat (t )CFL N MaxCFL
(13)
From equation (32), we can see our algorithm is adaptive to the experiential environment and keeps maximizing the rate of gaining valuable information over cost. When there is more relevant information (increasing the attention saturation in the numerator), the number of attention samples will be larger and consequently the cost increases (as the increase in the denominator) and vice versa. This keeps the valuable information gain per unit cost near the maximal value. In contrast, the rate of gain of valuable information per unit cost for the local feature centered approach RF (if we only use L
equation (1) for content analysis) is equal to:
RFL (t ) =
ASat (t ) MCFL
(14)
Frame 203 NA =345
Frame 212 NA = 238 Frame 243 NA =0
Fig. 2. Traffic monitoring sequence. This Fig. illustrates the both spatial and temporal visual attention inferred from motion experience. Blue points are sensor samples while yellow points are attention samples. Red bar shows the spatial attention in x direction. It evolves according to the spatial experience. NS number of sensor samples is set to 200. NA number of attention samples changes each time based on the temporal experience.
Fig. 3 shows that the temporal attention (attention saturation), calculated from Eq. (24) in [1], evolves according to the motion activity in a traffic monitoring sequence. NA roughly reflects the traffic status at each time step. Therefore, our method here can be used for monitoring the traffic also. It also shows that the temporal attention is aroused only when the cars pass by. At other times, when NA is zero, there are no attention samples. During this time, the only processing and analysis done is the sensor sampling. It should be understood that all the results are obtained by only processing a few samples in the visual data. There is no need to process the entire data. It fulfills our aims of providing analysis have the ability to select the data to be processed.
where M is number of times that the local analysis needs to be performed. M is much bigger than the maximum number of attention samples NMax. Especially when there is less relevant information, there still will be a constant local analysis cost. Therefore, it is not efficient compared to our approach. IV. EXPERIMENTS In this section, we present results from the three test examples. The result videos are available for viewing at http://www.comp.nus.edu.sg/~mohan/ebs/. A. Activity Monitoring We test our method for the traffic monitoring sequences (Fig. 2). There are 200 sensor samples randomly scattered spatially to sense the motion experience. Based on the sensor output, attention samples are created. Their numbers and spatial distribution are all determined by the motion experience. Fig. 2 shows that, unlike the saliency map based attention model, only about two hundreds of attention samples and 200 sensor samples are sufficient to maintain the motion attention. The weight of each attention sample is drawn using red bars along with the x direction to visualize the spatial attention in x direction. We can see that our experiential sampling technique can model multi-modal motion attention quite well without maintaining the saliency map
Fig. 3 Traffic monitoring by attention saturation.
B. Audio-Visual Face Detection We use our experiential sampling technique to solve the face detection problem. Sensor samples are employed to obtain the current environment from the skin color, motion and audio cues. The face attention is maintained by the attention samples. Fig. 4 shows the face detection by using the audio-visual data from the two different streams. Fig. 4(a) shows the initial status: there is no face detection working in the visual stream. The only processing is in the audio stream for the purpose of detecting the sound volume. In Fig. 4(b), when a chair enters, it alerts the volume sensor in the audio stream and triggers the face detection module in the visual stream. Thus, sensors in the
7 visual streams start to work: 200 sensor samples are uniformed randomly sampled and sense the visual scene. Based on this, 117 motion attention samples are aroused to follow the moving object (chair). Face detection is performed on those attention samples. But the face detector verifies that there is no face there. In Fig. 4(c), the chair stops. It causes the volume in audio stream becomes zero and the attention samples vanish. If this state remains for a short period of time, the face detection module in the visual stream is shut down again as shown in Fig. 4(d). In Fig. 4(e)-(f), the volume sensor arouses the face detection module again when a person enters. Attention samples are aroused by both the spatial cues in the visual stream (motion/ skin color) and the temporal cue in audio stream (volume). The attention samples come on with the face until the face vanishes and audio stream become silent again (In Fig. 4(g)). If the system is in this state for a while, face detection is shut down again due to the no activity in both the audio and visual streams. Only the sensor sampling of the audio-visual environment continues to take place.
1) Computation Speed We use a USB web camera to perform real time face detection on a Pentium III 1GHz laptop. The graph of the computation load, indicated by sec/frame, in this real time scenario is shown in Fig. 5. Note that our absolute speed ((with frame capturing, rendering, recording results (saving to disks), etc.)) is constrained by the capture speed of the USB camera. However, we intend to show the adaptability of our computational load rather than the absolute speed. In Fig. 5, curve 1 shows the computation load of the adaboost face detection [22] while curve 2 indicates the computation load of our experiential sampling with adaboost face detector. This figure shows that by using our experiential sampling technique, computation complexity can be significantly reduced. In addition, in order to show the adaptability, we also depict the value of attention saturation in the graph. It shows that the computation complexity varies according to the difficulty of the current task, which is measured by the attention saturation. This is the expected behavior as deduced in equation (32) in [1]. 140
Curve 1: Max Bin of Skin Model Curve 2: Lightness of the Frame Curve 3: Max Bin of the Hue in Frame
120
100
(a) Frame 13
(b) Frame 68
(c) Frame 104 80
60
40
(d) Frame 114
(e) Frame 511
(f) Frame 618
20
0 1
26
51
76
101
126
151
176
201
226
251
Frame Number
Fig. 6. Our Adaptive Model that adapts to the environment.
(g) Frame 698
(h) Frame 700
Fig. 4. Audio-visual face detection by Experiential Sampling.
Fig. 5. Comparison of the computation speed.
2) Past Experiences Based on the discussion in Section II.C.7 in [1], we have implemented the use of the past experience for building the dynamic skin color model. The experimental results are shown in Fig. 6. We change the luminance of our visual scene. This consequently causes the global visual environment to vary, which is indicated by the curve 1 (luminance) and curve 2 (Max bin in hue) as shown in Fig. 6. By constantly updating the skin color model from the previous analysis, our skin color model can dynamically adapt to the changed visual environment. C. Monologue Detection For the monologue detection, we intend to show our approach for integrated analysis on multiple streams and sub-tasks rather than giving quantitative test results. The results of the monologue detection are shown in Fig. 7. Fig. 7(a) shows the procedure. When there is a sound in the audio stream as shown in Fig. 7(a.1), the lip motion detector starts up and speaker is found in camera 1. Then, camera 2 starts to focus on
8 the speaker’s region which is detected by the lip motion detector in Camera 1. Detected faces are marked as yellow regions while lip regions are marked as red regions. Face detector and lip motion detector perform measurements on the camera 1, which is indicated in the bottom-right of the frame. Camera 2 zooms in to the speaker’s region, which allows further visual analysis to be performed on the output of camera 2 in order to obtain more accurate results. Fig. 7(b) shows the detection results for a sequence in which two different speakers speak at different times. Therefore, the second camera focuses on a different person depending on who is speaking.
possibility is a dynamical system based approach. Model predictive controllers [43] seem to be an attractive option. Or some energy minimization [39] or MDL based approach [40] might turn out to be useful. These are fruitful avenues for future investigations. • How do we combine continuous feature streams with symbolic feature streams? For example, text stream is often available with video streams. How can the text stream be effectively exploited for video analysis in this case? •
∗
Having identified Φ , how do we distribute the ∗
attention samples among the various streams belonging to Φ ? We have suggested one method based on attention saturation. Can it be done in a more efficient manner? • How off are we from the optimal condition if a ∗
(a.1)
(a.2)
(a.1) Sound in the audio stream triggers the lip motion detector in C1. (a.2) C2 focuses on the speaker’s region detected by lip motion detector.
particular feature stream from Φ drops off? The idea is to gracefully degrade any system and to have a quantitative notion about it. This can have practical implications for handling sensor failures and run-time maintenance of multimedia systems. ∗
(b)
(c) Fig. 7. Sample frames for Monologue Detection Results.
V. CONCLUSIONS In this paper and [1], we describe a novel sampling based framework for multimedia analysis called experiential sampling. Based on this framework, we can utilize the context of the experiential environment for efficient and adaptive computations. Inferring from this environment, the multimedia system can select its data of interest while immediately discarding the irrelevant data. As examples, we utilize this framework for the activity monitoring, face detection and monologue detection problems. The results establish the efficacy of the sampling based technique. In the future, other applications like adaptive streaming and surveillance with more sources of different modalities will be further investigated. What we have essentially done is to formulate the problem of ∗
identifying the optimal feature stream subset Φ of a multimedia system to accomplish its task. We have formalized the problem to cast it as a Markovian decision problem and have provided an optimal procedure to identify this subset as well as to estimate the cost of identifying this optimal subset. However, much more remains to be done: ∗
• Given this optimal subset Φ , how do we best fuse the information from the various feature streams for a particular problem? One possibility is a linear fusion framework. Another
• How exactly do we trade one feature stream of Φ versus a subset others? The directed graph model will help along with the cost of each feature stream. This can help select different subset of sensors depending on other criteria. • Our main contribution is the introduction of generalized goal-oriented attention for multiple sensor data streams which are not necessarily biological sensors. Moreover, this attention function has been identified as dynamically varying phenomenon which is continuously updated based on past experience and current context. We have used the sampling framework to mathematically model this phenomenon. Can some other more economical mathematical model be developed for capturing this phenomenon? • Though we have been inspired by the human phenomenon of attention, we have adopted an engineering approach to solve the problem. However, it may be worthwhile to computationally mimic the biological phenomenon. Building biologically plausible models of attention would be an interesting challenge. Some of the findings by cognitive scientists [6, 8] would be extremely useful for this purpose.
REFERENCES [1] [2] [3] [4]
[5] [6]
M. S. Kankanhalli, J. Wang, and R. Jain, “Experiential Sampling in Multimedia Systems”, IEEE Trans. on Multimedia, 2006. B. J. Scholl, “Objects and Attention: The State of the Art”, Cognition, Vol. 80, pp. 1-46, 2001. R. Jain, “Experiential Computing,” Communications of the ACM. Vol. 46, No. 7, pp. 48-55, 2003. S. B. Most, D.J. Simons, B. J. Scholl, R. Jimenez, E. Clifford, and C. F. Chabris, “How not to be Seen: The Contribution of Similarity and Selective Ignoring to Sustained Inattentional Blindness,” Psychological Science, Vol. 12, No. 1, pp. 9-17, 2001. L. Itti, and C. Koch, “Computational Modeling of Visual Attention,” Nature Reviews Neuroscience, Vol. 2, No. 3, pp. 194-203, 2001. Y. Ma, L. Lu, H-J. Zhang, and M. Li, “A User Attention Model for Video Summarization,” in Proc. Tenth ACM International Conference on Multimedia, pp. 533-542, 2002.
9 [7]
[8]
[9] [10]
[11]
[12]
[13]
[14]
[15]
[16]
[17]
[18]
[19] [20]
[21]
[22]
D. Walther, L. Itti, M. Riesenhuber, T. Poggio, and C. Koch, “ Attentional Selection for Object Recognition - a Gentle Way,” in Proc. of 2nd Workshop on Biologically Motivated Computer Vision (BMCV'02), pp. 472-479, Germany, 2002. V. Navalpakkam, and L. Itti, “A Goal Oriented Attention Guidance Model,” in Proc. 2nd Workshop on Biologically Motivated Computer Vision (BMCV'02), pp. 453-461, Germany, 2002. E. K. Miller, “The Prefrontal Cortex and Cognitive Control,” Nature Rev. Neuroscience. Vol. 1, No. 1, 59-65, 2000. A. K. Dey, and G. D. Abowd, “Towards a Better Understanding of Context and Context-awareness,” in H-W Gellerson, Editor, Handheld and Ubiqitous Computing, Number 1707 in Lecture Notes in Computer Science, pp. 304-307. Springer, 1999. H. Lieberman, and T. Selker, “Out of Context: Computer Systems That Adapt to, and Learn From, Context,” IBM Systems Journal, Vol. 39, Nos. 3&4, pp. 617-632, 2000. M. Isard and A. Blake, “Condensation-conditional Density Propagation for Visual Tracking,” International Journal on Computer Vision, Vol. 29, No. 1, pp. 5-28, 1998. C. Colombo, M. Rucci, and P. Dario, “Integrating Selective Attention and Space-variant Sensing in Machine Vision. In Jorge L.C. Sanz, editor, Image Technology: Advances in Image Processing, Multimedia and Machine Vision, pp. 109-128. Springer, 1996. E-C. Chang, S. Mallat, and C. Yap, “Wavelet Foveation,” Journal of Applied and Computational Harmonic Analysis, Vol. 9, No. 3, pp. 312-335, 2000. E. L. Schwartz, D. N. Greve, and G. Bonmassar, “Space-variant Active Vision: Definition, Overview and Examples,” Neural Networks, Vol. 8 No. 7-8, pp. 1297-1308. 1995. A. Doucet, S. Godsill, and C. Andrieu, “On Sequential Monte Carlo Sampling methods for Bayesian Filtering,” Statistics and Computing, Vol. 10, No. 3, pp. 197-208, 2000. D. Rubin, “Using the SIR Algorithm to Simulate Posterior Distributions (with discussion),” in Bayesian Statistics 3, eds. J.M. Bernard, M.H. DeGroot, D.V. Lindley, and A.F.M. Smith, New York: Oxford University Press, pp. 395-402, 1998. N. J. Gordon, D. J. Salmond, and A. F. M. Smith, “Novel Approach to Nonlinear/Non-Gaussian Bayesian State Estimation,” in IEEE Proceedings on Radar and Signal Processing, Vol. 140, No. 2, pp. 107-113, 1993. P. Pirolli, and S. K. Card, “Information foraging,” Psychological Review, Vol. 106, No. 4, pp. 643-675, 1996. R. Debouk, S. LaFortune, and D. Teneketzis, “On an Optimization Problem in Sensor Selection,” Journal of Discrete Event Dynamical Systems: Theory and Applications, Vol. 12, No. 4, pp. 417-445, 2002. D. A. Forsyth, J. Haddon, and S. Ioffe, “The Joy of Sampling,” International Journal of Computer Vision, Vol. 41, No. 1/2, pp. 109-134, 2001. P. Viola, and M. J. Jones, “Robust Real-time Object Detection,” Tech. Rep. CRL 2001/01, Compaq Cambridge Research Laboratory, Cambridge, MA, 2001
Mohan S. Kankanhalli is a Professor at the Department of Computer Science of the School of Computing at the National University of Singapore. He obtained his BTech (Electrical Engineering) from the Indian Institute of Technology, Kharagpur, and his MS and PhD (Computer and Systems Engineering) from the Rensselaer Polytechnic Institute. He has worked at the Institute of Systems Science in Singapore and at the Department of Electrical Engineering of the Indian Institute of Science, Bangalore. His current research interests are in Multimedia Systems (content processing, multimedia retrieval) and Information Security (media watermarking and authentication). He is on the editorial board of several journals including the IEEE Transactions on Multimedia, ACM Multimedia Systems journal and the IEEE Transactions on Information Forensics and Security. Jun Wang received the BE degree in electrical engineering from the Southeast University in Nanjing, China, and the MSc degree in computer science from the National University of Singapore, Singapore. He is now a PhD student with the Information and Communication Theory Group, the Faculty of Electrical Eng., Mathematics and Computer Science (EWI), the Delft University of
Technology, the Netherlands. His current research topic is personalized multimedia systems and recommender systems. Ramesh Jain is the Bren Professor of Information and Computer Sciences, the Department of Computer Science, the University of California, Irvine. Ramesh has been an active researcher in multimedia information systems, image databases, machine vision, and intelligent systems. While he was at the University of Michigan, Ann Arbor and the University of California, San Diego, he founded and directed artificial intelligence and visual computing labs. He was also the founding Editor-in-Chief of IEEE MultiMedia magazine and Machine Vision and Applications journal and serves on the editorial boards of several magazines in multimedia, business and image and vision processing. He has co-authored more than 250 research papers in well-respected journals and conference proceedings. Among his co-authored and co-edited books include Machine Vision, a textbook used at several universities. Ramesh has been elected Fellow of ACM, IEEE, IAPR, AAAI, and SPIE. He enjoys working with companies, is involved in research, and enjoys writing. His current research is in experiential systems and their applications.