JOURNAL OF BACTERIOLOGY, Dec. 2006, p. 8259–8271 0021-9193/06/$08.00⫹0 doi:10.1128/JB.00740-06 Copyright © 2006, American Society for Microbiology. All Rights Reserved.
Vol. 188, No. 23
Experimental and Computational Assessment of Conditionally Essential Genes in Escherichia coli䌤 Andrew R. Joyce,1,2† Jennifer L. Reed,2† Aprilfawn White,3,4 Robert Edwards,5,6 Andrei Osterman,6,7 Tomoya Baba,8 Hirotada Mori,8,9 Scott A. Lesely,3,4 Bernhard Ø. Palsson,2* and Sanjay Agarwalla3,4*† Program in Bioinformatics, University of California, San Diego, La Jolla, California 920931; Department of Bioengineering, University of California, La Jolla, California 920932; The Joint Center for Structural Genomics3 and The Genomics Institute of the Novartis Research Foundation, San Diego, California 921214; Center for Microbial Sciences, San Diego State University, San Diego, California 921825; Fellowship for the Interpretation of Genomes, Burr Ridge, Illinois 605276; Burnham Institute for Medical Research, La Jolla, California 92037;7 Graduate School of Biological Sciences, Nara Institute of Science and Technology (NAIST), Ikoma, Nara, Japan8; and Advanced Institute of Biosciences, Keio University, Tsuruoka, Yamagata 997-0017, Japan9 Received 22 May 2006/Accepted 9 September 2006
Genome-wide gene essentiality data sets are becoming available for Escherichia coli, but these data sets have yet to be analyzed in the context of a genome scale model. Here, we present an integrative model-driven analysis of the Keio E. coli mutant collection screened in this study on glycerol-supplemented minimal medium. Out of 3,888 single-deletion mutants tested, 119 mutants were unable to grow on glycerol minimal medium. These conditionally essential genes were then evaluated using a genome scale metabolic and transcriptional-regulatory model of E. coli, and it was found that the model made the correct prediction in ⬃91% of the cases. The discrepancies between model predictions and experimental results were analyzed in detail to indicate where model improvements could be made or where the current literature lacks an explanation for the observed phenotypes. The identified set of essential genes and their model-based analysis indicates that our current understanding of the roles these essential genes play is relatively clear and complete. Furthermore, by analyzing the data set in terms of metabolic subsystems across multiple genomes, we can project which metabolic pathways are likely to play equally important roles in other organisms. Overall, this work establishes a paradigm that will drive model enhancement while simultaneously generating hypotheses that will ultimately lead to a better understanding of the organism. sion of 479 out of the 906 metabolic genes (6). COBRA methods are available to predict which metabolic and regulatory genes are required for growth under given environmental conditions (7, 11, 43, 44). Knowledge of which genes in an organism are essential and under what conditions they are essential is of fundamental and practical importance. This knowledge provides us with a unique tool to refine the interpretation of cellular networks and to map critical points in these networks. Examples of applications in which this information may be useful include engineering industrial microbial strains, as well as developing novel anti-infective agents. The importance of this emerging field devoted to investigations of gene essentiality is widely accepted, as witnessed by the rapid accumulation of genomewide essentiality data, which are now available for several model and pathogenic microbial species (1, 3, 16, 17, 19, 25, 27, 30, 42, 45, 48). From a modeling perspective, a major limitation of the previous gene essentiality studies of E. coli was that they were performed using only partial (18, 24, 52) (i.e., not all mutants were evaluated) or heterogeneous (“historical” single-gene studies of a variety of strains and conditions compiled in the Profiling of E. coli Chromosome database [http://www.shigen .nig.ac.jp/ecoli/pec/]) data. Data provided by the first published genome scale genetic-footprinting study of E. coli (16) are generally not amenable to immediate model-based interpretation, as they (i) captured a rather complex phenotype (fitness
The advent of whole-genome sequencing and other highthroughput experimental technologies provides system level measurements that are driving efforts to develop computational models of the cell. The constraint-based reconstruction and analysis (COBRA) approach (36) has emerged in recent years as a successful approach to modeling systems on a genome scale. The COBRA approach begins with developing a metabolic network reconstruction based on the annotated genome sequence, known biochemistry, and other physiological data (38). Known constraints, such as enzymaticreaction reversibility and maximum flux capacity, are then imposed on the network reconstruction to generate a model that defines all attainable network states (36). A current metabolic and regulatory model of Escherichia coli contains 932 unique metabolic reactions and Boolean logic statements for how 104 transcription factors regulate the expres-
* Corresponding author. Mailing address for Bernhard Palsson (computational work): Department of Bioengineering, University of California, San Diego, 9500 Gilman Dr. MC 0412, La Jolla, CA 920930412. Phone: (858) 534-5668. Fax: (858) 822-3120. E-mail: palsson @ucsd.edu. Mailing address for Sanjay Agarwalla (experimental work): The Genomics Institute of the Novartis Research Foundation, 10675 John Jay Hopkins Drive, San Diego, CA 92121. Phone: (858) 812-1500. Fax: (858) 812-1502. E-mail:
[email protected]. † Andrew R. Joyce, Jennifer L. Reed, and Sanjay Agarwalla contributed equally to this work. 䌤 Published ahead of print on 29 September 2006. 8259
8260
JOYCE ET AL.
within a competitive growth environment) and (ii) were obtained in undefined rich medium. The recent release of the first complete collection of viable single-gene knockout E. coli strains (1) has opened an opportunity for systemic, genome scale gene essentiality studies in minimal and defined growth media. The group responsible for generating this valuable resource also reported the first genome scale conditional-essentiality screen on rich medium and glucose-supplemented minimal medium (1). In this study, we used this strain collection to integrate high-throughput experimental data and computational modeling to assess E. coli gene essentiality for growth on glycerol-supplemented minimal medium. The results of this conditional-essentiality screen were analyzed in the context of the most current genome scale metabolic and transcriptional regulatory model (6). A systematic cross-validation of genome scale gene essentiality data with in silico predictions would play a critical role in refining the current metabolic reconstruction and the underlying model. At the same time, such an integrative analysis would assist in data analysis and interpretation in the structurednetwork context. For example, a recent study utilized the previously described integrated E. coli transcriptional-regulatory and metabolic model to validate its predictive capability against 13,750 growth phenotypes corresponding to 110 gene knockout strains grown under 125 different defined conditions (6). Discrepancies between the model predictions and experimental results pointed to poorly understood metabolic or regulatory events requiring further experimental investigation. The gene deletions evaluated in this previous study, however, covered less than 11% of the genes included in the current model. Here, we identify the set of genes needed for growth on glycerol-supplemented minimal medium and analyze the results using a genome scale metabolic and regulatory model. We show this approach to be useful for a rigorous global evaluation of the genome scale modeling predictive power while simultaneously identifying directions for model improvement. The gene essentiality data obtained in this study were generally in good agreement with the model predictions, as well as with the results of the previously reported screen on glucose-supplemented minimal medium (1). This work represents the most thorough assessment on a gene-by-gene basis of the E. coli constraint-based metabolic model and is the first modelbased evaluation of a truly genomewide gene essentiality screen on a single defined minimal medium for E. coli. MATERIALS AND METHODS High-throughput phenotyping of the E. coli gene knockout collection. A recently described collection of 3,888 E. coli single-gene deletion mutants was constructed (1; http://ecoli.naist.jp/) by the method of Datsenko and Wanner (9). To determine the phenotypes of deletion mutants in M9 minimal medium containing glycerol as the carbon source, the mutants were inoculated in LB medium in the presence of kanamycin (30 mg/liter) using a 96-pin tool and were grown overnight at 37°C. The overnight cultures were washed twice with phosphatebuffered saline and then inoculated in glycerol-supplemented M9 liquid medium with kanamycin. The liquid culture was grown at 37°C with agitation for about 24 h, and the optical density (OD) was measured at 600 nm. The ODs from all wells of a plate were averaged, and the mutants in the wells with less than one-third of the average OD were considered nongrowers or slow growers. The experiment was done in triplicate, and mutants that were below the one-third average OD cutoff in at least two of three experiments were selected. This initial
J. BACTERIOL. screen yielded about 230 deletion mutants that had slow or no growth on M9-glycerol medium. A secondary screen using the same procedure was repeated on this subset of mutants, using the same one-third of the average OD as the cutoff and yielded a final set of 119 E. coli deletion mutants that represented the conditionally essential complement of genes required for growth on glycerol. This second round of screening confirmed the genuine hits and eliminated false and nonreproducible hits. Each liter of M9 medium (Sigma catalog no. 6030) contained Na2HPO4 · 7H2O (6.8g), KH2PO4 (3g), NaCl (0.5g), NH4Cl (1g), MgSO4 (2 mM), CaCl2 (0.1 mM), glycerol (1%), and kanamycin (10 mg). For comparison with the conditionally essential genes reported in the recently published data for growth on glucose-supplemented minimal medium (1), we selected the 119 slowest growers based on the observed OD at 24 h. This set coincidently included nearly all of the strains with less than one-third of the average OD at 24 h for all strains tested. Computational predictions for essentiality. A previously developed metabolic model of E. coli (6, 39) was used to predict the metabolic genes and reactions essential for growth on glycerol minimal medium. The model was modified to take into account genetic differences between MG1655 and BW25113 and recent changes in the genome annotation (40). Five metabolic reactions were removed (L-arabinose isomerase, L-ribulokinase, rhamnulokinase, L-rhamnose isomerase, and rhamnulose 1-phosphate aldolase), since the associated genes (araBAD, rhaBAD, and lacZ) are absent in the BW25113 strain that was the parental background for the genetic manipulations. Based on recent updates to the E. coli genome annotation (40), two additional metabolic genes (dfp and coaE) were also included in the metabolic model by associating them with three reactions involved in coenzyme A (CoA) biosynthesis that previously had no genes associated with them. Furthermore, atpI was removed from the model, since evidence suggested it did not participate in the ATP synthase complex (14). Additional changes in the genome annotation (40) also have merged (tdcG, araH, and ytfR) and split (dgoAD and glcEF) some genes included in the model. As a result, 899 metabolic genes are accounted for in the metabolic model and an additional 104 transcription factors are used in the combined metabolic and regulatory model. Growth on glycerol minimal medium was simulated by maximizing flux through a defined biomass objective function and allowing the uptake of glycerol, NH4, SO4, O2, and Pi and the free exchange of H⫹, H2O, and CO2 (see reference 39 for further details). The biomass objective function is specified to define the weighted consumption of metabolites required to generate the cellular biomass. Simulations conducted in this manner represent approximations of the maximum attainable growth rate under the given environmental conditions and model specifications. The maximum growth rates of gene knockout strains were calculated with each gene independently removed from the network. When simulating the deletion of a gene, all associated reactions were removed from the network except for those reactions with isozymes. Gene deletions where the predicted maximum growth rate was zero were categorized as essential. To evaluate the effects of transcription factor mutants, a combined metabolic and regulatory model was used to evaluate whether the deletion of a transcription factor is lethal for growth on glycerol minimal medium (6, 39). The regulatory model contains Boolean logic statements describing the transcription factors and environmental conditions needed for metabolic genes to be expressed (7, 8). All calculations with only the metabolic model were done using SimPheny (Genomatica, San Diego, CA), and LINDO (Lindo Systems, Inc., Chicago, IL) was used to calculate growth rates for the combined metabolic and regulatory model. Cross-genome comparison of conditionally essential genes. We used The SEED genomic platform (http://theseed.uchicago.edu/FIG/index.cgi) for a crossgenome comparison of metabolic subsystems implicated by the set of conditionally essential E. coli genes identified in this study. A subsystem is defined in The SEED environment as a collection of functional roles (enzymes, transporters, or regulators) known to be involved in a well-defined biological process, such as a subnetwork (a cluster of pathways) associated with a particular aspect of metabolism (e.g., glycolysis) (34). A populated subsystem is defined as a table of tentative role-to-gene connections asserted by curators for a broad range of species containing a functional variant of this subsystem (51). In this study, we used The SEED tools to generalize the data from the described essentiality screen in a broader phylogenetic context. This approach circumvents certain limitations of traditional gene-by-gene comparisons, as there are reported cases where the same reaction or functional role can be implemented by nonorthologous enzymes in different species (28). Briefly, a table was constructed that relates conditionally essential genes (both identified by the experiment and predicted by computational modeling) to The SEED collection of metabolic subsystems. For further analysis, this table was simplified to a set of binary associations (one gene to one “primary” subsystem) and limited to the approximately 20 key subsystems that contained more than
VOL. 188, 2006
COMPUTATIONAL ANALYSIS OF ESSENTIAL GENES IN E. COLI
8261
TABLE 1. Essential genes for growth on glycerol minimal mediuma Group
Gene (Blattner no.)
Amino acid metabolism ....................................... argA (b2818) argE (b3957) argH (b3960) aroA (b0908) aroB (b3389) aroC (b2329) aroD (b1693) aroE (b3281) cysC (b2750) cysD (b2752) cysE (b3607) cysH (b2762) cysI (b2763) cysJ (b2764) cysK (b2414) cysN (b2751) cysP (b2425) [cysQ (b4214)] glyA (b2551) hisA (b2024) hisB (b2022) hisC (b2021) hisD (b2020) hisE (b2025) hisG (b2019) hisH (b2023) hisI (b2026) ilvA (b3772) ilvB (b3671) ilvC (b3774) ilvD (b3771) leuA (b0074) leuB (b0073) leuC (b0072) leuD (b0071) lysA (b2838) metA (b4013) metB (b3939) metC (b3008) metF (b3941) metL (b3940) pabA (b3360) pabB (b1812) pheA (b2599) proA (b0243) proB (b0242) proC (b0386) serA (b2913) serB (b4388) serC (b0907) thrA (b0002) thrB (b0003) thrC (b0004) trpA (b1260) trpB (b1261) trpC (b1262) trpD (b1263) trpE (b1264) tyrA (b2600) Purine and pyrimidine biosynthesis.................... carA (b0032) carB (b0033)
Group
Gene (Blattner no.)
guaA (b2507) guaB (b2508) purA (b4177) purC (b2476) purD (b4005) purE (b0523) purF (b2312) purH (b4006) purK (b0522) purL (b2557) purM (b2499) pyrB (b4245) pyrC (b1062) pyrD (b0945) pyrE (b3642) pyrF (b1281) thyA (b2827) Cofactor production..................................................... folB (b3058) folP (b3177) iscC (b2530) nadA (b0750) nadB (b2574) nadC (b0109) panB (b0134) panC (b0133) panD (b0131) pdxA (b0052) pdxB (b2320) pdxH (b1638) pdxJ (b2564) ubiG (b2232) ubiH (b2907) Regulatory proteins...................................................... cysB (b1275) fruR (b0080) [leuL (b0075)] metR (b3828) Transport ....................................................................... crr (b2417) cysA (b2422) cysU (b2424) [fes (b0585)] ptsI (b2416) Others ............................................................................ atpA (b3734) atpB (b3738) atpC (b3731) atpF (b3736) atpG (b3733) atpH (b3735) glmM (b3176) glnA (b3870) glpD (b3426) glpK (b3926) gltA (b0720) icd (b1136) ppc (b3956) [prfB (b2891)] [rpsU (b3065)] [yhhK (b3459)] [yjhS (b4309)]
a The 119 genes identified as being required for growth on glycerol M9 minimal medium are divided into six groups based on shared annotations and/or properties. The 26 genes that appear in bold-face represent genes that were not predicted to be essential by the model and were not associated with essential reactions (described in further detail in the text and Table 2). The seven genes in brackets are the essential genes identified in this study that do not appear in the model.
8262
JOYCE ET AL.
J. BACTERIOL.
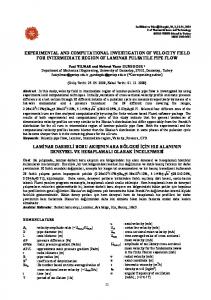
FIG. 1. Comparisons between experimental data and model predictions for gene essentiality under minimal-medium conditions. In silico gene deletion studies were carried out by evaluating the effect of deleting a gene from the model. If the model was unable to generate all of the biomass components due to a gene deletion, as determined by flux balance analysis, then the mutant was considered lethal. Experiments were also conducted by testing for growth in glycerol-supplemented minimal medium using the 3,888 mutants that were viable when grown in rich medium. In total, 819 out of the 896 mutants (91%) showed growth behaviors in glycerol minimal medium in agreement with computational predictions. KO, knockout.
two experimentally defined essential genes. We then examined operational variants of these subsystems (as defined by a subsystem curator) over a diagnostic set of 31 species with available completely sequenced genomes spanning much of the known bacterial phylogeny. For illustrative purposes, we used the same set of genomes as in the previous analysis of genetic-footprinting data (16) (see supplementary Table 4 [http://systemsbiology.ucsd.edu/publications/supplemental _material/JBact2006/]). For this simplified analysis, we monitored only the presence or absence of at least a minimal functional variant for each subsystem and each genome in the set. The results were hierarchically clustered for visualization and analysis purposes (see Fig. 6) using the Hamming distance metric and average linkage. Quantitative RT-PCR measurements of gene expression. Real-time RT-PCR was used to quantify gene expression levels for genes related to glycerol metabolism (glpK, glpD, glpB, gpsA, gldA, and dhaM). Total RNA was extracted from cells harvested from mid-log-phase cultures of E. coli strain BW25113 (9) grown on glucose-supplemented (A600 ⬇ 0.5) and glycerol-supplemented (A600 ⬇ 0.3) M9 minimal medium (2 g/liter). Triplicate RNA samples (biological replicates) were stabilized using RNAProtect Bacterial Reagent (QIAGEN) and isolated using the RNeasy mini kit (QIAGEN). Synthesis of cDNA was performed using SuperScript III (Invitrogen) and purified using the QIAquick PCR Purification kit (QIAGEN). The resulting cDNA samples were used in subsequent real-time reverse transcription (RT)-PCR assays using the QuantiTect SYBR Green PCR kit (QIAGEN) and iCycler iQ system (Bio-Rad). Nine replicate measurements (three technical replicates for each biological replicate) were performed for each assayed gene under both growth conditions. The acyl carrier protein (ACP)encoding gene acpP was used as a reference for each assay. A standard curve was generated by varying amounts of genomic DNA with fixed primer concentrations and was used to calculate primer efficiencies. The reported relative expression levels for each gene were determined by normalizing the amount of cDNA product to acpP cDNA quantified from the same cDNA sample.
RESULTS By evaluating single-gene deletion strains for growth on glycerol-supplemented minimal medium, we identified genes essential for growth in a minimal-medium environment that are not essential in a rich-medium environment. A genome scale metabolic and regulatory model was used to evaluate the data and to identify any discrepancies between the model and the
experimental data. In addition, the essential genes identified in this study were compared to gene essentiality data for growth on glucose-supplemented minimal medium (1), and their phylogenetic distribution across multiple genomes was evaluated. Experimentally essential genes for growth on glycerol minimal medium. Of the 3,888 single-gene deletion E. coli mutants viable on rich medium and screened in this study, 119 were reproducibly incapable of growth on glycerol minimal medium (Table 1; for complete results, see supplementary Tables 1 and 2 [http://systemsbiology.ucsd.edu/publications/supplemental _material/JBact2006/]). Most of these conditionally essential genes are involved in core metabolic processes: amino acid metabolism (59 genes), nucleotide metabolism (19 genes), cofactor metabolism (15 genes), and transport (5 genes). Seventeen genes are involved in other miscellaneous processes, and four regulatory genes were also found to be conditionally essential. Only seven (cysQ, fes, leuL, prfB, rpsU, yhhK, and yjhS) of the 119 identified essential genes are not accounted for in the current metabolic and regulatory model, since the genes do not encode metabolic enzymes or transcription factors with known functions. While the specific role of cysQ in sulfate assimilation is unknown (33), it is an important component of cysteine biosynthesis. fes is important for iron transport and utilization of ions in low-concentration environments, such as that used in this minimal-medium study (10). Alteration of transcriptional attenuation (32) mediated regulation of the leuLABCD operon (50), which encodes the proteins critical for leucine biosynthesis, and likely explains the essentiality of the leader peptide encoded by leuL. Several other nonmodel genes encoding PrfB (a peptide chain release factor) and RpsU (30S ribosomal subunit S21), as well as the observed conditional essentiality of the uncharacterized genes yhhK (a putative acyltransferase) and yjhS, cannot be readily interpreted without further exper-
COMPUTATIONAL ANALYSIS OF ESSENTIAL GENES IN E. COLI
VOL. 188, 2006
8263
TABLE 2. Discrepancies between experimental identification and model prediction for essential and nonessential genesa Rationale
False negatives Molecules not included in biomass Model includes alternative pathways/ isozymes Model predicts impaired but not lethal phenotype Regulatory effect on glpK False positives Model biomass components which might not be essential components
Unaccounted-for transport mechanisms Unaccounted-for metabolic enzymes
Subsystem
Gene(s) (Blattner no.)
ubiG (b2232); ubiH (b2907) pdxA (b0052); pdxB (b2320); pdxH (b1638); pdxJ (b2564) iscC (b2530) carA (b0032); carB (b0033); glpD (b3426); glyA (b2551); proA (b0243); proB (b0242); thrB (b0003); thrC (b0004) atpA (b3734); atpB (b3738); atpC (b3731); atpF (b3736); atpG (b3733); atpH (b3735) crr (b2417); glpK (b3926); ppc (b3956); ptsI (b2416); fruR (b0080)
Ubiquinone biosynthesis Pyridoxine biosynthesis Thiamine biosynthesis Amino acid biosynthesis ATP synthase PTS/PEP metabolism
Fatty acid and lipid biosynthesis Glycogen LPS synthesis
Spermidine synthesis Ammonium transport Glycerol transport Sulfate transport Arginine biosynthesis Aspartate biosynthesis Branced amino acid biosynthesis Central metabolic Cofactor biosynthesis Glycolytic Lysine biosynthesis Nucleotide biosynthesis and salvage
cls (b1249); fabF (b1095) glgA (b3429); glgC (b3430) dgkA (b4042); gmhA (b0222); gmhB (b0200); lpxL (b1054); msbB (b1855); rfaC (b3621); rfaD (b3619); rfaE (b3052); rfaF (b3620); rfaG (b3631); rfaI (b3627); rfaJ (b3626); rfaL (b3622) pfs (b0159); speD (b0120); speE (b0121) amtB (b0451) glpF (b3927) cysW (b2423) argB (b3959); argC (b3958); argD (b3359); argG (b3172) aspC (b0928) ilvY (b3773); ilvE (b3770); lrp (b0889) aldA (b1415) coaA (b3974); coaE (b0103); pabC (b1096) pgi (b4025) dapF (b3809); ushA (b0480); lysR (b2839) pyrI (b4244); trxB (b0888); ndk (b2518)
a Twenty-six false-negative cases in which the model incorrectly predicted growth of the gene deletion strain were identified, in addition to 42 false-positive cases in which the model incorrectly predicted that genes were essential. Each case is grouped based on the likely rationale for the discrepancy and the gene functional annotation.
imental investigation. The remaining 112 essential genes and nonessential genes can be compared to predictions made with the current metabolic and regulatory model. Model-based evaluation of essential genes. Given that most of the essential genes involve metabolic genes and metabolic regulators, we conducted a detailed comparison of the experimentally observed and computationally predicted essential genes (Fig. 1 and Table 1). Computational analysis of singlegene deletion events predicted 182 genes (177 metabolic and 5 regulatory genes) to be lethal and thus required for growth in glycerol minimal medium. Nearly half of these genes were still predicted to be essential by the model even if all transportable metabolites were allowed to be taken up by the cell simultaneously, so they are likely to be essential for growth on rich medium, as well. Among the 182 model-predicted lethal mutants, 63 were not present in the analyzed collection. Although a fraction of these missing mutants may reflect technical failures, most of them are associated with genes expected to be essential under any environmental conditions. Such genes are typically responsible for producing essential metabolites that cannot be salvaged even from rich medium. As shown in Fig. 1, ⬃69% of experimentally identified conditionally essential genes covered by the model (77 of 112) were predicted to be essential by evaluating in silico singlegene deletions. An additional 8% of experimentally essential genes (9 of 112) would be correctly predicted by the model to be essential if additional isozymes were not present, possibly
indicating that the expression of alternative isozyme-encoding genes is not sufficient to compensate for growth on glycerol minimal medium. Alternatively, these nine cases may point to incorrect functional assignment of some paralogs. This leaves 26 essential genes unexplained by the model, in which the experimentally observed essential genes are associated with predicted nonessential model genes (Table 2 and supplementary Table 3 [http://systemsbiology.ucsd.edu/publications /supplemental_material/JBact2006/]). Six genes out of these 26 discrepancies (atpA, atpB, atpC, atpF, atpG, and atpH) are part of the ATP synthase complex. According to the model, the deletion of the ATP synthase reaction should not be lethal but it should reduce the maximum growth rate by ⬃75%, which may be close to the viability threshold used in this study. Interestingly, two other components of the ATP synthase complex (atpD and atpE) were deemed nonessential in our experimental screen. An additional large subset of these discrepancies (9 of 26) appear to be caused by the existence of alternative pathways available within the metabolic model but whose genes are probably not expressed in vivo under the conditions of this screen. For example, proA and proB can be functionally replaced in the model by the combined action of argA, argB, argC, and argE gene products in proline biosynthesis, since both result in the production of glutamate-5-semialdehyde (Fig. 2). However, this alternate pathway is observed experimentally only in double-deletion strains, where an argD dele-
8264
J. BACTERIOL.
JOYCE ET AL. argA
L-glutamate argB
proB
proA
argE
argC
Spontaneous Reaction
argD
proC
argE
L-proline argF or argI
L-aspartate argG
argH
L-arginine
Fumarate
FIG. 2. Essential genes involved in arginine and proline biosynthesis. The map shows the biosynthesis pathway for the conversion of glutamate (upper left) into arginine and proline. Red arrows are used to indicate reactions associated with an experimentally identified essential gene in glycerol-supplemented minimal medium, while gray arrows indicate reactions in which the associated gene(s) is experimentally nonessential. Associated genes are listed next to their corresponding reactions (“or” indicates that the gene encodes isozymes). Gene names listed in black indicate that the model makes an incorrect prediction regarding essentiality, while those in gray indicate the model and data are in agreement. The genes proB and proA are both essential experimentally during growth on minimal medium, but the model predicts that argA, argB, argC, and argE can be used instead to produce glutamate 5-semialdehyde for proline biosynthesis.
tion leads to increased levels of N-acetylglutamic ␥-semialdehyde, which is then converted into glutamate 5-semialdehyde by argE, thereby allowing compensation for the second deletion, either proA or proB (23). Another subset of these discrepancies (7 of 26) are associated with the biosynthesis of vitamins and cofactors: pyridoxal 5-phosphate (pdxABHJ), thiamine (iscS), and ubiquinone (ubiGH) (Fig. 3), largely reflecting the fact that the need to produce these cofactors was not duly accounted for in the biomass objective function. The ubiG and ubiH gene products are essential for growth on glycerol minimal medium, while other gene products involved in the ubiquinone biosynthesis pathway are essential during growth on rich medium (1) (ubiA, ubiB, and ubiD) and still others are not essential under either condition (ubiC, ubiX, and ubiF). Several discrepancies related to phosphoenolpyruvate (PEP) metabolism and the PEP-carbohydrate phosphotransferase systems (PTS) likely resulted from posttranscriptional regulation of GlpK (glycerol kinase) that is not accounted for in the metabolic or regulatory model. It is known that deletion of ppc (encoding the enzyme PEP carboxykinase) leads to the
accumulation of PEP, which allosterically inhibits glycolytic enzymes, such as Pgi and Pfk (12). This inhibition would lead to an increase in Pgi and Pfk metabolic intermediates, including fructose 1,6-bisphosphate, a potent allosteric inhibitor of GlpK (22) (Fig. 4). Two PTS genes, ptsI and crr, were also detected as discrepancies in this study, in which the model predicts an observed essential gene to be nonessential. PTS enzyme I, encoded by ptsI, is phosphorylated in a reaction with PEP in the first step of the PTS, and crr encodes PTS glucose-specific enzyme IIA (EIIAGlc), which is another intermediate that transfers the PTS phosphate to glucose. EIIAGlc is also a central regulatory molecule in E. coli metabolism (35), and in its unphosphorylated form, EIIAGlc binds and allosterically inhibits GlpK, thus ultimately impeding glycerol uptake and metabolism (21, 22). Phosphorylation of EIIAGlc releases GlpK, however, and facilitates normal glycerol uptake and metabolism. Therefore, a ptsI deletion would interfere with the transfer of a phosphate to EIIAGlc and block the release of GlpK inhibition. The deletion of crr is more difficult to explain in this context, as one might expect that the resultant constitutive relief of EIIAGlc inhibition would lead to enhanced glycerol uptake and metabolism. The observed essentiality of crr likely stems from the general disruption of its other critical cellular roles. For example, phosphorylation of EIIAGlc activates adenylate cyclase, and accordingly, the crr mutant has reduced cyclic AMP levels (29), likely resulting in potentially harmful pleiotropic effects due to improper global gene regulation by crp. Despite these readily explained results, we do not yet have a rationale for the observed nonessentiality of ptsH and cyaA, which encode the PTS protein HPr and adenylate cyclase, respectively. Model-based evaluation of nonessential genes. In addition to the strong correlation between conditionally essential genes, there is also good agreement between the predicted and observed nonessential genes. Of the 3,769 observed nonessential genes, 784 are represented in the model, and ⬃95% (742 of 784) of these are correctly predicted to be nonessential by the model (Fig. 1). This leaves 42 discrepancies (listed in Table 2 and supplementary Table 3 [http://systemsbiology.ucsd.edu /publications/supplemental_material/JBact2006/]) where the model incorrectly predicts genes to be essential. Some of these 42 predicted essential genes not identified in the experimental screen are involved in the biosynthesis of biomass components, such as lipopolysaccharide (LPS), spermidine, and glycogen, which in fact may not be essential biomass components. For example, it is known that a complete LPS is not required for growth (37). For other biomass components like arginine and lysine, a rationale for the observed discrepancies may be related to the existence of alternative reactions and/or isozymes that are unaccounted for in the model. For example, argD encodes an enzyme with dual activity as both acetylornithine aminotransferase (EC 2.6.1.11; required for arginine biosynthesis) and N-succinyl-L,L-diaminopimelate aminotransferase (EC 2.6.1.17; required for lysine biosynthesis) and is predicted to be essential by the model. The astC gene (also known as argM) encodes an enzyme with succinyl- and acetylornithine aminotransferase activities and has been speculated to have N-succinyl-L,L-diaminopimelate aminotransferase activity, as well (16). As another example, both coaA and coaE gene products
VOL. 188, 2006
COMPUTATIONAL ANALYSIS OF ESSENTIAL GENES IN E. COLI
8265
FIG. 3. Model-based evaluation of experimentally essential genes involved in cofactor biosynthesis. The map shows the metabolic pathways involved in vitamin and cofactor metabolism, where biosynthesis proceeds in the downward direction and the end products are indicated below each pathway. Red and blue arrows are used to indicate reactions associated with experimentally identified essential genes in glycerol minimal medium and rich medium (1), respectively. Gray lines indicate cases in which the gene(s) associated with the corresponding reaction was experimentally nonessential. Only the experimentally essential genes are listed next to the corresponding reactions. “&” indicates that the genes form a complex. For pathways containing essential genes, a “No Gene” designation is placed next to reactions that lack a corresponding gene assignment. Gene names listed in black indicate discrepancies between the model predictions and experimental data (i.e., the model predicts a nonlethal phenotype for growth on glycerol minimal medium but the gene deletion is lethal experimentally), and genes in gray indicate agreement (both model and data predict essentiality). Genes in black next to gray reactions (coaA, coaE, aldA, and pabC) indicate that the model predicts that a gene deletion is essential whereas the corresponding mutant strain is viable. Note that unlabeled gray reactions also represent agreement of the model prediction and experimental data, as both find the associated gene(s) to be nonessential.
are required to produce CoA; however, neither gene was essential in rich medium or glycerol minimal medium, while the remaining genes involved in the pathway were essential (Fig. 3). Other enzymes may be present which can carry out these essential reactions, although it is likely that the apparent viability of at least one of these strains (coaE) was due to a yet-unknown artifact, since the coaE gene (formerly yacE) was shown to be essential in a number of mutant studies (16, 20).
Two transporters were also computationally predicted to be essential, glpF and amtB. Although in the model these are the only transporters for glycerol and ammonia, respectively, both compounds freely diffuse through membrane vesicles (13, 26) and their transporters are likely essential only at very low solute concentrations. We subsequently tested the growth capabilities of the ⌬glpF mutant (after removal of the kan gene as previously described [9]) on different concentrations of glyc-
8266
JOYCE ET AL.
J. BACTERIOL.
FIG. 4. Essential genes involved in glycerol metabolism. The pathway map in the center shows the metabolic pathways involved in the first steps of glycerol metabolism. Red and blue arrows are used to indicate reactions associated with experimentally identified essential genes in glycerol minimal medium and rich medium (1), respectively. Gray lines indicate cases in which the gene(s) associated with the corresponding reaction was experimentally nonessential. Associated genes are listed next to their corresponding reactions (“or” indicates that the genes encode isozymes, and “&” indicates that the genes form a complex). Gene names listed in black indicate that the model makes an incorrect prediction regarding essentiality, while those in gray indicate that the model and data are in agreement. The phosphorylation of dihydroxyacetone is carried out by DhaKLM coupled with PtsHI; of these five genes, only ptsI is essential during growth on minimal medium. Three enzymes can convert glycerol 3-phosphate into dihydroxyacetone phosphate, but the data indicate that glpD is the only essential gene. The model predicts that the only gene that is essential on this map is glpF, the glycerol transporter, since the conversion of glycerol into dihydroxyacetone phosphate can proceed through either of two routes. The four plots show results from quantitative RT-PCR performed to assess the expression levels of genes that encode enzymes associated with reactions on the map. Gene expression levels during growth on glucose-supplemented and glycerol-supplemented M9 minimal medium are reported relative to levels of the control gene acpP (mean ⫾ standard error). The gene expression data indicate that the GlpK-GlpD branch is dominantly active during growth on glycerol-supplemented minimal medium, in agreement with the conditional-essentiality data.
erol to confirm this hypothesis. As the glycerol concentrations were reduced (from 2 g/liter to 0.25 g/liter), the ⌬glpF mutant strain had increasingly lower growth rates than the BW25113 parental strain (see the supplementary figure [http: //systemsbiology.ucsd.edu/publications/supplemental_material /JBact2006/]). At a glycerol concentration of 0.125 g/liter, the parental strain was able to grow at a lower rate, whereas growth for the ⌬glpF mutant strain was abolished. Similar observations have been made in previous ammonium-limited growth experiments for amtB mutants, and it was speculated that 10 M NH4⫹ concentrations would be needed to see growth defects in ⌬amtB strains (46). Combined analysis of both essential and nonessential genes indicated a total of 68 discrepancies (only ⬃8% of total predictions) between experimental and computational essentiality assignments (Table 2). These discrepancies can be grouped into three types, pointing to possible model improvements with respect to boundary conditions (a formula for essential biomass components), gene-reaction associations (annotations), and quantitative constraints for the passive uptake of nutrients (nonspecific transport).
Comparison of genome scale conditional-essentiality data sets. In the recently published description of the “Keio collection” (1), the authors described the conditional essentiality of the single-gene knockout strains when grown on glucose-supplemented minimal 3-N-(morpholino) propane sulfonate (MOPS) medium. Using this data set, we identified the 119 slowest growers on glucose-supplemented minimal medium by ranking the ODs measured at 24 h. For the purposes of this analysis, this subset represents the conditionally essential genes required for growth on glucose minimal medium. The collection of conditionally essential genes largely overlaps the glucose-specific and glycerol-specific data sets (Fig. 5). The genes found in this overlapping group primarily include those required to form biomass components in the absence of rich medium, such as nucleotides and amino acids, as well as those needed to generate required cofactors, such as NAD(P), CoA, folates, and pyridoxal 5-phosphate. Accordingly, these genes represent a conserved conditionally essential core that is required for E. coli to grow under minimally supplemented growth conditions and is not required for growth under rich (i.e., LB medium) conditions.
VOL. 188, 2006
COMPUTATIONAL ANALYSIS OF ESSENTIAL GENES IN E. COLI
FIG. 5. Glycerol- versus glucose-supplemented minimal medium essential genes. The overlap between the data set presented in this work and the recently published data for conditionally essential genes for growth on glucose-supplemented minimal medium (1) is shown. A large majority of conditionally essential genes are consistent between the glycerol and glucose data sets, with a relatively small fraction of conditionally essential genes apparently specific to one growth condition or the other. Brief descriptions of the condition-specific essential genes are provided on the left (glycerol specific) and right (glucose specific) of the Venn diagram, and a more detailed treatment is provided in the text.
Relatively few genes are conditionally essential for growth on glucose relative to growth on glycerol (Fig. 5). Among the glucose-specific conditionally essential genes are 10 that may simply be slow growers, as their ODs after 48 h were substantially increased. Furthermore, three (argB, argC, and metE) were likely false positives, given their nonessentiality in independent phenotype microarray screens (18, 24), while one (argG) agrees with prior studies (24). Perhaps more interesting are the six biotin biosynthesis-related genes that are essential in glucose- but not glycerol-supplemented growth on minimal medium. This discrepancy involving all biotin biosynthesis genes may indicate an unidentified source of biotin in the glycerol essentiality screens. Five additional genes (ilvE, cysG, ubiE, exoX, and hflD) are also glucose-specific essential genes, although the rationale for their conditional essentiality remains unclear. An equal number of genes have been observed to be essential for growth on glycerol as opposed to specific growth on glucose. Four genes in this set of glycerol-specific conditionally essential genes are directly related to glycerol metabolism or its regulation. As previously described, glpK and glpD are involved in the initial steps of glycerol catabolism, while crr and cra (also known as fruR) are key components of the PTS and mediators of catabolite repression. The differential essentiality of ubiG and ubiH can be explained by the requirement for an electron acceptor for growth on glycerol and the utilization of ubiquinone in oxygen respiration (15). This suggests that ubiC, ubiE, and ubiF should also be essential for aerobic growth on glycerol; however, this conflicts with the observed experimental results. Another six genes in this glycerol-specific set are involved in sulfate transport and assimilation (cysADKPQU). This result likely stems from the fact that the medium used in the glucose essentiality screen contains MOPS, which can be utilized as a sulfur source under sulfate-limited conditions (4), whereas the M9 minimal medium used in this glycerol-specific screen does not contain an alternative sulfur source besides sulfate. M9 minimal medium does not include iron, whereas MOPS minimal medium contains 10 mM of iron; this difference in me-
8267
dium formulations accounts for the fact that fes (encoding an iron-scavenging protein) is essential in glycerol-supplemented M9 medium and not in MOPS-supplemented glucose medium. A glmM deletion has previously been reported to be essential (31), which agrees with the essentiality of glmM reported in this glycerol lethal data set and may represent a false-negative result in the glucose conditional-essentiality data set. ATP synthase components were also found to have different essentiality results, with atpABCFGH being essential for growth on glycerol and only atpBC being essential for growth on glucose. For both minimal-medium conditions, another ATP synthase component, atpD, was not essential. Finally, seven additional genes conditionally essential for growth on only glycerol-supplemented medium remain difficult to explain. Phylogenetic distribution of conditionally essential subsystems. The analysis of conditionally essential genes in the context of metabolic subsystems described in The SEED projected over a diagnostic set of 31 diverse bacterial genomes is illustrated in Fig. 6. Only those subsystems that contained more than two experimentally defined genes conditionally essential for growth on glycerol minimal medium are shown. Overall, 103 out of 119 experimentally essential genes (as well as 11 additional genes predicted by the model to be essential) are covered by a rather small set of 18 subsystems (a complete list of gene-to-subsystem correspondences is provided in supplementary Table 4 [http://systemsbiology.ucsd.edu/publications /supplemental_material/JBact2006/]). Although this deliberately simplified analysis masks substantial differences between the specific variants of subsystems (or pathways) implemented in different species, it reveals some important trends. First, the majority of organisms possess an operational variant of most of these conditionally essential subsystems. Not surprisingly, the group of organisms that lack functional versions of many of these essential subsystems, albeit phylogenetically quite diverse, are all obligate pathogens or symbionts, many of them intracellular. In particular, five species (Borrelia burgdorferi, Chlamydia trachomatis, Mycoplasma pneumoniae, Rickettsia prowazekii, and Treponema pallidum) lack functional variants in all but two to four subsystems. Moreover, the most conserved subsystem across all organisms examined (glycine, serine, and threonine synthesis) is represented in these species by only a single-enzyme pathway (serine hydroxymethyltransferase [EC 2.1.2.1]). In stark contrast, 15 organisms share each of the 18 identified conditionally essential subsystems with E. coli. This observed dichotomy reflects two drastically different lifestyles, as these 15 organisms are able to thrive outside of a host. This analysis confirms that nearly all subsystems implicated by this conditional-essentiality study in a single model organism are universally important for a broad range of phylogenetically distant free-living bacteria. DISCUSSION The screening of single-gene deletion mutants on glycerol minimal medium provides a meaningful addition to the collection of data regarding essential genes for E. coli. With the combination of other such genome scale gene essentiality studies, we continue to refine our notion of what genes are required for growth on rich and minimal media. From a com-
8268
JOYCE ET AL.
J. BACTERIOL.
FIG. 6. Phylogenetic distribution of essential genes by subsystem. The phylogenetic distribution of essential subsystems (see Materials and Methods for further details) across a diverse set of bacterial species is shown. Each row of the heat map corresponds to one of the 18 essential subsystems that were considered; next to each subsystem name, in parentheses, is the number of essential genes (both experiment and model assessed) found in the subsystem in E. coli over the total number of genes found in the subsystem in E. coli. Each column represents one of the 31 representative organisms used in this analysis. The dark-gray elements indicate the presence of the subsystem within the organism, whereas light gray indicates its absence. The dendrograms display the result of hierarchical clustering using the Hamming distance metric and average linkage for subsystems (left) and organisms (top), respectively. Organism abbreviations are as follows: ATU, Agrobacterium tumefaciens; AQA, Aquifex aeolicus; BAS, B. subtilis; BOB, B. burgdorferi; BRJ, Bradyrhizobium japonicum; BRM, Brucella melitensis; BUA, Buchnera aphidicola; CAJ, Campylobacter jejuni; CAC, Campylobacter crescentus; CHT, C. trachomatis; CLA, Clostridium acetobutylicum; COG, Corynebacterium glutamicum; DER, Deinococcus radiodurans; FUN, Fusobacterium nucleatum; HAI, Haemophilus influenzae; HEP, Helicobacter pylori; LIM, Listeria monocytogenes; MYT, Mycobacterium tuberculosis; MYP, M. pneumoniae; NEG, Neisseria gonorrhoeae; NOS, Nostoc; PSA, Pseudomonas aeruginosa; RAE, Ralstonia eutropha; RIP, R. prowazekii; SHO, Shewanella oneidensis; STA, Staphylococcus aureus; STP, Streptococcus pneumoniae; SYN, Synechocystis; THM, Thermotoga maritima; TRP, T. pallidum; XYF, Xylella fastidiosa.
parison of genes required for growth under rich- and minimalmedium conditions, a toolkit of genes enabling growth in limiting environments can be identified. By studying the genes required for growth on glycerol minimal medium, we showed that (i) our understanding of the roles that these essential genes play in this toolkit is clear and relatively complete, as only two putative genes of unknown function (yjhS and yhhK) were identified as essential in this phenotyping screen; (ii) the current metabolic and regulatory model is highly accurate in its essentiality predictions; and (iii) comparisons of model predictions and high-throughput phenotyping data represent a powerful approach to rapidly generate model refinements and hypotheses likely to lead to an enhanced understanding of the organism. Remarkably, 112 of the identified 119 conditionally essential genes are included in the current metabolic model. This observation suggests that the applied experimental approach has a very low rate of incorrectly identifying essential genes. Otherwise, nonmetabolic and uncharacterized genes (at least 40% of E. coli genes) would comprise a substantially larger fraction of the identified set. At the same time, it indicates that an inventory of E. coli metabolic genes captured in the current model (1,003 out of ⬃4,400 genes in the E. coli genome) is rather comprehensive, at least with respect to the pathways required to support growth on minimal medium. The fact that the identified conditionally essential gene set contained only
two genes of unknown function is notable but not surprising, since our screening protocol is conceptually equivalent to the identification of auxotrophs, a historical standard in the study of E. coli genetics. These experimentally essential genes can be mapped to metabolic subsystems, which allows a level of generalization enabling us to detect tendencies across multiple organisms that may be obscured by details of functional variants. This type of analysis readily facilitates the identification of metabolic functions that are required by different organisms without the potentially complicating details regarding how the molecules are synthesized. For example, Bacillus subtilis, E. coli, and Corynebacteria use three different chemistries in the lysine biosynthesis DAP (meso-diaminopimelate) pathway, but their purposes remain the same. It should be noted that these subsystem projections were made only for conditionally essential genes and not for genes that are essential for growth on rich medium (and likely essential in minimal-medium environments, as well). For example, only the portions of the pathways that are required for NAD and CoA biosynthesis on minimal and not rich medium are represented. Otherwise, these fundamentally essential subsystems would be present in all analyzed genomes. The set of conditionally essential subsystems (and genes therein) identified in this study may also be used to assess the metabolic potentials of organisms present in environmental samples as captured by emerging metagenomics data (49).
VOL. 188, 2006
COMPUTATIONAL ANALYSIS OF ESSENTIAL GENES IN E. COLI
Researchers will be able to rapidly assess the pathways present within an environmental sample and use the essentiality information to develop potential laboratory medium formulations to facilitate further controlled study in the laboratory (47). Furthermore, the presence of certain pathways and the absence of others may provide insights into the microenvironment from which the sample was taken and also indicate local intracommunity relationships between species that are present in the sample. This subsystem-based essentiality analysis approach could be a useful tool to add to the growing compendium of methods (5, 41) being developed to analyze and interpret these complex data. Further analysis of the generated gene essentiality data set was made using a metabolic and regulatory model allowing the data to be easily placed into biological context. Discrepancies between model and experiment can be used to improve the predictive capabilities of the model by indicating regions that are not captured accurately by the models or, more importantly, can point to areas in metabolism or regulation that require further experimental interrogation. For example, a number of independent gene deletion studies have shown that some genes involved in arginine biosynthesis are not essential (18, 24), but without these enzymes, the current literature cannot explain how this essential amino acid is synthesized. Therefore, further experiments need to be conducted to either identify novel arginine biosynthetic genes or determine which multifunctional enzymes can compensate for any perturbation of the genes. Additionally, based on the experimental results, several model improvements are suggested. Since a number of experimentally essential genes are involved in cofactor biosynthesis, a number of cofactors should be included in the biomass objective function used to conduct the growth prediction simulation. These cofactors include pyridoxal-5-phosphate, isoprenoids, hemes, ACP, and ubiquinone. These will help correct for the false negatives (lethal phenotypes with nonlethal model predictions) that account for a large number of discrepancies in both minimal- and rich-medium phenotypes (data not shown for rich medium). A wild-type biomass composition does not always correlate with an essential biomass composition; for example, only a core and not a complete LPS is required for cell survival (37). Accordingly, the essentiality of these and other biomass components can be refined or relaxed based on the nonessentiality of the corresponding biosynthetic-pathway genes. These issues are being addressed in a forthcoming updated metabolic reconstruction of E. coli (A. Feist and B. O. Palsson, personal communication) and represent a significant advance. Model improvements are also suggested with regard to the first steps of glycerol metabolism (Fig. 4). As previously noted, analysis of the false positives suggests that glycerol import can occur by passive transport across the cell membrane in the absence of the glpF-encoded transporter. Additionally, the initial enzymatic steps required to convert glycerol to dihydroxyacetone phosphate appear to be exclusively mediated by GlpK and GlpD rather than by GldA and the DhaKLM-PtsHI complex. This pathway bias is likely due to transcriptional regulatory effects. Indeed, the elevated expression of glpK and glpD during growth on glycerol revealed by quantitative RT-PCR (Fig. 4) further supports the
8269
notion that the GlpK-GlpD branch is dominant under these conditions. Furthermore, a recent study showed that the DhaR transcriptional regulator specifically upregulates the genes encoding DhaKLM in the presence of dihydroxyacetone, but not glycerol (2). Under the conditions utilized in this study, quantitative RT-PCR of dhaM (Fig. 4) showed that the dhaKLM genes are only minimally expressed, leaving the alternative glycerol metabolic pathway dormant. Including the recently characterized DhaR regulatory interaction (2) in the integrated regulatory-metabolic model will readily correct this discrepancy. In summary, this high-throughput phenotyping screen provides a significantly enhanced view of the conditionally essential gene set required for growth under minimally supplemented growth conditions and additionally represents the most comprehensive assessment of the constraint-based metabolic model of E. coli conducted to date. Moreover, this study further highlights the utility of using genome scale models as a context for content in interpreting and analyzing complex highthroughput data sets. This powerful synergistic approach of not only using models as data analysis tools, but also using highthroughput data as feedback for model improvement, is becoming a paradigm that will continue to drive systems biology research forward. ACKNOWLEDGMENTS We thank Adam Feist for his critical reading of the manuscript; Trina Patel, Vasiliy Portnoy, and Eric Knight for technical assistance; and Christian Barrett and other members of the Palsson laboratory for insightful discussions and suggestions. We gratefully acknowledge the support of the NIH Protein Structure Initiative, grant numbers P50 GM62411 and U54 GM074898, and also grant no. NIH R01 GM5708. Bernhard Palsson has a financial interest in Genomatica, Inc. Although the NIH R01 GM5708 grant has been identified for conflict of interest management based on the overall scope of the project and its potential to benefit Genomatica, Inc., the research findings included in this publication do not necessarily directly relate to the interests of Genomatica, Inc. REFERENCES 1. Baba, T., T. Ara, M. Hasegawa, Y. Takai, Y. Okumura, M. Baba, K. A. Datsenko, M. Tomita, B. L. Wanner, and H. Mori. 2006. Construction of Escherichia coli K-12 in-frame, single-gene knockout mutants: the Keio collection. Mol. Syst. Biol. [Online.] doi:10.1038/msb4100050. 2. Bachler, C., P. Schneider, P. Bahler, A. Lustig, and B. Erni. 2005. Escherichia coli dihydroxyacetone kinase controls gene expression by binding to transcription factor DhaR. EMBO J. 24:283–293. 3. Boutros, M., A. A. Kiger, S. Armknecht, K. Kerr, M. Hild, B. Koch, S. A. Haas, R. Paro, N. Perrimon, and the Heidelberg Fly Array Consortium. 2004. Genome-wide RNAi analysis of growth and viability in Drosophila cells. Science 303:832–835. 4. Cayley, S., M. T. Record, Jr., and B. A. Lewis. 1989. Accumulation of 3-(N-morpholino)propanesulfonate by osmotically stressed Escherichia coli K-12. J. Bacteriol. 171:3597–3602. 5. Chen, K., and L. Pachter. 2005. Bioinformatics for whole-genome shotgun sequencing of microbial communities. PLOS Comput. Biol. 1:106–112. 6. Covert, M. W., E. M. Knight, J. L. Reed, M. J. Herrgard, and B. O. Palsson. 2004. Integrating high-throughput and computational data elucidates bacterial networks. Nature 429:92–96. 7. Covert, M. W., and B. O. Palsson. 2002. Transcriptional regulation in constraints-based metabolic models of Escherichia coli. J. Biol. Chem. 277: 28058–28064. 8. Covert, M. W., C. H. Schilling, and B. Palsson. 2001. Regulation of gene expression in flux balance models of metabolism. J. Theor. Biol. 213:73–88. 9. Datsenko, K. A., and B. L. Wanner. 2000. One-step inactivation of chromosomal genes in Escherichia coli K-12 using PCR products. Proc. Natl. Acad. Sci. USA 97:6640–6645. 10. Earhardt, C. F. 1996. Uptake and metabolism of iron and molybdenum, p. 1075–1090. In F. C. Neidhardt (ed.), Escherichia coli and Salmonella: cellular and molecular biology, vol. 1. ASM Press, Washington, D. C.
8270
JOYCE ET AL.
11. Edwards, J. S., R. U. Ibarra, and B. O. Palsson. 2001. In silico predictions of Escherichia coli metabolic capabilities are consistent with experimental data. Nat. Biotechnol. 19:125–130. 12. Fraenkel, D. G. 1996. Glycolysis, p. 189–198. In F. C. Neidhardt (ed.), Escherichia coli and Salmonella, vol. 1. ASM Press, Washington, D.C. 13. Fu, D., A. Libson, L. J. Miercke, C. Weitzman, P. Nollert, J. Krucinski, and R. M. Stroud. 2000. Structure of a glycerol-conducting channel and the basis for its selectivity. Science 290:481–486. 14. Gay, N. J. 1984. Construction and characterization of an Escherichia coli strain with a uncI mutation. J. Bacteriol. 158:820–825. 15. Gennis, R. B., and V. Stewart. 1996. Respiration, p. 217–261. In F. C. Neidhardt (ed.), Escherichia coli and Salmonella, vol. 1. ASM Press, Washington, D.C. 16. Gerdes, S. Y., M. D. Scholle, J. W. Campbell, G. Balazsi, E. Ravasz, M. D. Daugherty, A. L. Somera, N. C. Kyrpides, I. Anderson, M. S. Gelfand, A. Bhattacharya, V. Kapatral, M. D’Souza, M. V. Baev, Y. Grechkin, F. Mseeh, M. Y. Fonstein, R. Overbeek, A. L. Barabasi, Z. N. Oltvai, and A. L. Osterman. 2003. Experimental determination and system level analysis of essential genes in Escherichia coli MG1655. J. Bacteriol. 185:5673–5684. 17. Giaever, G., A. M. Chu, L. Ni, C. Connelly, L. Riles, S. Veronneau, S. Dow, A. Lucau-Danila, K. Anderson, B. Andre, A. P. Arkin, A. Astromoff, M. El-Bakkoury, R. Bangham, R. Benito, S. Brachat, S. Campanaro, M. Curtiss, K. Davis, A. Deutschbauer, K. D. Entian, P. Flaherty, F. Foury, D. J. Garfinkel, M. Gerstein, D. Gotte, U. Guldener, J. H. Hegemann, S. Hempel, Z. Herman, D. F. Jaramillo, D. E. Kelly, S. L. Kelly, P. Kotter, D. LaBonte, D. C. Lamb, N. Lan, H. Liang, H. Liao, L. Liu, C. Luo, M. Lussier, R. Mao, P. Menard, S. L. Ooi, J. L. Revuelta, C. J. Roberts, M. Rose, P. RossMacdonald, B. Scherens, G. Schimmack, B. Shafer, D. D. Shoemaker, S. Sookhai-Mahadeo, R. K. Storms, J. N. Strathern, G. Valle, M. Voet, G. Volckaert, C. Y. Wang, T. R. Ward, J. Wilhelmy, E. A. Winzeler, Y. Yang, G. Yen, E. Youngman, K. Yu, H. Bussey, J. D. Boeke, M. Snyder, P. Philippsen, R. W. Davis, and M. Johnston. 2002. Functional profiling of the Saccharomyces cerevisiae genome. Nature 418:387–391. 18. Glasner, J. D., P. Liss, G. Plunkett III, A. Darling, T. Prasad, M. Rusch, A. Byrnes, M. Gilson, B. Biehl, F. R. Blattner, and N. T. Perna. 2003. ASAP, a systematic annotation package for community analysis of genomes. Nucleic Acids Res. 31:147–151. 19. Glass, J. I., N. Assad-Garcia, N. Alperovich, S. Yooseph, M. R. Lewis, M. Maruf, C. A. Hutchison III, H. O. Smith, and J. C. Venter. 2006. Essential genes of a minimal bacterium. Proc. Natl. Acad. Sci. USA 103:425–430. 20. Hare, R. S., S. S. Walker, T. E. Dorman, J. R. Greene, L. M. Guzman, T. J. Kenney, M. C. Sulavik, K. Baradaran, C. Houseweart, H. Yu, Z. Foldes, A. Motzer, M. Walbridge, G. H. Shimer, Jr., and K. J. Shaw. 2001. Genetic footprinting in bacteria. J. Bacteriol. 183:1694–1706. 21. Holtman, C. K., A. C. Pawlyk, N. Meadow, S. Roseman, and D. W. Pettigrew. 2001. IIA(Glc) allosteric control of Escherichia coli glycerol kinase: binding site cooperative transitions and cation-promoted association by Zinc(II). Biochemistry 40:14302–14308. 22. Holtman, C. K., A. C. Pawlyk, N. D. Meadow, and D. W. Pettigrew. 2001. Reverse genetics of Escherichia coli glycerol kinase allosteric regulation and glucose control of glycerol utilization in vivo. J. Bacteriol. 183:3336– 3344. 23. Itikawa, H., S. Baumberg, and H. J. Vogel. 1968. Enzymic basis for a genetic suppression: accumulation and deacylation of N-acetylglutamic gammasemialdehyde in enterobacterial mutants. Biochim. Biophys. Acta 159:547– 550. 24. Ito, M., T. Baba, and H. Mori. 2005. Functional analysis of 1440 Escherichia coli genes using the combination of knock-out library and phenotype microarrays. Metab. Eng. 7:318–327. 25. Jacobs, M. A., A. Alwood, I. Thaipisuttikul, D. Spencer, E. Haugen, S. Ernst, O. Will, R. Kaul, C. Raymond, R. Levy, L. Chun-Rong, D. Guenthner, D. Bovee, M. V. Olson, and C. Manoil. 2003. Comprehensive transposon mutant library of Pseudomonas aeruginosa. Proc. Natl. Acad. Sci. USA 100:14339– 14344. 26. Khademi, S., J. O’Connell III, J. Remis, Y. Robles-Colmenares, L. J. Miercke, and R. M. Stroud. 2004. Mechanism of ammonia transport by Amt/MEP/Rh: structure of AmtB at 1.35 Å. Science 305:1587–1594. 27. Kobayashi, K., S. D. Ehrlich, A. Albertini, G. Amati, K. K. Andersen, M. Arnaud, K. Asai, S. Ashikaga, S. Aymerich, P. Bessieres, F. Boland, S. C. Brignell, S. Bron, K. Bunai, J. Chapuis, L. C. Christiansen, A. Danchin, M. Debarbouille, E. Dervyn, E. Deuerling, K. Devine, S. K. Devine, O. Dreesen, J. Errington, S. Fillinger, S. J. Foster, Y. Fujita, A. Galizzi, R. Gardan, C. Eschevins, T. Fukushima, K. Haga, C. R. Harwood, M. Hecker, D. Hosoya, M. F. Hullo, H. Kakeshita, D. Karamata, Y. Kasahara, F. Kawamura, K. Koga, P. Koski, R. Kuwana, D. Imamura, M. Ishimaru, S. Ishikawa, I. Ishio, D. Le Coq, A. Masson, C. Mauel, R. Meima, R. P. Mellado, A. Moir, S. Moriya, E. Nagakawa, H. Nanamiya, S. Nakai, P. Nygaard, M. Ogura, T. Ohanan, M. O’Reilly, M. O’Rourke, Z. Pragai, H. M. Pooley, G. Rapoport, J. P. Rawlins, L. A. Rivas, C. Rivolta, A. Sadaie, Y. Sadaie, M. Sarvas, T.
J. BACTERIOL.
28. 29.
30.
31.
32.
33.
34.
35.
36.
37. 38. 39.
40.
41. 42.
43.
44.
45.
46.
47.
Sato, H. H. Saxild, E. Scanlan, W. Schumann, J. F. Seegers, J. Sekiguchi, A. Sekowska, S. J. Seror, M. Simon, P. Stragier, R. Studer, H. Takamatsu, T. Tanaka, M. Takeuchi, H. B. Thomaides, V. Vagner, J. M. van Dijl, K. Watabe, A. Wipat, H. Yamamoto, M. Yamamoto, Y. Yamamoto, K. Yamane, K. Yata, K. Yoshida, H. Yoshikawa, U. Zuber, and N. Ogasawara. 2003. Essential Bacillus subtilis genes. Proc. Natl. Acad. Sci. USA 100:4678– 4683. Koonin, E. V. 2003. Comparative genomics, minimal gene-sets and the last universal common ancestor. Nat. Rev. Microbiol. 1:127–136. Levy, S., G. Q. Zeng, and A. Danchin. 1990. Cyclic AMP synthesis in Escherichia coli strains bearing known deletions in the pts phosphotransferase operon. Gene 86:27–33. Maeda, I., Y. Kohara, M. Yamamoto, and A. Sugimoto. 2001. Large-scale analysis of gene function in Caenorhabditis elegans by high-throughput RNAi. Curr. Biol. 11:171–176. Mengin-Lecreulx, D., and J. van Heijenoort. 1996. Characterization of the essential gene glmM encoding phosphoglucosamine mutase in Escherichia coli. J. Biol. Chem. 271:32–39. Merino, E., and C. Yanofsky. 2005. Transcription attenuation: a highly conserved regulatory strategy used by bacteria. Trends Genet. 21:260– 264. Neuwald, A. F., B. R. Krishnan, I. Brikun, S. Kulakauskas, K. Suziedelis, T. Tomcsanyi, T. S. Leyh, and D. E. Berg. 1992. cysQ, a gene needed for cysteine synthesis in Escherichia coli K-12 only during aerobic growth. J. Bacteriol. 174:415–425. Overbeek, R., T. Begley, R. M. Butler, J. V. Choudhuri, H. Y. Chuang, M. Cohoon, V. de Crecy-Lagard, N. Diaz, T. Disz, R. Edwards, M. Fonstein, E. D. Frank, S. Gerdes, E. M. Glass, A. Goesmann, A. Hanson, D. IwataReuyl, R. Jensen, N. Jamshidi, L. Krause, M. Kubal, N. Larsen, B. Linke, A. C. McHardy, F. Meyer, H. Neuweger, G. Olsen, R. Olson, A. Osterman, V. Portnoy, G. D. Pusch, D. A. Rodionov, C. Ruckert, J. Steiner, R. Stevens, I. Thiele, O. Vassieva, Y. Ye, O. Zagnitko, and V. Vonstein. 2005. The subsystems approach to genome annotation and its use in the project to annotate 1000 genomes. Nucleic Acids Res. 33:5691–5702. Postma, P. W., J. W. Lengeler, and G. R. Jacobson. 1996. Phosphoenolpyruvate:carbohydrate phosphotransferase systems, p. 1149–1174. In F. C. Neidhardt (ed.), Escherichia coli and Salmonella, vol. 1. ASM Press, Washington, D.C. Price, N. D., J. L. Reed, and B. O. Palsson. 2004. Genome-scale models of microbial cells: evaluating the consequences of constraints. Nat. Rev. Microbiol. 2:886–897. Raetz, C. R., and C. Whitfield. 2002. Lipopolysaccharide endotoxins. Annu. Rev. Biochem. 71:635–700. Reed, J. L., I. Famili, I. Thiele, and B. O. Palsson. 2006. Towards multidimensional genome annotation. Nat. Rev. Genet. 7:130–141. Reed, J. L., T. D. Vo, C. H. Schilling, and B. O. Palsson. 2003. An expanded genome-scale model of Escherichia coli K-12 (iJR904 GSM/GPR). Genome Biol. 4:R54.1–R54.12. Riley, M., T. Abe, M. B. Arnaud, M. K. Berlyn, F. R. Blattner, R. R. Chaudhuri, J. D. Glasner, T. Horiuchi, I. M. Keseler, T. Kosuge, H. Mori, N. T. Perna, G. Plunkett III, K. E. Rudd, M. H. Serres, G. H. Thomas, N. R. Thomson, D. Wishart, and B. L. Wanner. 2006. Escherichia coli K-12: a cooperatively developed annotation snapshot—2005. Nucleic Acids Res. 34: 1–9. Rodriguez-Brito, B., F. Rohwer, and R. Edwards. 2006. An application of statistics to comparative metagenomics. BMC Bioinform. 7:162. Sassetti, C. M., D. H. Boyd, and E. J. Rubin. 2001. Comprehensive identification of conditionally essential genes in mycobacteria. Proc. Natl. Acad. Sci. USA 98:12712–12717. Segre, D., D. Vitkup, and G. M. Church. 2002. Analysis of optimality in natural and perturbed metabolic networks. Proc. Natl. Acad. Sci. USA 99: 15112–15117. Shlomi, T., O. Berkman, and E. Ruppin. 2005. Regulatory on/off minimization of metabolic flux changes after genetic perturbations. Proc. Natl. Acad. Sci. USA 102:7695–7700. Song, J. H., K. S. Ko, J. Y. Lee, J. Y. Baek, W. S. Oh, H. S. Yoon, J. Y. Jeong, and J. Chun. 2005. Identification of essential genes in Streptococcus pneumoniae by allelic replacement mutagenesis. Mol. Cell. 19:365–374. Soupene, E., L. He, D. Yan, and S. Kustu. 1998. Ammonia acquisition in enteric bacteria: physiological role of the ammonium/methylammonium transport B (AmtB) protein. Proc. Natl. Acad. Sci. USA 95:7030–7034. Strous, M., E. Pelletier, S. Mangenot, T. Rattei, A. Lehner, M. W. Taylor, M. Horn, H. Daims, D. Bartol-Mavel, P. Wincker, V. Barbe, N. Fonknechten, D. Vallenet, B. Segurens, C. Schenowitz-Truong, C. Medigue, A. Collingro, B. Snel, B. E. Dutilh, H. J. Op den Camp, C. van der Drift, I. Cirpus, K. T. van de Pas-Schoonen, H. R. Harhangi, L. van Niftrik, M. Schmid, J. Keltjens, J. van de Vossenberg, B. Kartal, H. Meier, D. Frishman, M. A. Huynen, H. W.
VOL. 188, 2006
COMPUTATIONAL ANALYSIS OF ESSENTIAL GENES IN E. COLI
Mewes, J. Weissenbach, M. S. Jetten, M. Wagner, and D. Le Paslier. 2006. Deciphering the evolution and metabolism of an anammox bacterium from a community genome. Nature 440:790–794. 48. Thanassi, J. A., S. L. Hartman-Neumann, T. J. Dougherty, B. A. Dougherty, and M. J. Pucci. 2002. Identification of 113 conserved essential genes using a high-throughput gene disruption system in Streptococcus pneumoniae. Nucleic Acids Res. 30:3152–3162. 49. Tringe, S. G., and E. M. Rubin. 2005. Metagenomics: DNA sequencing of environmental samples. Nat. Rev. Genet. 6:805–814.
8271
50. Wessler, S. R., and J. M. Calvo. 1981. Control of leu operon expression in Escherichia coli by a transcription attenuation mechanism. J. Mol. Biol. 149:579–597. 51. Ye, Y., A. Osterman, R. Overbeek, and A. Godzik. 2005. Automatic detection of subsystem/pathway variants in genome analysis. Bioinformatics 21(Suppl. 1):i478–486. 52. Zhou, L., X. H. Lei, B. R. Bochner, and B. L. Wanner. 2003. Phenotype microarray analysis of Escherichia coli K-12 mutants with deletions of all two-component systems. J. Bacteriol. 185:4956–4972.