Optimizing Nanoemulsions using High Shear Fluid Processing: Experimental and Modeling Methods Thomai Panagiotou, Microfluidics, IDEX Corporation, 90 Glacier Dr., Westwood, MA 02090, USA,
[email protected] ; Yang Su Microfluidics, IDEX Corporation, 90 Glacier Dr., Westwood, MA 02090, USA,
[email protected] ; Robert Fisher, Massachusetts Institute of Technology, Chemical Engineering Department, Bldg 66, Rm 305 77 Massachusetts Avenue, Cambridge, MA 02139-4307, USA,
[email protected]
used to characterize the flow inside the micro channels of the processing hardware and determine the spatial distributions of fluid velocity, pressure gradient, energy dissipation, shear stresses, etc. Based on these results, analytical methods were used to calculate the maximum droplet size of the emulsion.
INTRODUCTION
Formulations with precise particle size in the nano- and micron- range have, and will continue to have, a major impact on the pharmaceutical industry. In addition to the size, the particle structure and shape, and the drug polymorph are important properties that permit unique formulation control for optimum delivery methodologies.
The maximum droplet size in emulsions is critical because it affects the stability of the emulsion and its ability to be filter sterilized, which is critical for emulsions used for intravenous, ocular, etc. drug delivery.
Presented here are “to down” and “bottom up” processes used to produce tailored nano- or micron- size particles in a scalable fashion, and methods appropriate for pharmaceutical manufacturing, using high pressure, high shear fluid processing technologies developed by Microfluidics International[1]. In an effort to optimize such processes, modeling was used to predict droplet sizes of emulsions under different configurations of the hardware used and process pressure levels. Examples of the materials produced include:
EXPERIMENTAL Materials
Several emulsion formulations were used in this study, pertinent to the pharmaceutical industry. Presented here is an oil-in-water (o/w) emulsion, in which oil droplets are finely dispersed in water matrix and are stabilized by a surfactant. The oil was castor oil at concentration of 6 wt%, and the surfactant was Polysorbate 80 at concentration of 0.9 wt%; both compounds are very commonly used in pharmaceutical emulsions.
- Stable nanoemulsion formulations that use the discrete (droplet phase) to carry active ingredients; such formulations often used to deliver hydrophobic compounds by dissolving those in oils and subsequent finely dispersing the solution in an aqueous phase. -Stable nano- and micron - dispersions of crystalline drugs with optimum polymorphs and particle sizes, used to enhance the drug solubility profiles -Drugs encapsulated in polymers to form nanoparticles used for targeted delivery
Methods
The oil and water phases were prepared separately and then were mixed using a rotor-stator mixer (UltraTurex). The coarse emulsion created this way was then processed through a MicrofluidizerTM High Shear Fluid Processor, (Model 110P , Microfluidics, Westwood, MA, USA). The principal of operation of such a processor was described elsewhere[1]. Three operation parameters of the processors were varied during the experiments: (a) the process pressure which is defines the overall amount of energy used in processing the material, (b) the number of passes through the processor, and (c) the configuration of the processing module, that includes the size and shape of microchannels; this influences the mode of energy dissipation, such as turbulence, shear, impact, etc. The dimensions of the microchannels’ depth and width are in the range of 75-200 microns.
In the last few years CFD analysis is used to characterize the flow field in homogenizer equipment[2], which is also used for production of fine particle formulations. Major differences exist in between homogenizers and Microfluidics technologies including the flow regime and characteristic times the technologies operate, therefore the literature results are not directly transferable to Microfluidics’ technologies. Also presented here are analytical methods that allow us to decouple the mechanisms responsible for formation of nanoparticles in Microfluidics’ technologies and improve the design of processes and hardware. CFD analysis was
The particle size distributions of the emulsions were measured using a Horiba 950 static light scattering instrument and verified using a Marvern Zetasizer dynamic
-1-
light scattering instrument. The particle sizes of the emulsions were measured before and after processing with the Microfluidizer processor. ANALYTICAL
CFD analysis was used to characterize the flow inside the microchannels of the processing module. The software package used was ANSYS CFX. The initial process pressure was used as a boundary condition. The flowrate through the microchannels was an output of the model. The flowrate was found to be fairly sensitive to the geometry and the various assumptions, such as turbulent model used. Various turbulence models were used based on the literature; the final selection was based on the calculated flowrate oil the model, which was compared to the experimental results. Results from the CFD analysis included pressures, temperatures, energy dissipation rates, turbulent intensity, shear levels, etc. along the processing module.
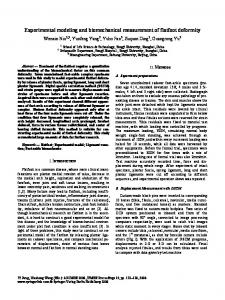
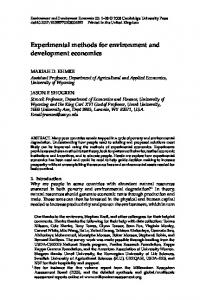
Figure 1. Particle size distribution after processing 1 and 2 passes at 2140 bar (30000 psi)
The maximum droplet size of the particle size distribution was estimated analytically based on droplet fragmentation. It was assumed here that coalescence, which is another important mechanism that takes place simultaneously with droplet fragmentation, is negligible due to the low oil content of the formulation. For turbulent flows, the turbulent fragmentation can be distinguished with two different regimes by comparing the droplet size to the size of smallest eddies (Kolmogorov length scale) as described by Kolmogorov [3] and Hinze [3]. The maximum drop diameter, dmax, can be derived by balancing the deformation force with the stabilizing capillary pressure (Laplace pressure) and utilization of the critical Webber number, Wecrit, as shown in equation (1) [3]:
We crit c 2.0 3/ 5
d max
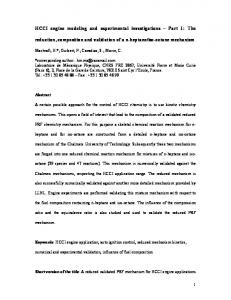
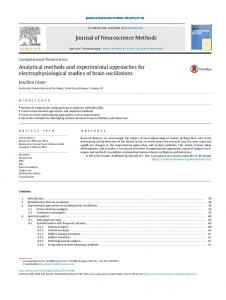
Figure 2. Calculated and measured largest particle diameters as a function of turbulent energy dissipation rates for various hardware configurations and process pressures.
3 / 5
2 / 5
CONCLUSIONS
The maximum droplet diameter of an o/w emulsion as a function of turbulent energy dissipation rate was calculated. In these calculations it was assumed that droplet coalescence was negligible. Overall, the calculated values agreed well with the experimental values. In future work, in an effort to increase the accuracy and validity of the model, the model will be expanded to include coalescence. Also, higher oil content emulsions will be considered.
(1)
where c is the density of the continuous phase, is the interfacial tension, and is the turbulent energy dissipation rate. The value of the critical Webber number was assumed to be1.17, valid for coaxial cylinder system [3]. RESULTS
A typical diameter distribution of the particles by volume is depicted in Figure 1. The median particle size after the first pass was 0.141 microns, while after the second pass is 0.130 microns. The 95% mark of the distribution, d95, corresponds to large particles present. After the first pass the d95 is 0.286 microns and after the second pass this value is 0.226 microns.
REFERENCES
1.Panagiotou, T. and Fisher, R. Improving Product Quality with Entrapped Stable Emulsions: From Theory to Industrial Applications, Challenges, 3, 84-113 (2012). 2.Hakansson , A. et al. High resolution experimental measurement of turbulent flow field in a high pressure homogenizer model and its implications on turbulent drop fragmentation, Chem. Eng. Sci. 66 1790–1801(2011).
Figure 2 shows the calculated dmax values from equation (1) as a function of the turbulent energy dissipation rate, for five different hardware configurations and pressures. There is good agreement between the calculated and experimental values in most cases.
3.Vankova,N. et al. Emulsification in turbulent flow. 1Mean and maximum drop diameters in inertial and viscous regimes, J. Col. and Inter. Sci. 312, 363–380 (2007). -2-