Revista Brasileira de Recursos Hídricos Brazilian Journal of Water Resources Versão On-line ISSN 2318-0331
RBRH, Porto Alegre, v. 23, e19, 2018 Scientific/Technical Article
https://doi.org/10.1590/2318-0331.231820170125
Experimental and numerical investigation of flow patterns in shallow rectangular reservoirs with symmetrically positioned inlet and outlet channels Investigação experimental e numérica de padrões de escoamento em reservatórios retangulares rasos com canais de entrada e de saída simetricamente posicionados Daniel Augusto de Miranda1,2, Álefe Marques dos Reis3 and Márcia Maria Lara Pinto Coelho2 Instituto Federal de Educação, Ciência e Tecnologia de Minas Gerais, Santa Luzia, MG, Brasil 2 Universidade Federal de Minas Gerais, Belo Horizonte, MG, Brasil 3 Centro Universitário Metodista Izabela Hendrix, Belo Horizonte, MG, Brasil
1
E-mails:
[email protected] (DAM),
[email protected] (AMR),
[email protected] (MMLPC) Received: August 09, 2017 - Revised: February 14, 2018 - Accepted: April 05, 2018
ABSTRACT Shallow flows correspond to turbulent flows whose horizontal dimensions are considerably larger than the vertical one. In Hydraulic Engineering, they refer, e.g., to stormwater basins, stabilization ponds for wastewater treatment and aquaculture tanks. Since they involve low flow velocities, a continuous settling process often affects such shallow reservoirs. Therefore, it is important to expand the knowledge about the influence of its geometry on the hydrodynamic behavior and the sedimentation tendency. This paper aims to analyze flow patterns in a rectangular reservoir with symmetrically positioned upstream and downstream channels, taking into account three different flow rates under steady flow regime (0.50, 1.25 and 3.40 L/s). Experimental tests were performed in a laboratory prototype, consisted of a 3.0 m long and 2.0 m wide reservoir, with a maximum depth of 0.30 m. Also, it was applied the WOLF 2D software for numerical modeling of all variants. Experimentally, a symmetrical hydrodynamic behavior was observed only for the lowest flow rate, while the flow pattern was asymmetrical for the other cases. On the other hand, the numerical model indicated hydrodynamic symmetry for all scenarios. Keywords: Shallow flow; Hydrodynamic behavior; Numerical modeling; Physical modeling; Shallow reservoirs.
RESUMO Escoamentos rasos correspondem a fluxos turbulentos cujas dimensões horizontais são consideravelmente maiores que a dimensão vertical. Em Engenharia Hidráulica, referem-se, por exemplo, a bacias de detenção, lagoas de estabilização para tratamento de efluentes e tanques de aquicultura. Por envolverem baixas velocidades de escoamento, tais tipos de reservatórios rasos são frequentemente afetados por contínuo processo de sedimentação. Destaca-se, com isso, a importância em se ampliar o conhecimento acerca da influência de sua geometria sobre o comportamento hidrodinâmico e sobre a tendência de decantação de sólidos. O objetivo desse artigo consiste em analisar os padrões de escoamento para um reservatório retangular com canais de montante e de jusante simetricamente posicionados, levando-se em conta três diferentes vazões em regime permanente (0,50, 1,25 e 3,40 L/s). Para tanto, realizaram-se experimentos em um protótipo de laboratório, consistindo em um tanque com 3,0 m de comprimento, 2,0 m de largura e profundidade máxima de 0,30 m. Utilizou-se também o programa computacional WOLF 2D para modelagem numérica de todas as variantes. Do ponto de vista experimental, notou-se um comportamento hidrodinâmico simétrico unicamente para a menor vazão, ao passo que o padrão de escoamento foi assimétrico para as demais. Por outro lado, o modelo numérico indicou simetria hidrodinâmica para todos os cenários. Palavras-chave: Escoamento pouco profundo; Comportamento hidrodinâmico; Modelagem numérica; Modelagem física; Reservatórios rasos.
This is an Open Access article distributed under the terms of the Creative Commons Attribution License, which permits unrestricted use, distribution, and reproduction in any medium, provided the original work is properly cited.
1/12
Experimental and numerical investigation of flow patterns in shallow rectangular reservoirs with symmetrically positioned inlet and outlet channels
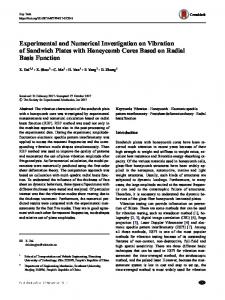
INTRODUCTION Shallow flows are defined as layered turbulent flows bounded by a bottom surface and by another surface in contact with the atmosphere (free surface), characterized by horizontal hydraulic dimensions significantly greater than the vertical one (JIRKA; UIJTTEWAAL, 2004). The study of shallow flows involves a range of applications in Hydraulic Engineering domain and their respective areas of interest. Among them, it can be highlighted the study of hydrodynamics and morphodynamics of shallow reservoirs, such as: (1) detention basins, often employed in urban drainage projects for flood control (PERSSON; WITTGREN, 2003; JANSONS; LAW, 2007); (2) stabilization ponds of sewage systems, whose sedimentation efficiency must be high so that they have adequate performance (OLUKANNI; DUCOSTE, 2011; CAMNASIO, 2012; LI et al., 2013); (3) aquaculture tanks, which demand a correct understanding of their hydraulic behavior, since they are associated with the development of fish, algae and crustacean cultures (MASALÓ, 2008); as well as many other water storage systems susceptible to sedimentation. All these examples of shallow reservoirs are inevitably subject to some degree of sedimentation, since they alter the morphodynamic balance of the original watercourse, modifying the hydraulic characteristics of the flow and, consequently, its sediment transport capacity (KANTOUSH, 2008; CAMNASIO et al., 2013). The definition of the design criteria for the conception of shallow reservoirs depends on their objectives. When their use is related to irrigation, flood control or hydroelectric generation, the sedimentation process should be minimized. On the other hand, if they are used as hydraulic sedimentation structures, the decantation of solids must be clearly maximized (DUFRESNE et al., 2010b). As highlighted by Dufresne et al. (2010b), the prediction of sediment deposition in such reservoirs is not yet fully understood, given the complex influence of reservoir geometry, hydraulic conditions, sediment characteristics and solid inflows (sediment supply). Thus, it is a challenge for Hydraulic Engineering to understand objectively how the flow developed in such reservoirs interferes with sedimentation and, consequently, in the operation of these systems. In recent studies, laboratory experiments and numerical simulations were systematically performed (JANSONS; LAW, 2007; KANTOUSH, 2008; DEWALS et al., 2008; DUFRESNE et al., 2010a,b; CAMNASIO; ORSI; SCHLEISS, 2011; DUFRESNE et al., 2011; CAMNASIO, 2012; CAMNASIO et al., 2013; PELTIER et al., 2015, 2016; MIRANDA et al., 2017). Basically, these studies aimed to improve the understanding of: i) hydraulic behavior and flow patterns, and ii) sedimentation trends and intervening factors in the sediment retention capacity of those shallow rectangular reservoirs. Visual investigation tests were carried out in a 10.40 m long and 0.985 wide glass flume, using dye injection indicated the existence of four flow patterns (as well as an unstable and transitional one), as shown in Figure 1 (DUFRESNE et al., 2010a). For this purpose, a 2.00 m long and 0.285 m wide contraction was installed at the entrance of this channel (positioned inside it), simulating an inlet channel. In addition, another 1.00 m long and 0.285 m wide contraction was installed on the downstream side to characterize the outlet channel. These contractions were 2/12
Figure 1. Schematic view of four observed flow patterns: (a) A3, (b) A2, (c) A1 and (d) S0. Source: Dufresne et al. (2010a).
movable along the longitudinal direction, thus allowing the length adjustment of the central part, which represented the reservoir. Basin lengths of 1.80, 2.00, 2.20 and 7.00 m were evaluated. As outlined in Figure 1, the flow patterns were identified as a function of their symmetry versus hydrodynamic asymmetry, the number of recirculation zones and the location of reattachment points. According to the experimental observations of Dufresne et al. (2010a,b), flow pattern S0 (Figure 1d) was observed for comparatively short reservoirs. A straight jet from upstream to downstream, with two symmetrical recirculation zones along either jet sides, characterizes this flow pattern. In the case of that experiment, such flow pattern occurred when the length of the channel (basin) was adjusted to 1.80 m (parameter L), taking into account that its width remained fixed in all evaluated scenarios (0.985 m). When the length of the reservoir was extended, an asymmetrical flow field was observed, resulting in flow pattern A1 (Figure 1c). For the tests performed, this flow pattern was observed when the channel length was changed to 2.20 m. For intermediate reservoir lengths between the two above, a transition flow pattern could be seen (A1 / S0), oscillating between the symmetrical flow pattern (S0) and the asymmetrical flow pattern (A1) (DUFRESNE et al., 2010b; CAMNASIO; ORSI; SCHLEISS, 2011). In the case of Dufresne et al. (2010b), the A1/S0 pattern was verified when the RBRH, Porto Alegre, v. 23, e19, 2018
Miranda et al.
channel length was set to 2.00 m. However, for longer reservoirs, the experiments showed an asymmetrical flow pattern with two reattachment points (A2, Figure 1b). This occurred in the Belgian experimental studies when the canal length reached 7.00 m. Finally, for even longer reservoirs, an additional recirculation zone developed in the downstream part of the reservoir (flow pattern A3, Figure 1a). This latter flow pattern, however, was not evaluated experimentally in that study, although it has been cataloged. This paper aims to characterize flow patterns using physical and numerical experiments to analyze the effect of different boundary conditions in a particular flat and shallow rectangular reservoir with symmetrically positioned upstream and downstream channels.
MATERIAL AND METHODS Physical modeling Laboratory tests have been carried out in the Hydraulic Research Center of the Federal University of Minas Gerais (UFMG), Brazil. A 3.0 m long, 2.0 m wide and 0.30 m deep flat rectangular reservoir (Figure 2) was constructed of sheet metal covered by epoxy coating, in order to protect it against oxidation. The upstream and downstream channels were also constructed of sheet metal. Both channels are 1.0 m long, 0.125 m wide and 0.30 m deep, corresponding to the same depth of the reservoir. The tests contemplated three different hydraulic conditions, under steady flow regime (Table 1). For tests 1, 2 and 3, the aforementioned two channels were positioned aligned to the longitudinal basin axis, as seen in Figure 2 (downstream channel). In order to control the water depth within the reservoir, a sill was installed at the end of the outlet channel, screwed to the structure, with a thickness of 2 mm and height adjusted according to the required water depth. Two pumping systems were assembled: one to discharge the inflow from an auxiliary reservoir and another to pump the outflow to the same reservoir. The first of these pumping systems corresponded to a Schneider three-phase centrifugal motor pump, BC-92 model, 1.0 HP and maximum rotational velocity of 3500 rpm. The adjustment of the reference flow rates in each test was made possible by the installation of a Weg frequency inverter, CFW 09 model, which allowed to regulate the rotational velocity of the motor pump assembly. For this purpose, the pump rotation corresponding to each desired flow rate was calibrated. Flow rates were measured at the outlet section of the downstream channel and obtained by volumetric measurement, using a bucket and a stopwatch. In order to ensure the correct establishment of the pump rotational velocity to liquid flow rate ratio, the discharge was only checked after reaching a permanent flow condition, i.e. when there was no further variation of the water level in the basin. It was verified by means of successive measurements in millimeter rulers installed in different places inside the reservoir. The time demanded to reach this stationary condition was usually over 5 minutes. The rotational velocity of the pumping system corresponding to each required flow was only defined after repeated measurements. During the experiments, the outflow at the outlet section of the downstream channel was returned to RBRH, Porto Alegre, v. 23, e19, 2018
Figure 2. Rectangular reservoir for experiments. Table 1. Hydraulic parameters related to the tests. Test number Flow rate Q (L/s) Water depth h (m) 1 2 3
0.50 1.25 3.40
0.05 0.10 0.20
an auxiliary reservoir using the aforementioned second pumping system, which corresponded to a Weg motor pump, with 5.0 HP and rotational velocity of 3485 rpm. It is important to mention that a few pipes of 20.0 mm diameter PVC were juxtaposed placed within the upstream channel to uniformly distribute the flow at the entrance of the basin, thereby reducing turbulence that could be generated in that area of interest. All experiments were filmed (usually during 8 to 12 minutes) for subsequent capture and processing of photos for the determination of surface velocities based on LSPIV (Large Scale Particle Image Velocimetry) technique (WEITBRECHT; KÜHN; JIRKA, 2002; KANTOUSH, 2008). For this purpose, a Logitech webcam C920 model was coupled to a 4.0 m high metallic stand, positioned over the test basin to record high-resolution (HD) videos with up to 1080 pixels. This installation height of the camera was properly calculated to enable the capture of representative images of the entire rectangular area of the reservoir. The filming used a portable computer and the AMCap software, version 9.22. To determine the superficial flow velocity by means of the LSPIV technique, tracer particles were released continuously, one particle injected every second for about 3 to 4 minutes, and uniformly within the middle portion of the upstream channel. These tracers are essential for the calculation of velocity vectors by the algorithm compatible to the measurement technique adopted. Thus, PET plastic bottle caps (black color, to contrast with the blue bottom of the reservoir) were used, due to their ease of handling and the fact that they floated on liquid surface, as recommended by Meselhe, Peeva and Muste (2004). 3/12
Experimental and numerical investigation of flow patterns in shallow rectangular reservoirs with symmetrically positioned inlet and outlet channels
Moreover, the bottom of the basin was entirely squared using a silver tape, composing a series of elements of 25.0 cm side (Figure 3). The purpose was to facilitate the identification of the so-called interrogation and research areas demanded by the software adopted. The FUDAA-LSPIV software (JODEAU; HAUET; LE COZ, 2013) was used to transform the recorded images into surface velocity vectors. For that, a fixed time step Δt was defined to the obtaining of subsequent images, according to the flow velocity. As recommended by other studies and by the FUDAA-LSPIV manual itself, the subsequent time step Δt adopted was between 1 and 2 seconds. It was selected a shorter time step (1 second) for the higher flow rate (Q = 3.40 L/s), due to the faster displacement of the tracers. On the other hand, the lower flow velocity for the other flow rates (Q = 0.50 L/s and 1.25 L/s) favored the acquisition of images at a larger time step (every 2 seconds, for example), which reduced the software processing time.
Numerical modeling For the numerical simulations, the finite volume academic code WOLF 2D, developed by the University of Liège (ULg, Belgium), was used (DEWALS et al., 2008; DUFRESNE et al., 2011). This computational program is based on the use of two‑dimensional depth-averaged equations of volume and momentum conservation. The concerning equations are known as shallow water equations (SWE). The WOLF 2D software is also coupled to the k-ε type turbulence model so that the three-dimensional turbulent processes are partly taken into account. (DEWALS et al., 2008; ERPICUM et al., 2009; DUFRESNE et al., 2011). To construct the characteristic mesh of the UFMG’s experimental facility, 327 elements were established in the abscissa plane (Δx), parallel to the flow, and 166 elements in the ordinate plane (Δy), perpendicular to the flow. The mesh resolution was adjusted to 0.0125 m. For each test, it was considered uniform
values of water level as initial simulation condition, equivalent to what was expected to be measured in the input section of the downstream channel. Regarding to boundary conditions, it was prescribed specific discharge at the entrance of the basin (final section of the upstream channel) and the required depth in the initial section of the downstream channel. Also with regard to the upstream boundary condition, slightly disturbed distributions of the specific discharge at the inflow were considered, as recommended by Dewals et al. (2008, 2012). Otherwise, there is no possibility from the numerical point of view of obtaining an asymmetric result. On the other hand, the existence of this slightly disturbed upstream boundary condition does not prevent a simulation from converging to a symmetric result, since the calculation attenuates this dissymmetry. The time step Δt assigned in all simulations was 0.1 s. The simulations were interrupted as soon as the steady flow condition was reached. In this case, WOLF 2D has two tools indicative of this stationarity: the first refers to the possibility of tracking the numerical solution for the velocity in a given element of the mesh to the user’s choice. From the moment this graphically displayed value becomes constant or with slight variations, it is assumed that the solution is stable; the other tool consists of the algebraic difference of the values assigned to the velocities of each element between the last two simulated time steps. When the velocity variations begin to be relatively small, of the order of 10-5 m/s or even smaller, the error factor is considered as acceptable for the numerical model.
RESULTS AND DISCUSSION Physical modeling The flow regime in the final portion of the upstream channel was subcritical in all experiments, as well as in the reference studies cited above. It should be noted that such information validates the adoption of the boundary conditions in the numerical simulations.
Figure 3. Detail of the checkered bottom of the reservoir (25.0 cm side). 4/12
RBRH, Porto Alegre, v. 23, e19, 2018
Miranda et al.
Otherwise, if the flow were supercritical at the entrance of the reservoir, it would be necessary to take into account the water depth and the flow rate as upstream boundary conditions. Table 2 presents the parameters correlated to the determination of the Froude number (Fr), which resulted in values between 0.09 and 0.10. In order to determine the flow regime according to the flow path, the calculation of the Reynolds number (Re) for all experiments was demanded (Table 3). The calculation of the Reynolds number considered the hydraulic radius of the upstream channel cross section as the characteristic length. It is important to highlight that the obtained Reynolds numbers resulted in instabilities during the experiments, with the formation of complex flow patterns, which are indicative of the turbulent flows. Those instabilities and complex flow patterns for turbulent flows have already been observed by Jirka and Uijttewaal (2004) and Kolyshkin and Nazarovs (2005). In the sequence, the results obtained through the LSPIV technique (Figures 4 to 6) are presented. They refer to the mapping
of the mean surface velocity fields, for each flow rate, throughout the area of the rectangular reference reservoir. Figure 4 refers to the 0.50 L/s flow rate. The following aspects were observed from the interpretation of this figure and the visual perception during the experiment: • T he flow pattern in this case would correspond to the type S0 (DUFRESNE et al., 2010a,b; CAMNASIO; ORSI; SCHLEISS, 2011), characterized by the existence of a main jet aligned to the longitudinal basin axis and by the formation of two large vortices in opposite directions, a counterclockwise vortex to the left and a clockwise one to the right of the jet. The two vortices had similar dimensions; • T he maximum surface velocity identified in the reservoir was 0.05 m/s, observed only along the main jet and in the initial portion of the recirculation zone on the right side of the basin, close to the downstream sidewall; • T here was a clearly defined flow recirculation zone on the left side of the basin, relative to the right one, denoting apparent preference of the tracer in recirculating the basin on that side. However, the limitation of the LSPIV technique for vectorization of the velocity field near the sidewalls might have resulted in a partial characterization of the vortex formed to the right of the main jet.
Table 2. Determination of the Froude number and the associated flow type. Flow rate Q hup U Fr Flow type (L/s) (m) (m/s) 0.50 1.25 3.40
0.055 0.105 0.205
0.07 0.10 0.13
0.099 0.094 0.094
SUBCRITICAL SUBCRITICAL SUBCRITICAL
Figure 5 represents the mapping of the mean surface velocities for the flow rate of 1.25 L/s, under steady flow regime.
Table 3. Determination of the Reynolds number and the associated flow type. Flow rate Q hup Twater Re Flow type (L/s) (m) (°C) 0.50 1.25 3.40
0.055 0.105 0.205
24.7 24.2 24.5
2365 4093 7026
TURBULENT TURBULENT TURBULENT
• T he flow pattern, according to the theoretical-experimental approach of Dufresne et al. (2010a,b) and Camnasio, Orsi and Schleiss (2011), corresponds to the type A1, asymmetrical, contrary to what was observed for the lower flow rate. Furthermore, it was noticed the deviation of the main jet toward the right lateral wall of the basin, forming a large vortex in counterclockwise direction;
Figure 4. Mean surface velocities obtained experimentally for Test 1. RBRH, Porto Alegre, v. 23, e19, 2018
5/12
Experimental and numerical investigation of flow patterns in shallow rectangular reservoirs with symmetrically positioned inlet and outlet channels
• I t was also verified the formation of two small vortices in the upstream portion of the basin, one to the left and one to the right of the locality where the inlet channel was installed. Both vortices had very low velocities (around 0.02 m/s) and appeared to circulate predominantly clockwise, with the left side practically imperceptible;
Finally, with regard to the flow rate of 3.40 L/s, the mapping of surface velocities is shown in Figure 6. The main observations of this experimental scenario are presented below:
• T he maximum surface velocity observed was 0.10 m/s, at the entrance of the basin and along the main jet. In general, the higher velocities were concentrated within the path formed by the flow, decreasing gradually until reaching the downstream channel and forming an even slower recirculation, with maximum velocities of 0.03 m/s; • T he central parts of the three vortices identified represented stagnation zones, where it was not possible to observe the presence of surface velocity vectors.
• T he flow pattern in this case consisted of type A1, asymmetrical, similar to the one mapped to the flow rate of 1.25 L/s; • T he maximum surface velocity recorded through the LSPIV technique was 0.14 m/s and once again concentrated along the main jet (diverted to the right). They decreased gradually from upstream to downstream and notably in the recirculation branch of the larger vortex, derived from that jet; • T he larger vortex, counterclockwise, appeared to occupy an area larger than the corresponding one for the flow rate of 1.25 L/s. On the other hand, this impression must be due
Figure 5. Mean surface velocities obtained experimentally for Test 2.
Figure 6. Mean surface velocities obtained experimentally for Test 3. 6/12
RBRH, Porto Alegre, v. 23, e19, 2018
Miranda et al.
to the highest velocity modules in the entire basin area for Q = 3.40 L/s, whose vectors could be better characterized by the FUDAA-LSPIV software; • A small vortex was formed clockwise and with reduced velocities (not exceeding 0.05 m/s) in the upstream portion of the rectangular reservoir and to the right of the main jet. The left-side vortex could not be identified as for the 1.25 L/s flow rate. It is important to note that an unavoidable limitation of LSPIV results was observed, e.g. in Figure 6: there was an undue indication of the direction of some vectors around the two crossbars in the experimental apparatus. Due to the fact that the test basin was constructed of metal sheets, it was necessary to lock the longer sidewalls with the installation of these bars. These were inevitably projected within the bottom of the basin during filming. In summary, the flow pattern was symmetrical for the flow rate of 0.5 L/s and asymmetrical for the flow rates of 1.25 and 3.40 L/s. These results are consistent with Kantoush’s (2008) experiments in what can be compared, that is, essentially for the flow rate of 1.25 L/s and supposedly for the higher of them. However, as for the higher flow rates, the results presented here differ from what was expected by Dufresne et al. (2010a), whose flow pattern is supposed to be symmetrical. The experiments of Dufresne et al. (2010a) were carried out within a 1 m wide channel, whereas the reservoir of this study was 2 m wide and that of Kantoush (2008) was 4 m wide. It is hypothesized that there is some scale effect of the reservoir studied by Dufresne et al. (2010a) in relation to those of Kantoush (2008) and of this research. Thus, since the three models used the same fluid (i.e. water) and the surface tension is identical in all three models, the proportion between the Froude numbers (representative of the ratio between inertial and gravitational forces acting on the flow) and Weber numbers (representative of the ratio between surface tension forces and inertial forces) are different. Froude similarity to the three models implies that the Weber number is proportional to
the square of the geometric scale. Thus, the Weber number for the Kantoush model (2008) is 1/16 times that of Dufresne et al. (2010a) and 1/4 times that of the CPH/UFMG, consequently the relationship between gravitational forces and surface tension forces are more evident in the model of Dufresne et al. (2010a). According to Martin and Pohl (2000 apud HELLER, 2011), it should be noted that the influence of surface tension can be neglected for most prototypes in hydraulic engineering, except for small water depths, as is the case, for air entrainment, among other applications.
Numerical modeling In general, the simulations demanded about 10-12 hours of uninterrupted computational processing, corresponding to at least 11,000 iterations, recorded every second. Therefore, the simulations represented the insertion of clear water in the basin for a minimum time equivalent to 3 real hours until they were interrupted. It is important to note that each iteration corresponded to 10 simulation time steps Δt. This has made the output file size smaller than otherwise. In the following, Figures 7 to 9 are presented, corresponding to the numerical results for the reference flow rates of 0.50, 1.25 and 3.40 L/s. The combined analysis of Figures 7 to 9 allows to highlight the indication of a symmetrical flow representative of the flow pattern S0 defined by Dufresne et al. (2010a,b), regardless of flow rate. In all three cases, the main jet did not show significant lateral deflection and was therefore practically straight and aligned with the longitudinal axis of the basin. We could also see the development of two vortices of approximately similar proportions and relatively large, one to the left and another to the right of the main jet. However, it was not possible to identify by the related figures the direction of rotation of such recirculation zones. The highest mean flow velocities occurred along the main jet. For the flow rate of 0.50 L/s (Figure 7), it was noted that this velocity reached 0.08 m/s.
Figure 7. Mean velocities (m/s) obtained numerically for Test 1. RBRH, Porto Alegre, v. 23, e19, 2018
7/12
Experimental and numerical investigation of flow patterns in shallow rectangular reservoirs with symmetrically positioned inlet and outlet channels
With respect to the flow rate of 1.25 L/s (Figure 8), the maximum numerical value of the mean flow velocity was around 0.10 m/s. Finally, for the flow rate of 3.40 L/s (Figure 9), it could be seen that the maximum mean velocity was 0.14 m/s. Around the two vortices formed in all three experiments, this value abruptly decreased to about 0.01 to 0.02 m/s for the lowest flow rates and between 0.01 to 0.03 m/s, for the largest of them.
Comparison between experimental and numerical results From the experimental point of view, the flow symmetry condition was verified only for the flow rate of 0.50 L/s. Concerning the other tested flow rates (1.25 and 3.40 L/s), the flow pattern was asymmetrical, with the main jet diverting towards the right
lateral wall of the basin and giving rise to the formation of a large vortex in counterclockwise direction. According to Shapira, Degani and Weihs (1990) and Dewals et al. (2008), the main jet diversion is a result of the increase in velocity on one side of the jet, usually the one closest to a sidewall, with consequent decrease in local pressure, amplification of flow deflection and flow asymmetry. This behavior is known as Coanda effect, the main reason for the observed hydrodynamic asymmetry. On the other hand, with respect to the numerical results obtained through the WOLF 2D software, it was verified that there was no significant deviation of the main jet for any flow rate tested. This flow moved throughout the basin practically aligned with its longitudinal axis, as shown by the analysis of Figures 7 to 9. That is, convergence of numerical and experimental results was observed only for the flow rate of 0.50 L/s.
Figure 8. Mean velocities (m/s) obtained numerically for Test 2.
Figure 9. Mean velocities (m/s) obtained numerically for Test 3. 8/12
RBRH, Porto Alegre, v. 23, e19, 2018
Miranda et al.
Being the WOLF 2D software a two-dimensional mathematical model, it is not fully capable of reproducing the instability of the observed flow. In this case, the shallow water equations (SWE) are not able to model the problem, because the flow is three-dimensional. On the other hand, with the use of ultrasonic velocity profilers, Kantoush (2008) found that the vertical component of velocity was comparatively low relative to the horizontal component. For this reason, he used two‑dimensional numerical models in his study, as well as other authors, such as Dufresne et al. (2011). Concerning the comparison of the velocities obtained in the laboratory tests and through the WOLF 2D program, it should be emphasized that, numerically, the values corresponded to the mean vertical velocity profile. On the other hand, the technique used in the physical modeling to determine velocities through image acquisition (LSPIV) referred to the superficial velocity values. Therefore, it would be expected that the values obtained by the WOLF 2D model would be lower than those based on the LSPIV technique. According to Table 4, it could be observed that the maximum numerical and experimental velocities were identical for the flow rates of 1.25 and 3.40 L/s, whereas the WOLF 2D computational model seemed to overestimate by 60% the values of the respective velocities for the flow rate of 0.50 L/s, in relation to the data of the experimental setup. It is worth noting that in-depth velocities, in spite of the great convenience of data acquisition by the LSPIV (surface velocity) technique, should not be neglected or discarded during the experimental tests. On the contrary, both forms of data acquisition should be used simultaneously, if possible, to enrich the experimental analysis. If the velocity data were in depth, it would be possible to evaluate the ability or limitation of the WOLF 2D software in determining the mean velocity of the flow, since it would be possible to compare the data related to the same parameter. A strongly recommended alternative when performing this type of experiment is the use of Vectrino profilers and/or UVP (Ultrasonic Doppler velocity profiler) type probes.
Threshold between symmetrical and asymmetrical patterns In order to investigate precisely at which flow rate the flow pattern changes from symmetrical to asymmetrical, three complementary experimental tests were carried out (tests 4 to 6). In this sense, the flow rate was varied in a range between 0.80 L/s and 1.25 L/s, as shown in Table 5, without, however, changing the height of the sill installed in the final section of the downstream channel. That is, it was tried to evaluate the sensitivity only of the inflow rate on the flow pattern, despite the small variation of the depth in the reservoir naturally provoked by the variation of the flow discharge. The water depths in all experiments were obtained within the inlet section of the downstream channel. All the complementary experimental tests were also filmed so that it was possible to analyze the corresponding flow pattern to these scenarios. The FUDAA-LSPIV software was used again to generate the mean surface velocity fields for each reference flow rates. Figures 10, 11 and 12 correspond, respectively, to the results obtained using the LSPIV technique for flow rates of RBRH, Porto Alegre, v. 23, e19, 2018
Table 4. Comparison of maximum velocities between physical and numerical modeling under clear water condition. Experimental results Numerical results Flow rate Maximum mean Maximum surface Q (L/s) velocity in the vertical velocity (m/s) profile (m/s) 0.50 1.25 3.40
0.05 0.10 0.14
0.08 0.10 0.14
Table 5. Complementary experimental tests. Flow rate Q Downstream water Test number (L/s) depth h (m) 4 5 6
0.80 1.00 1.25
0.059 0.063 0.066
0.80, 1.00 and 1.25 L/s. It should be emphasized that the experiment performed for this last hydraulic condition differed from that related to Figure 4. While that referring to Test 2 corresponded to a water depth of 0.105 m (Table 2), the latter, related to Test 5, was 0.066 m deep (Table 5). For evaluation of the flow rate from which the flow pattern became asymmetrical, the result synthesized by Figure 4 for the flow rate of 0.50 L/s was considered as a reference. In this case, it was found that the flow was symmetrical, with the existence of a main jet rectilinear and aligned with the longitudinal axis of the basin and two large vortices in opposite directions, one counterclockwise to the left and another clockwise to the right of that jet. Figure 10 allowed to elucidate that the flow pattern continued being symmetrical, even for the flow rate of 0.80 L/s. The only noticeable differences with respect to the flow pattern were a slight increase in the maximum surface velocity (from 0.05 to 0.06 m/s) with increasing flow and a slight shortening of the two vortices near the upstream portion of the basin. Concerning the flow rate of 1.00 L/s (Figure 11), the flow pattern remained practically symmetrical even though the vortex to the right of the main jet has not been well represented by the software. Possibly, it is a transition flow between the two flow patterns, that is, from symmetrical to asymmetrical. According to Figure 12, it was also verified that the flow pattern became asymmetrical with increase of the flow rate to 1.25 L/s, with deviation of the main jet to the right side. In addition, it can be seen the formation of a large vortex in counterclockwise direction, similar to that observed in Figure 5, but with smaller velocities, no higher than 0.08 m/s against 0.10 m/s of that scenario. In this case, there was no clear evidence of the existence of the two other smaller recirculation zones in the upstream portion of the rectangular reservoir. Therefore, it was concluded that the change of the flow pattern from symmetrical to asymmetrical occurred for flow rate between 1.00 and 1.25 L/s, associated to the water depth of around 6 cm. 9/12
Experimental and numerical investigation of flow patterns in shallow rectangular reservoirs with symmetrically positioned inlet and outlet channels
Figure 10. Mean surface velocities obtained experimentally for Test 4.
Figure 11. Mean surface velocities obtained experimentally for Test 5.
Figure 12. Mean surface velocities obtained experimentally for Test 6. 10/12
RBRH, Porto Alegre, v. 23, e19, 2018
Miranda et al.
With regard to the quality of the flow field results, especially in Figures 10 to 12, it should be emphasized that it could be significantly improved if a larger amount of plastic tracer particles were used. A uniform distribution of such tracers along the entire upstream wall would also be preferable rather than their insertion only within the upstream channel. This would possibly result in a dense velocity vector mapping.
CONCLUSIONS This paper presented a qualitative-quantitative characterization of the hydrodynamic behavior of a specific rectangular reservoir under clear water condition. Considering the data obtained experimentally, it was possible to highlight the following aspects: (1) there was hydrodynamic symmetry, corresponding to the development of two vortices of similar proportions and in opposite rotation directions, only for the flow rate of 0.50 L/s. The two identified vortices were formed on either side of the main jet, which did not show lateral deflection and, therefore, displaced rectilinear and aligned with the longitudinal axis of the basin; (2) for the other flow rates (1.25 and 3.40 L/s), it was observed that the flow was asymmetrical, with the formation of a large counterclockwise vortex originated from the main jet diverting to the right side of the basin; (3) according to the considerations of Dufresne et al. (2010a), the flow pattern would supposedly be symmetrical for the largest flow rates tested in the UFMG laboratory. On the other hand, the results of the present research were consistent with the experimental observations of Kantoush (2008). With respect to the last commented aspect, it is possible that there was some scale effect of the reservoir studied by Dufresne et al. (2010a) in relation to those of Kantoush (2008) and of this research. While the tests of the first authors were performed within a 1.0-meter wide channel, Kantoush’s (2008) experiments were conducted on a 4.0-meter-wide rectangular reservoir. In turn, the UFMG’s basin was 2.0 m wide. It was also observed experimentally that the change of the flow pattern from symmetrical to asymmetrical occurred for a flow rate between 1.00 and 1.25 L/s, considering the water depth of around 6.0 cm. Regarding the numerical results, it was observed the existence of a hydrodynamically symmetrical flow pattern, regardless of the flow rate. Comparing the numerical results with the experimental ones, it was verified a divergence of the hydrodynamic behavior identified for the flow rates of 1.25 and 3.40 L/s. While the simulations of the WOLF 2D software pointed to symmetry of the flow pattern, it was observed experimentally that the flow was asymmetrical. Because it is a two-dimensional computational program, it is possible that the turbulence model coupled with the WOLF 2D software could not adequately reproduce the experimental observations. In order to properly model the behavior observed in the experiments, it is recommended the use of the Navier‑Stokes equations without simplifications and turbulence models in a discrete domain with a mesh refined enough to capture the instabilities. RBRH, Porto Alegre, v. 23, e19, 2018
ACKNOWLEDGEMENTS The authors acknowledge the Brazilian National Council for Scientific and Technological Development (CNPq) for providing funding for the assembly of the experimental apparatus and acquisition of support materials used during the laboratory experiments. Moreover, the authors would like to thank Prof. Benjamin J. Dewals of the University of Liège (ULg, Belgium) for his valuable and indispensable collaboration and suggestions for this research. Moreover, the first author acknowledges the Federal Institute of Education, Science and Technology of Minas Gerais (IFMG Campus Santa Luzia, Brazil) for its collaboration with this work and, in particular, the Portuguese Foundation for Science and Technology (FCT) for financial support during his permanence in Portugal, through its funding program PD/BD/135219/2017. Finally, the authors would like to express their sincere thanks to the two reviewers who provided extremely relevant contributions to the improvement of the manuscript.
REFERENCES CAMNASIO, E. Investigation of flow patterns and sedimentation in rectangular shallow reservoirs. 2012. 154 f. Thesis (PhD) - Politecnico di Milano, Milan, 2012. CAMNASIO, E.; ERPICUM, S.; ORSI, E.; PIROTTON, M.; SCHLEISS, A.; DEWALS, B. J. Coupling between flow and sediment deposition in rectangular shallow reservoirs. Journal of Hydraulic Research, v. 51, n. 5, p. 535-547, 2013. http://dx.doi.org /10.1080/00221686.2013.805311. CAMNASIO, E.; ORSI, E.; SCHLEISS, A. J. Experimental study of velocity fields in rectangular shallow reservoirs. Journal of Hydraulic Research, v. 49, n. 3, p. 352-358, 2011. http://dx.doi. org/10.1080/00221686.2011.574387. DEWALS, B. J.; ERPICUM, S.; ARCHAMBEAU, P.; PIROTTON, M. Discussion of “experimental study of velocity fields in rectangular shallow reservoirs”. Journal of Hydraulic Research, v. 50, n. 4, p. 435436, 2012. http://dx.doi.org/10.1080/00221686.2012.702856. DEWALS, B. J.; KANTOUSH, S. A.; ERPICUM, S.; PIROTTON, M.; SCHLEISS, A. J. Experimental and numerical analysis of flow instabilities in rectangular shallow basins. Environmental Fluid Mechanics, v. 8, n. 6, p. 31-54, 2008. http://dx.doi.org/10.1007/ s10652-008-9053-z. DUFRESNE, M.; DEWALS, B. J.; ERPICUM, S.; ARCHAMBEAU, P.; PIROTTON, M. Classification of flow patterns in rectangular shallow reservoirs. Journal of Hydraulic Research, v. 48, n. 2, p. 197204, 2010a. http://dx.doi.org/10.1080/00221681003704236. DUFRESNE, M.; DEWALS, B. J.; ERPICUM, S.; ARCHAMBEAU, P.; PIROTTON, M. Experimental investigation of flow pattern and sediment deposition in rectangular shallow reservoirs. International Journal of Sediment Research, v. 25, n. 3, p. 258-270, 2010b. http:// dx.doi.org/10.1016/S1001-6279(10)60043-1. 11/12
Experimental and numerical investigation of flow patterns in shallow rectangular reservoirs with symmetrically positioned inlet and outlet channels
DUFRESNE, M.; DEWALS, B. J.; ERPICUM, S.; ARCHAMBEAU, P.; PIROTTON, M. Numerical investigation of flow patterns in rectangular shallow reservoirs. Engineering Applications of Computational Fluid Mechanics, v. 5, n. 2, p. 247-258, 2011. http://dx.doi.org/10 .1080/19942060.2011.11015368. ERPICUM, S.; MEILE, T.; DEWALS, B. J.; PIROTTON, M.; SCHLEISS, A. J. 2D numerical flow modelling in a macro-rough channel. International Journal for Numerical Methods in Fluids, v. 61, n. 11, p. 1227-1246, 2009. http://dx.doi.org/10.1002/fld.2002. HELLER, V. Scale effects in physical hydraulic engineering models. Journal of Hydraulic Engineering, v. 49, n. 3, p. 293-306, 2011. JANSONS, K.; LAW, S. The hydraulic efficiency of simple stormwater ponds. In: INTERNATIONAL RAINWATER CATCHMENT SYSTEMS CONFERENCE, 13., 2007, Sydney. Proceedings… Sydney: IRCSA, 2007. JIRKA, G. H.; UIJTTEWAAL, W. S. J. Shallow flows. In: INTERNATIONAL SYMPOSIUM ON SHALLOW FLOWS, 4., 2004, Delft. Proceedings… Delft: Taylor & Francis, 2004. JODEAU, M.; HAUET, A.; LE COZ, J. Fudaa-LSPIV 1.3.2: guide d’utilisation. [S.l.]: EDF R&D, EDF DTG, Irstea, 2013. 26 p. In french. KANTOUSH, S. A. Experimental study on the influence of the geometry of shallow reservoirs on flow patterns and sedimentation by suspended sediments. 2008. 542 f. Thesis (PhD) - École Polytechnique Fédérale de Lausanne, Lausanne, 2008. KOLYSHKIN, A.; NAZAROVS, S. On the stability of wake flows in shallow water. In: INTERNATIONAL CONFERENCE ON MATHEMATICAL MODELLING AND ANALYSIS, 10., 2005, Trakai. Proceedings… Trakai: Technika, 2005. p. 103-109. LI, M.; ZHANG, H.; LEMCKERT, C.; LU, Z.; LEI, L.-M.; STRATTON, H. Three-dimensional investigation of retention time distribution of waste stabilisation ponds. In: INTERNATIONAL CONGRESS ON MODELLING AND SIMULATION, 20., 2013, Adelaide. Proceedings… Adelaide: Modelling and Simulation Society of Australia and New Zealand, 2013. MARTIN, H.; POHL, R. (Ed.). Technical hydromechanics. Berlin: Verlag für Bauwesen, 2000. (Technische Hydromechanik, 4). In german. MASALÓ, I. Hydrodynamic characterisation of aquaculture tanks and design criteria for improving self-cleaning properties. 2008. 109 f. Thesis (PhD) - Universitat Politècnica de Cataluntya, Barcelona, 2008. MESELHE, E. A.; PEEVA, T.; MUSTE, M. Large scale particle image velocimetry for low velocity and shallow waters flows.
12/12
Journal of Hydrologic Engineering, v. 130, n. 9, p. 937-940, 2004. http://dx.doi.org/10.1061/(ASCE)0733-9429(2004)130:9(937). MIRANDA, D. A.; VOLOCH NETO, S.; COELHO, M. M. L. P.; REIS, A. M.; VEIZAGA, F. M. Avaliação qualitativa de padrões de escoamento em reservatórios rasos. In: CONGRESSO INTERNACIONAL DE HIDROSSEDIMENTOLOGIA, 2., 2017, Foz do Iguaçu. Anais… Porto Alegre: ABRH, 2017. OLUKANNI, D.; DUCOSTE, J. Optimization of waste stabilization pond design for developping nations using computational fluid dynamics. Ecological Engineering, v. 37, n. 11, p. 1878-1888, 2011. http://dx.doi.org/10.1016/j.ecoleng.2011.06.003. PELTIER, Y.; ERPICUM, S.; ARCHAMBEAU, P.; PIROTTON, M.; DEWALS, B. Can meandering flows in shallow rectangular reservoir be modelled with the 2D shallow water equations? Journal of Hydraulic Engineering, v. 141, n. 6, p. 04015008, 2015. http:// dx.doi.org/10.1061/(ASCE)HY.1943-7900.0001006. PELTIER, Y.; ERPICUM, S.; ARCHAMBEAU, P.; PIROTTON, M.; DEWALS, B. Numerical modelling of meandering jets in shallow rectangular reservoir using two different turbulent closures. In: IAHR EUROPE CONGRESS, 4., 2016, Liège. Proceedings… Liège: IAHR, 2016. PERSSON, J.; WITTGREN, H. B. How hydrological and hydraulic conditions affect performance of ponds. Ecological Engineering, v. 21, n. 4-5, p. 259-269, 2003. http://dx.doi.org/10.1016/j. ecoleng.2003.12.004. SHAPIRA, M.; DEGANI, D.; WEIHS, D. Stability and existence of multiple solutions for viscous flows in suddenly enlarged channels. Computers & Fluids, v. 18, n. 3, p. 239-258, 1990. http:// dx.doi.org/10.1016/0045-7930(90)90009-M. WEITBRECHT, V.; KÜHN, G.; JIRKA, G. H. Large scale PIV measurements at the surface of shallow water flows. Flow Measurement and Instrumentation, v. 13, n. 5-6, p. 227-245, 2002. http://dx.doi. org/10.1016/S0955-5986(02)00059-6.
Authors contributions Daniel Augusto de Miranda: Experimental and numerical tests; writing of the whole text. Álefe Marques dos Reis: Support on experimental tests and writing of some parts of the text. Márcia Maria Lara Pinto Coelho: General review.
RBRH, Porto Alegre, v. 23, e19, 2018