Hindawi Publishing Corporation Mathematical Problems in Engineering Volume 2013, Article ID 301748, 14 pages http://dx.doi.org/10.1155/2013/301748
Research Article Numerical and Experimental Investigation on the Flow Separation Control of S809 Airfoil with Slot Yonghui Xie,1 Jianhui Chen,1 Huancheng Qu,1 Gongnan Xie,2 Di Zhang,3 and Mohammad Moshfeghi1 1
School of Energy and Power Engineering, Xi’an Jiaotong University, Xi’an, Shaanxi 710049, China Engineering Simulation and Aerospace Computing (ESAC), School of Mechanical Engineering, Northwestern Polytechnical University, P.O. Box 552, Xi’an, Shaanxi 710072, China 3 Key Laboratory of Thermal Fluid Science and Engineering, Ministry of Education, School of Energy and Power Engineering, Xi’an Jiaotong University, Xi’an, Shaanxi 710049, China 2
Correspondence should be addressed to Yonghui Xie;
[email protected] Received 15 September 2013; Accepted 24 October 2013 Academic Editor: Manyu Xiao Copyright © 2013 Yonghui Xie et al. This is an open access article distributed under the Creative Commons Attribution License, which permits unrestricted use, distribution, and reproduction in any medium, provided the original work is properly cited. A new flow control approach called split blade is applied on the S809 airfoil in the present study. S809 airfoil was investigated experimentally and numerically with different operating conditions including cascade without control, cascade with slots that generate jets with AOAs of 0 degrees, 10 degrees, 15 degrees and 20 degrees. Good agreement was obtained between the comparison of the experimental and numerical results. The results show that the separation area increases with increase of the AOA and the large separation area appears on the airfoil suction surface at AOA equal to 20 degrees. Numerical results show that the control method has little negative influence on the airfoil performance at small AOAs. Smaller vortices are filled with the large separated area which is divided by the jet generated by split when the AOA is 20 degrees. The analysis on the lift coefficient and drag coefficient shows that the flow is improved with the control. The lift coefficient and drag coefficient do not change in the comparison between the cases before and after control when AOA is 0 degrees and 10 degrees. However, the lift coefficient increases and drag coefficient decreases when AOA is 15 degrees and 20 degrees.
1. Introduction Wind turbine is one of the mechanisms used to accomplish the transformation of wind energy into electric energy and it is the key part of wind turbine generator. The aerodynamic characteristics of wind turbine blade are directly related to the wind turbine generator’s efficiency. The research on wind turbine blade’s aerodynamic characteristics and performance has been an important subject of wind power technique. Wind turbine blade always works at high angle of attack even at deep stall condition. The flow separation phenomena will appear on the suction surface of wind turbine blade at the high angles of attack (AOAs), which affects the aerodynamic performance of wind turbine blade seriously. There is a great demand for investigating and exploiting a simple and useful control approach to suppress the flow separation on the blade surface and enhance the aerodynamic performance of blade.
Flow control method is an important research field of fluid mechanics, which has been pushed more than 50 years ago. The energy decreases, the lift of airfoil is reduced, and the resistance grows by the separation. The aim of flow control is to reduce the separation zone and flow resistance. In recent years, the experimental and numerical research about wind turbine aerodynamics covers a wide variety of aspects including the control method and the dynamic wall [1, 2]. Kummer and Dang [1] embedded a crossflow fan near trailing edge into a thick wing for raising lift and the results show that the stall AOA is delayed to 40 degrees and the lift coefficient is enhanced to 6. Dygert and Dang [2] studied the same experimental rig and the same conclusion was obtained. The blowing and suction control method was studied in detail [3–5]. Mitsudharmadi and Cui [3] implemented the coflow jet concept on low Reynolds number airfoil and the results show that the momentum coefficient is found to be
2
300 mm
300 mm
1650 mm
660 mm
in the range of 5% and 13% when CFJ concept was used effectively. Chen et al. [4] used steady blowing and suction for separation and circulation control on an elliptical airfoil, which indicated that blowing is more effective than suction. Pulsed blowing was adopted for the separation control by Coiro et al. [5]. Both numerical simulation and wind tunnel experimental result show that unsteady blowing is one of the most advanced solutions for flow separation. The actuation frequency was optimized in the above study. The synthetic jet actuator (SJA) is still the new technology for wind turbines blades, which needs to be studied. Many scholars have since investigated the aerodynamics, actuation frequency, and the monument range of the SJAs. The experimental results of circular cylinder [6] show that the control effect is the best when the SJA was placed at the separated point. Xia and Luo [7] studied the flow characteristic of SJA using the PIV technology, and the optimal frequency was obtained. Farnsworth et al. [8] simulated the delta wing array SJA numerically. You and Moin [9] simulated the NC0015 airfoil with SJA. Flap is also a kind of flow control method. Zhao and Zheng [10] simulated the wind turbine with Gurney flap. Cole et al. [11] tested the various airfoils with Gurney flaps in the wind tunnel. Feng et al. [12] studied the NACA0012 airfoil with Gurney flap treatment by dielectric-barrier-discharged plasma. Lee and Su [13] investigated the control effects of the wingtip vortex experimentally. Jir´asek [14] investigated the vortex generators with various shapes. Delnero et al. [15] investigated the low Reynolds number airfoil with vortex generators experimentally. Seshagiri et al. [16] studied the control effects of steady and unsteady vortex generator on airfoil. Pavel et al. [17] studied the control effects of surface HF plasma actuator on NACA 23012 airfoil. G¨oksel et al. [18] simulated the airfoil of ornithopter with pulsed plasma actuators. Benard et al. [19] studied the hysteresis effects for closed-loop separation control using plasma actuation. In the present study, a novel passive flow control method is studied as shown in Figure 2. The separation on the blade is reduced by this method, which improves the blade aerodynamic efficiency.
Mathematical Problems in Engineering
𝜙 600 mm
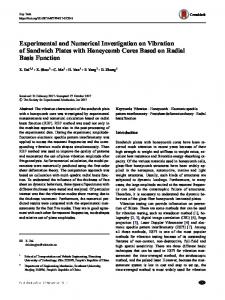
Figure 1: S809 airfoil (mm).
335
mm
Split airfoil
(a)
300 mm 3 mm
120 mm
270 mm Geometry of split (b)
Figure 2: Geometry of split airfoil.
2. Physical Model The physical model of this research is the S809 airfoil which is used for the horizontal axis wind turbines (HAWTs). The chord length of S809 airfoil (𝑐) is 300 mm. The CFD models consist of one outer domain and one inner domain. The inner domain is a cylinder with a radius of 300 mm and its origin is located at the leading edge (LE) of the airfoil. The outer domain extends from 600 mm (2𝑐) upstream of the LE to 1650 mm (5.5𝑐) downstream; the downstream length of computational domain is longer than the experimental one with the aim of avoiding the effect of outlet, and the outline of the outer domain is the contour of the experiment test section. The whole domain consists of two subdomains with a span of 𝑏 = 200 mm. The domains and their dimensions are shown in Figure 1. The main advantage of the model of this two-subdomain configuration is that only one set of meshes for the inner
and outer domains is required. This strategy retains the same mesh arrangement in both domains at different AOAs. In particular, it removes the effects of the near wall grid sensitivity for the area near the blade surface at different AOAs. A novel passive flow control method was studied to control the flow separation on airfoil surface at different AOAs, which is shown in Figure 2. The slot with the width of 3 mm was split though the body of the airfoil. One end of the cross-section of slot was placed at 30% of the chord on the pressure side of the airfoil and the other end was placed at 60% of the chord on the suction side of the airfoil. A jet is generated with the effect of pressure difference between two ends of slot, which disturbs the boundary layer flow and provides energy to the boundary layer.
Mathematical Problems in Engineering
3
Outlet 330 mm
Inlet U∞ Wall
Symmetric boundary condition
120 mm
880 mm
Figure 3: Boundary condition of simulation model. (a) Schematic diagram
3. Experiment Device The experimental platform was designed and built to study the separation flow characteristics of airfoil at different AOAs and the control effect of the slot method adopted in this study. The flow configuration is shown in Figure 3. The length of the test section is 1300 mm, the width of the test section is 660 mm, and the height of test section is 700 mm. In the experiment, a S809 airfoil with a chord length of 300 mm was installed in a wind tunnel, and the location of the airfoil was placed as shown in Figure 4. The center of rotation for the airfoil is designed at 𝑐/2. The particle image velocimetry (PIV) technology is used to capture the velocity field in the present experiment. PIV is a whole-flow-field technique for capturing and measuring the instantaneous velocity vector in a cross-section of flow. The typical installation of the PIV system is shown in Figure 5. The PIV system includes a charge coupled device (CCD) camera, double pulsed laser, synchronous controller, and computer. PIV measurements were performed using a CCD camera placed normal to the light sheet. The actual image resolution for the digital images at this frame rate is 1028 × 1028 pixels. The camera was focused onto the area of 50 mm (horizontal) × 50 mm (vertical) and 25 mm (horizontal) × 25 mm (vertical), with the top border of the image coinciding with the lower boundary of the flat plate. The experimental data using the method of averages to be processed, the limiting conditions were chosen to discarded the poor resolution results in the process of interrogation, for example, the min and max velocity, the quality of tracer particles captured by camera and so on.
4. Simulation Model A commercial CFD soft CFX has been used in this study; the three-dimensional Navier-Stokes equations were solved. SST-𝑘-𝜔 turbulence model was used in this study. SST-𝑘-𝜔 model is one of the most popular RANS turbulence models in computational fluid dynamics. The SST-𝑘-𝜔 is a two-equation eddy-viscosity model. The shear stress transport (SST) formulation has two important features. 𝑘-𝜔 formulation is used in the inner part of boundary layer, which solves the equations directly through the viscous sublayer, while the 𝑘-𝜀 is used for the free stream zone [20]. The equation for the turbulence kinetic energy transport is the first enclosure equation and can be presented as follows:
Test section (b)
Figure 4: The geometry of the wing tunnel test section.
Airfoil
CCD camera
Flow direction
Laser
Figure 5: The test section and the PIV system.
𝑘 equation: 𝜕 (𝜌𝑘) 𝜕 (𝜌𝑢𝑗 𝑘) 𝜕 𝜕𝑘 = 𝑃 − 𝛽∗ 𝜌𝜔𝑘 + [(𝜇 + 𝜎𝑘 𝜇𝑡 ) ] + 𝜕𝑡 𝜕𝑥𝑗 𝜕𝑥𝑗 𝜕𝑥𝑗 (1) 𝜔 equation: 𝜕 (𝜌𝜔) 𝜕 (𝜌𝑢𝑗 𝜔) 𝛾 = 𝑃 − 𝛽𝜌𝜔2 + 𝜕𝑡 𝜕𝑥𝑗 𝑉𝑡 +
𝜕 𝜕𝜔 [(𝜇 + 𝜎𝜔 𝜇𝑡 ) ] 𝜕𝑥𝑗 𝜕𝑥𝑗
4
Mathematical Problems in Engineering 0∘
10∘
(a)
(b)
∘
20∘
(c)
(d)
15
Figure 6: The experimental results at different AOAs before control.
+ 2 (1 − 𝐹1 ) 𝜎𝜔2 𝑃 = 𝜏𝑖𝑗
𝜌 𝜕𝑘 𝜕𝜔 , 𝜔 𝜕𝑥𝑗 𝜕𝑥𝑗
and outer (Φ2 ) constants, blended via the following linear equation:
𝜕𝑢𝑖 , 𝜕𝑥𝑗
𝜙 = 𝐹1 𝜙1 + (1 − 𝐹1 ) 𝜙2 .
The additional enclosure equation and constants are also given by
2 𝜕𝑢𝑘 2 𝛿 ) − 𝛿𝑘𝛿𝑖𝑗 , 3 𝜕𝑥𝑘 𝑖𝑗 3 1 𝜕𝑢𝑗 𝜕𝑢𝑖 + ). 𝑆𝑖𝑗 = ( 2 𝜕𝑥𝑖 𝜕𝑥𝑗
𝜏𝑖𝑗 = 𝜇𝑡 (2𝑆𝑖𝑗 −
2
𝐹2 = tanh {[max ( (2)
The turbulence eddy viscosity in the SST model is computed as 𝜇𝑡 =
𝜌𝑎1 𝑘 . max (𝑎1 𝜔, 𝑆𝐹2 )
(4)
𝑃𝑘 = min (𝜏𝑖𝑗
𝜕𝑢𝑖 , 10𝛽∗ 𝑘𝜔) , 𝜕𝑥𝑗
CD𝑘𝜔 = max (2𝜌𝜎𝜔2
(3)
As free stream and inside boundary layer use the different model, all of the constants (Φ) are a blend of inner (Φ1 )
2√𝑘 500V , )] } , 𝛽 ⋅ 𝜔𝑦 𝑦2 𝜔
𝐹1 = tanh {{min [max (
1 𝜕𝑘 𝜕𝜔 , 10−10 ) , 𝜔 𝜕𝑥𝑖 𝜕𝑥𝑖
√𝑘 500V 4𝜎𝜔2 𝑘 ]}} , , 2 ), 𝛽 ⋅ 𝜔𝑦 𝑦 𝜔 CD𝑘𝑤 𝑦2 (5)
Mathematical Problems in Engineering
5
0∘
10∘
(a)
(b)
∘
20∘
(c)
(d)
15
Figure 7: The experimental results at different AOAs after control.
0.0 0.1 0.2 0.3 0.4 0.5 0.6 0.7 0.8 0.9 1.0
Y plus
Figure 8: The Y plus distribution on the airfoil surface.
6
Mathematical Problems in Engineering
0∘
40 35 30 25 20 15 10 5 0
−0.1
−50
y (m)
0
0
50 100
0.1
150 −100
0.1
−0.1
10∘
−150 −100
−0.1
−50
y (m)
y (mm)
0 x (m)
0 50 100
0
0.1
150 100
0 x (mm) 15∘
−150
−100
0.1
0 x (m) 15∘
−0.1
y (m)
y (mm)
−50
0 50 100
0
0.1
150 0 x (mm) 20∘
−150
−100
0.1
−0.1
40 35 30 25 20 15 10 5 0
−0.1
−50
y (m)
y (mm)
0 x (m) 20∘
−100
0
0
50 100
0.1
150 100
0 x (mm)
(a)
40 35 30 25 20 15 10 5 0
−0.1
−100
100
40 35 30 25 20 15 10 5 0
V (m/s)
0 x (mm) ∘ 10
V (m/s)
100
−100
0.1
0
−0.1
x (m)
(b)
Figure 9: The experimental (a) and CFD (b) results at different AOAs.
V (m/s)
y (mm)
−100
V (m/s)
0∘
−150
Mathematical Problems in Engineering
7
Cl and Cd
0.6
0.4
0.2
0.0 0
5
10 AOA
15
20
Cl Cd
Figure 10: Lift and drag coefficient on the airfoil surface.
where 𝛼1 = 0.05, 𝛼2 = 0.44, 𝛽1 = 3/40, 𝛽2 = 0.0828, 𝛽∗ = 0.09, 𝜎𝑘1 = 0.85, 𝜎𝑘2 = 1.0, 𝜎𝜔1 = 0.5, and 𝜎𝜔2 = 0.856. The boundary condition of simulation: inlet is inlet velocity type and outlet is pressure outlet, the lateral side of the domain is wall, and up and down sides of the domain are considered to have symmetric boundary condition, which is shown in Figure 3. The ambient pressure is considered to be 1 atm and the air temperature is at 25∘ .
Table 1: The experiment and simulation condition. Case Case Case Case Case
Re (105 )
30 m/s
10
Angle of attack (∘ ) 0 10 15 20
Table 2: The grid-independence.
5. Results and Discussion The research conditions studied in the present experiment and numerical simulation are shown in Table 1; the turbulence intensity of the tunnel inlet tested by hot wire anemometer was 0.08%. The streamline images captured by the PIV camera are shown in Figure 6. The white part is the tracer particle which shows the flow near the airfoil. The black part is the airfoil. The flow is smooth as shown by tracer particle when AOA is 0∘ and 10∘ and there is no significant separation. However, the separation zone on the airfoil surface appears to be significant which is marked out by red loop when the AOA increases to 15∘ . The separation point locates at the centre of the chord. The large separation area that appears on airfoil surface at AOA is 20∘ and the separation point is moved up to the leading edge of airfoil. Figure 7 shows the streamlines of separation zone with control captured by CCD camera, in which the jet generated by slot nearly has no effect on the boundary layer flow of slot downstream when AOA is 0∘ . It mainly results from that the pressure difference between the two sides of the slot is so small that the effect of the jet is faint. The flow near the boundary layer downstream the slot is interrupted by jet when AOA is 10∘ . The outlet of slot is placed at the location of separation point when AOA is 15∘ and the jet just flows into the separation zone. The separation point moves down to the downstream of slot and the separation zone is reduced. The
1 2 3 4
Inlet velocity
Item 1
Grid no./10 K 132
Lift 1.630
Adjacent relative deviation 0.6%
164
1.640
0.3%
3
181
1.646
0.06%
4
210
1.647
—
2
outlet of slot is placed at the inner region of separation zone and a jet flows into the separation zone when AOA is 20∘ . The same physical model was numerically simulated for the research on the flow structure and pressure on the airfoil surface before and after control in detail. The lifts for the sensitivity analysis at AOA is 0 degree are plotted in Table 2. From Table 2, it could be seen that when the grid number was larger than 1.8 million, lift coefficient changed a little with the increase of grid number. Therefore, when grid number was up to 1.8 million, computational accuracy could be met. Figure 8 is the contour of Y plus 𝑦+ on airfoil surface, and the definition of 𝑦+ is 𝑦+ = Δ𝑦(𝜏𝑤 /𝜌)0.5 /V, where Δ𝑦 is the height of first floor grid on the blade wall, 𝜏𝑤 is wall shear stress, 𝜌 is the fluid density, and V is kinematic viscosity coefficient. The details of 𝑦+ distribution are shown in Figure 8. Boundary layer grid on the blade surface meets the requirement for the turbulent solver.
8
Mathematical Problems in Engineering
0∘
0∘
150
40
0.15
35 25
50
20 15
0.05
V (m/s)
30
0.1 y (m)
y (mm)
100
10 0
5
0 −50
50 x (mm)
0
100
0
−0.05
10∘
0 x (m)
0.05
10∘
150
40
0.15
35 25
50
20 15
0.05
V (m/s)
30
0.1 y (m)
y (mm)
100
10 0
5
0 −50
50
0
100
0
−0.05
0
x (mm)
x (m)
15∘
15∘
150
0.05
0.15
40 35 25
50
20 15
0.05
V (m/s)
30
0.1 y (m)
y (mm)
100
10 0
5
0 −50
0
50
100
0
−0.05
x (mm)
0
0.05
x (m)
20∘
20∘ 0.15
150
40 35
50
20 0.05
15 10
0
5
0 −50
50 0 x (mm) (a)
100
0
−0.05
0 x (m)
0.05
(b)
Figure 11: The experimental (a) and CFD (b) results of the velocity field of airfoil.
V (m/s)
25
y (m)
y (mm)
30
0.1
100
Mathematical Problems in Engineering
9
Cl and Cd
0.6
0.3
0.0 0
5 With control Cl Without control Cd
10 AOA
15
20
Without control Cl With control Cd
Figure 12: The lift and drag coefficient of the airfoil with and without control.
Figure 9 shows the experimental and CFD results without control in the case 1, case 2, case 3, and case 4 conditions. The CFD results coincide well with the experimental results. The flow is smooth on the airfoil surface when AOA is 0∘ while a small separation zone appears near the trailing edge when AOA is 10∘ . The big separation area appears on airfoil suction surface when AOA is 15∘ and 20∘ . Figure 10 shows the lift and drag coefficient of the airfoil at different AOAs. Both lift coefficient and drag coefficient increase with AOA. The increase of the amplitude of the lift coefficient is reduced when the separation appears on the airfoil surface and the increase of the amplitude of drag coefficient gets larger significantly when AOA is 15∘ and 20∘ . Figure 11 illustrates the experimental and numerical results with slot control at different AOAs. The numerical results and experimental results are in a good agreement. It can be seen that the control method has no effect on the velocity field near airfoil when AOA is 0∘ and 10∘ by comparing the contours of velocity field for different AOAs. The effects of split in breaking down the separated zone can be observed clearly in both CFD and experiment with a high level of agreement. The separated area is predicted accurately by the SST 𝑘-𝜔 computation especially when AOA is 15∘ and 20∘ . Figure 12 shows the lift and drag coefficient of the airfoil before and after control at different AOAs. The lift and drag coefficient did not change after control when AOAs are 0∘ and 10∘ . The lift coefficient increases from 61.2% to 62.8% after control when AOA is 15∘ while it increases from 63.9% to 68.8% when AOA is 20∘ . However, the drag coefficient increases slightly when AOAs are 10∘ and 20∘ . Figure 13 shows the reversed velocity contours at different AOAs with and without control. There is no reversed flow zone both before and after control when AOA is 0∘ and so the control method nearly has no influence on the boundary layer of the airfoil surface. There is a small reversed velocity
area near the airfoil trailing edge when AOA is 10∘ . The outlet of slot is far away from the separation zone and the jet has little influence on separation zone although the reversed velocity area is also reduced after control. When AOA is 15∘ , the outlet of the slot is located inside the separation zone and near to separation point. When the jet flows into the separation zone, the separation thickness is reduced. The outlet of slot is inside the separation zone when AOA is 20∘ and the separated zone is broken down completely. Figure 14 shows the pressure contour before and after control at different AOAs. The pressure distribution on the pressure side is not affected by split. Therefore, the concentration is focused on the suction surface. There is no change of the pressure distribution on the suction surface after control at AOA is 0∘ , 10∘ and 15∘ as shown in Figure 13. The pressure distribution downstream of the outlet of the slot with control is higher than that of the slot without control and there is a high pressure area which can be interpreted as the effect of a vortex core near the outlet of slot. To illustrate the impacts of the slot on the turbulent characteristics of flow, the turbulent structure is shown in Figure 15. The isosurface has a constant value of 𝜆 2 = −1500, where 𝜆 2 is a kind of criteria of coherent structure which is the nonrandom composition of turbulent flow. The definition of 𝜆 2 is 𝑆2 + Ω2 , where 𝑆 is the magnitude of the shear strain rate and Ω is the vorticity magnitude. The figures show that when AOA is 0∘ and 10∘ , the turbulent structure on the airfoil has no change after control. However, the turbulence structure generated by the separated vortex is reduced when AOA is 15∘ and 20∘ . It is noteworthy that the turbulence structure is broken into two small parts after control when AOA is 20∘ . Axial velocities in the separated area and weak zone are plotted in Figure 16. Three different axial locations at 𝑥/𝐶ax = (0.7, 0.8, 0.9) are also plotted, and 𝑦 coordinate is the distance from the wall. It should be noted that 𝑥 is the axial location and 𝐶ax is the axial chord of airfoil at different AOAs. There
10
Mathematical Problems in Engineering
y (m)
−0.1
−0.1
0.1 x (m)
−0.2
0.2
−0.1
0
10∘
−2 −4 −6 −8 −10 −12 −14 −16 −18 −20
y (m)
0.1
0 −0.1
0 −0.1
−0.1
0
0.1
−0.2
0.2
−0.1
0
x (m) 15∘
0.2
y (m)
y (m)
0.2
0.1
0 −0.1
0 −0.1
−0.1
0
0.1
−0.2
0.2
−0.1
0
x (m) 20∘
0.2
0.1 x (m)
y (m)
−0.1
0 −0.1
−0.1
0 (a)
0.1 x (m)
0.2
−0.2
−2 −4 −6 −8 −10 −12 −14 −16 −18 −20
0.2
0.1
0
−2 −4 −6 −8 −10 −12 −14 −16 −18 −20
20∘
0.2
0.1 y (m)
0.1 x (m) 15∘
0.2
0.1
−0.2
0.2
10∘
0.2
0.1
−0.2
0.1 x (m)
V (ms−1 )
0
V (ms−1 )
−0.1
0.2
y (m)
0
V (ms−1 )
y (m)
0
−0.2
−2 −4 −6 −8 −10 −12 −14 −16 −18 −20
0.1
0.1
−0.2
0∘
0.2
V (ms−1 )
0∘
0.2
−0.1
0
0.1
0.2
x (m)
(b)
Figure 13: Area with reversed velocity before control (a) and after control (b) at different AOAs.
Mathematical Problems in Engineering
11
0.1
Y (m)
0.1
0
0
−0.1
−0.1
−0.1
0.1
Y (m)
y (m)
101800 101700 101600 101500 101400 101300 101200 101100 101000 100900
0.1
0.1
0
0
−0.1
−0.1 −0.1
x (m)
0 x (m)
15∘
15∘
0
−0.1
0.1
0.1
0.1
Y (m)
0.1
y (m)
0.1
10∘
10∘
0
0
−0.1
−0.1 −0.1
0 x (m)
−0.1
0.1
0 x (m)
Y (m)
0
0
−0.1
−0.1 0 x (m) (a)
101800 101700 101600 101500 101400 101300 101200 101100 101000 100900
0.1
0.1
0.1
−0.1
101800 101700 101600 101500 101400 101300 101200 101100 101000 100900
20∘
20∘
y (m)
0 x (m)
(Pa)
0 x (m)
(Pa)
−0.1
(Pa)
y (m)
101800 101700 101600 101500 101400 101300 101200 101100 101000 100900
(Pa)
0∘
0∘
0.1
−0.1
0 x (m)
0.1
(b)
Figure 14: The pressure contour of airfoil before (a) and after control (b) at different AOAs.
12
Mathematical Problems in Engineering 0∘
0∘
180000 160200 140400 120600 100800 81000 61200 41400 21600 1800 −18000 10∘
10∘ 180000 160200 140400 120600 100800 81000 61200 41400 21600 1800 −18000
15∘
15∘ 180000 160200 140400 120600 100800 81000 61200 41400 21600 1800 −18000
20∘
(a)
20∘ 180000 160200 140400 120600 100800 81000 61200 41400 21600 1800 −18000 (b)
Figure 15: The contours and isosurfaces of 𝜆 2 before control (a) and after control (b) at different AOAs.
is no negative value of the axial velocity when AOA is 0∘ . The negative axial velocity appears when AOA is 10∘ , 15∘ , and 20∘ . The negative value of the axial velocity is higher before control than after control, which indicates that negative value of the axial velocity thickness is reduced after control.
6. Conclusion A new passive flow control method was proposed which is opening a slot in the airfoil. The fluid with high pressure flows into the separation zone to apply the energy through the slot and the separation is controlled. The S809 airfoil was studied by experiment and numerical simulation. Different operating conditions were investigated including cases without control
and cases with slots that generate jets with AOAs of 0∘ , 10∘ , 15∘ and 20∘ . The numerical results have good agreement with the experimental results. The result shows that the separation area enlarges with the increase of AOA, and the separation point moves to upstream. The big separation area appears on the airfoil suction surface when AOA is 20∘ . The detailed analysis of the numerical results shows that the control method has little negative influence on the airfoil performance at small AOAs. The jet generated by slot breaks the separated area into smaller vortices completely when AOA is 20∘ . The analysis of the lift coefficient and drag coefficient shows that the flow performance is improved with the control. The lift coefficient and drag coefficient have no change after control when AOA is 0∘ and 10∘ . However, the
Mathematical Problems in Engineering
13 10∘
0∘
40
y (mm)
y (mm)
40
20
20
0
0 0
0
20
20
U (m/s)
U (m/s)
(a)
(b) 15
∘
20∘ 120
y (mm)
y (mm)
80
40
60
0
0 0
20
0
40
U (m/s)
Before control 70% Cax Before control 80% Cax Before control 90% Cax
After control 70% Cax After control 80% Cax After control 90% Cax
20 U (m/s)
Before control 70% Cax Before control 80% Cax Before control 90% Cax
(c)
40 After control 70% Cax After control 80% Cax After control 90% Cax
(d)
Figure 16: Axial velocity component at different locations at different AOAs.
lift coefficient increases and drag coefficient decreases when AOA is 15∘ and 20∘ . [3]
Conflict of Interests The authors declare that there is no conflict of interests regarding the publication of this paper.
[4]
References [1] J. D. Kummer and T. Q. Dang, “High-lift propulsive airfoil with integrated crossflow fan,” Journal of Aircraft, vol. 43, no. 4, pp. 1059–1068, 2006. [2] R. K. Dygert and T. Q. Dang, “Experimental investigation of an embedded crossflow fan for airfoil propulsion/circulation
[5]
[6]
control,” Journal of Propulsion and Power, vol. 25, no. 1, pp. 196– 203, 2009. H. Mitsudharmadi and Y. Cui, “Implementation of Co-Flow Jet concept on low Reynolds number airfoil,” in Proceedings of the 40th AIAA Fluid Dynamics Conference, AIAA 2010-4717, Chicago, IlI, USA, July 2010. C. Chen, R. Seele, and I. J. Wygnanski, “On the comparative effectiveness of steady blowing and suction used for separation and circulation control on an elliptical airfoil,” in Proceedings of the 40th AIAA Fluid Dynamics Conference, AIAA 2010-4715, Chicago, IlI, USA, July 2010. D. P. Coiro, E. F. Bellobuono, F. Nicolosi, and R. Donelli, “Improving aircraft endurance through turbulent separation control by pulsed blowing,” Journal of Aircraft, vol. 45, no. 3, pp. 990–1001, 2008. J. Wang, L. Feng, and C. Xu, “Experimental investigations on separation control and flow structure around a circular cylinder
14
[7]
[8]
[9]
[10]
[11]
[12]
[13]
[14] [15]
[16]
[17]
[18]
[19]
[20]
Mathematical Problems in Engineering with synthetic jet,” Science in China E, vol. 50, no. 5, pp. 550–559, 2007. Z. Xia and Z. Luo, “PIV measurements of a dual synthetic jets actuator with a baffle plate,” in Proceedings of the 44th AIAA/ASME/SAE/ASEE Joint Propulsion Conference and Exhibit, AIAA 2008-4705, Hartford, Conn, USA, July 2008. J. A. N. Farnsworth, J. C. Vaccaro, and M. Amitay, “Active flow control at low angles of attack: stingray unmanned aerial vehicle,” AIAA Journal, vol. 46, no. 10, pp. 2530–2544, 2008. D. You and P. Moin, “Active control of flow separation over an airfoil using synthetic jets,” Journal of Fluids and Structures, vol. 24, no. 8, pp. 1349–1357, 2008. W. L. Zhao and X. L. Zheng, “Numerical simulation on the flow control by mounting indented Gurney flaps for a wind turbine,” Advanced Materials Research, vol. 512-515, pp. 623–627, 2012. J. A. Cole, A. Bernardo, O. Vieira, J. G. Coder, A. Premi, and M. D. Maughmer, “Experimental investigation into the effect of gurney flaps on various airfoil,” Journal of Aircraft, vol. 50, no. 4, pp. 1287–1294, 2013. L. Feng, T. N. Jukes, K. Choi, and J. Wang, “Flow control over a NACA 0012 airfoil using dielectric-barrier-discharge plasma actuator with a Gurney flap,” Experiments in Fluids, vol. 52, no. 6, pp. 1533–1546, 2012. T. Lee and Y. Y. Su, “Wingtip vortex control via the use of a reverse half-delta wing,” Experiments in Fluids, vol. 52, no. 6, pp. 1593–1609, 2012. A. Jir´asek, “Vortex-generator model and its application to flow control,” Journal of Aircraft, vol. 42, no. 6, pp. 1486–1491, 2005. J. S. Delnero, J. M. Di Leo, and M. E. Camocardi, “Experimental study of vortex generators effects on low Reynolds number airfoils in turbulent flow,” Journal of Aerodynamics, vol. 2, no. 1, pp. 50–66, 2012. A. Seshagiri, E. Cooper, and L. W. Traub, “Effects of vortex generators on an airfoil at low reynolds numbers,” Journal of Aircraft, vol. 46, no. 1, pp. 116–122, 2009. K. Pavel, I. Moralev, A. Klimov, and V. Bityurin, “Flow control over NACA, 23012 airfoil model by surface HF plasma actuator,” in Proceedings of the 50th AIAA Aerospace Sciences Meeting, AIAA 2012-1031, January 2012. B. G¨oksel, D. Greenblatt, I. Rechenberg, Y. Kastantin, C. N. Nayeri, and C. O. Paschereit, “Pulsed plasma actuators for active flow control at MAV Reynolds numbers,” Notes on Numerical Fluid Mechanics, vol. 95, pp. 42–55, 2007. N. Benard, J. P. Bonnet, and E. Moreau, “On the benefits of hysteresis effects for closed-loop separation control using plasma actuation,” in Proceedings of the 5th Flow Control Conference, AIAA 2010-4259, Chicago, Ill, USA, July 2010. F. R. Menter, “Zonal two equation k-𝜔 turbulence models for aerodynamic flows,” in Proceedings of the AIAA 24th Fluid Dynamics Conference, AIAA 1993-2906, June 1993.
Advances in
Operations Research Hindawi Publishing Corporation http://www.hindawi.com
Volume 2014
Advances in
Decision Sciences Hindawi Publishing Corporation http://www.hindawi.com
Volume 2014
Journal of
Applied Mathematics
Algebra
Hindawi Publishing Corporation http://www.hindawi.com
Hindawi Publishing Corporation http://www.hindawi.com
Volume 2014
Journal of
Probability and Statistics Volume 2014
The Scientific World Journal Hindawi Publishing Corporation http://www.hindawi.com
Hindawi Publishing Corporation http://www.hindawi.com
Volume 2014
International Journal of
Differential Equations Hindawi Publishing Corporation http://www.hindawi.com
Volume 2014
Volume 2014
Submit your manuscripts at http://www.hindawi.com International Journal of
Advances in
Combinatorics Hindawi Publishing Corporation http://www.hindawi.com
Mathematical Physics Hindawi Publishing Corporation http://www.hindawi.com
Volume 2014
Journal of
Complex Analysis Hindawi Publishing Corporation http://www.hindawi.com
Volume 2014
International Journal of Mathematics and Mathematical Sciences
Mathematical Problems in Engineering
Journal of
Mathematics Hindawi Publishing Corporation http://www.hindawi.com
Volume 2014
Hindawi Publishing Corporation http://www.hindawi.com
Volume 2014
Volume 2014
Hindawi Publishing Corporation http://www.hindawi.com
Volume 2014
Discrete Mathematics
Journal of
Volume 2014
Hindawi Publishing Corporation http://www.hindawi.com
Discrete Dynamics in Nature and Society
Journal of
Function Spaces Hindawi Publishing Corporation http://www.hindawi.com
Abstract and Applied Analysis
Volume 2014
Hindawi Publishing Corporation http://www.hindawi.com
Volume 2014
Hindawi Publishing Corporation http://www.hindawi.com
Volume 2014
International Journal of
Journal of
Stochastic Analysis
Optimization
Hindawi Publishing Corporation http://www.hindawi.com
Hindawi Publishing Corporation http://www.hindawi.com
Volume 2014
Volume 2014