' 2012 Wiley Periodicals, Inc.
genesis 00:1–15 (2012)
REVIEW
Experimental Approaches for Gene Regulatory Network Construction: The Chick as a Model System Andrea Streit,1* Monica Tambalo,1 Jingchen Chen,1 Timothy Grocott,1 Maryam Anwar,1 Alona Sosinsky,2 and Claudio D. Stern3 1
Department of Craniofacial Development and Stem Cell Biology, King’s College London, London, United Kingdom
2
Department of Biological Sciences, Institute of Structural and Molecular Biology, Birkbeck College, University of London, London, United Kingdom
3
Department of Cell and Developmental Biology, University College London, London, United Kingdom
Received 31 August 2012; Revised 9 November 2012; Accepted 11 November 2012
Summary: Setting up the body plan during embryonic development requires the coordinated action of many signals and transcriptional regulators in a precise temporal sequence and spatial pattern. The last decades have seen an explosion of information describing the molecular control of many developmental processes. The next challenge is to integrate this information into logic ‘‘wiring diagrams’’ that visualize gene actions and outputs, have predictive power and point to key control nodes. Here, we provide an experimental workflow on how to construct gene regulatory networks using the C 2012 chick as model system. genesis 00:1–15 , 2012. V Wiley Periodicals, Inc.
Key words: transcription factors; transcriptome analysis; conserved regulatory elements
INTRODUCTION During vertebrate embryonic development the body plan is laid down from a single cell, the fertilized egg. This involves the allocation of multipotent cells to the three germ layers, subdivision of the germ layers into organ primordia, spatial patterning, and finally, differentiation into special cell types. Thus, multipotent progenitor cells undergo a series of cell fate decisions during which their developmental potential becomes gradually restricted. Ultimately, the instructions for developmental programs are encoded in the genome with noncoding regulatory regions and their interacting factors controlling temporal and spatial deployment of cell fate determi-
nants and differentiation genes. While many individual components that govern specific events have been identified, the major challenge is now to integrate this information and to establish predictive models for normal development and disease. Gene regulatory networks (GRNs) are such models: they offer a systems level explanation of developmental processes, organogenesis, and cell differentiation (Davidson, 2009, 2010; Levine and Davidson, 2005; Li and Davidson, 2009; Peter and Davidson, 2011a). Their components are transcription factors, which activate or repress downstream target genes by binding to regulatory elements, and the signaling inputs that control their expression. Formation of the body plan requires coordinated and sequential action of many such factors controlling spatiotemporal distribution of cell fate specific proteins and differentiation factors. As cells become specified each population is characterized by a specific set of transcription factors defining its regulatory state. GRNs establish functional linkages between the signaling inputs, transcription factors, and their targets, thus providing a view of cell fate decisions at the molecular level (Fig. 1). In short, GRNs
Current address for Timothy Grocott: School of Biological Sciences, University of East Anglia, Norwich NR4 7TJ, United Kingdom. * Correspondence to: Andrea Streit, Department of Craniofacial Development and Stem Cell Biology, King’s College London, Guy’s Campus, Tower Wing Floor 27, London SE1 9RT, United Kingdom. E-mail:
[email protected] Contract grant sponsor: BBSRC, Contract grant sponsor: NIH Published online in Wiley Online Library (wileyonlinelibrary.com). DOI: 10.1002/dvg.22359
2
STREIT ET AL.
are ‘‘wiring diagrams’’ that explain how cells or organs develop and can highlight ‘‘inappropriate’’ behavior in disease states. Ultimately, they may also reveal a few critical transcription factors sufficient to impart a specific fate, in a paradigm similar to induced pluripotent stem cells. GRNs have a hierarchical structure with a clear beginning and terminal states, and therefore, have directionality: each state depends on the previous (Davidson, 2006). They define genetic circuits or modules, each with a specific task. It is thus easy to decipher how individual sub-circuits are used repeatedly in different contexts and how the assembly of new modules has allowed cell diversification as well as evolutionary changes. Importantly, however, GRNs not only provide information about the genetic hierarchy of network components but must also identify the cis-regulatory elements that integrate this information. Cis-regulatory analysis is crucial to uncover how individual modules and sub-circuits are deployed and reassembled within one organism, but also how changes in the regulatory relationships of network components drive evolutionary change, generate diversity, and novelty (Davidson, 2011; Hinman and Davidson, 2007; Monteiro, 2012; Peter and Davidson, 2011a). GRNs are typically depicted as directed diagrams with nodes representing genes and edges representing the connection between nodes and their targets (Fig. 1). Accurate networks provide experimental evidence for the genetic hierarchy as well as for each edge. This requires knowledge of (i) the expression of all transcription factors in a specific cell population (defining the regulatory state), (ii) the epistatic relationship of these transcription factors generally assessed by functional perturbation experiments, and (iii) the cis-regulatory elements integrating this information including evidence for direct interaction with appropriate transcription factors. This is a daunting task given the complexity of developmental processes and the genes involved; it is therefore not surprising that to date only few networks fulfil these criteria. A notable exception is the endomesoderm GRN in the sea urchin (Davidson et al., 2002; Oliveri et al., 2002; Peter and Davidson, 2011b; Revilla-i-Domingo et al., 2007; Wahl et al., 2009; see: http://sugp.caltech.edu/endomes/index.html). This network contains a large amount of detail explaining the causal relationship between most components. Thus, it is a good example for the predictive power of GRNs and provides a basis for computational modeling. In Drosophila, similar efforts have led to the discovery of the networks controlling anterior-posterior patterning of the embryo (Nasiadka et al., 2002), mesoderm development (Wilczynski and Furlong, 2010), and cell fate specification in the eye (Amore and Casares, 2010; Friedrich, 2006; Kumar, 2010) and in ascidians basic GNRs for neural patterning and heart formation have been determined (Imai et al., 2009; Woznica et al., 2012).
In vertebrates, tentative GRNs have been established for cardiac development (Cripps and Olson, 2002), mesendoderm formation (Koide et al., 2005; Loose and Patient, 2004; Morley et al., 2009), dorsal-ventral patterning of the neural tube (Vokes et al., 2007), neural crest (Betancur et al., 2010a; Sauka-Spengler and Bronner-Fraser, 2008), and sensory placode specification (Grocott et al., 2012). However, in most cases, the regulatory state of cells at different stages of specification has not been completely defined, many epistatic relationships remain unknown and few cis-regulatory interactions have been verified. This is largely due to the complexity of vertebrate systems, where cell lineage decisions do not follow stereotypic patterns, but are controlled by inductive interactions between large groups of cells combined with cell movements and rearrangements. Therefore, it is difficult to obtain expression data at single cell resolution and to define the regulatory state of whole cell populations. In addition, many of the vertebrate GRNs integrate data across different species; this is not straightforward due to differences in regulatory interactions that define each species, but also because of differences in experimental approaches, in morphology and speed of development and in some cases difficulties in establishing functional homology of genes [see e.g., Grocott et al., 2012 for discussion on Dlx genes]. Ideally therefore, GRN approaches should focus on a single model organism. This requires a fully sequenced genome, accessibility for gene manipulation in spatially and temporally controlled manner, strategies to assay the expression of many genes in a single sample and in good spatial resolution, and finally, rapid enhancer analysis to establish direct linkages. The chick is ideal for this purpose; its genome has been sequenced and is relatively compact. Its phylogenetic position as a nonmammalian amniote is well suited for cross-species sequence comparison, e.g., to identify conserved genomic regions. The embryology of the chick is very well described and similar to human development; the embryo is easily accessible for experimental manipulation and because of its relatively slow development, specific cell states can be defined easily. Recent technical advances like transcriptome analysis from small amounts of tissue, efficient knock-down and overexpression strategies, medium throughput transcript quantification, and chromatin immunoprecipitation (ChIP) have been adapted to the chick. This makes rapid GRN construction possible without having to resort to cell culture approaches to generate sufficient material. Here, we propose an experimental strategy for GRN construction using the chick as a model (Fig. 2). We focus on strategies for early developmental stages, however, with the availability of tissue specific enhancers, of strategies for integration of constructs into the genome permanently, and inducible expression systems similar strategies can be applied to later devel-
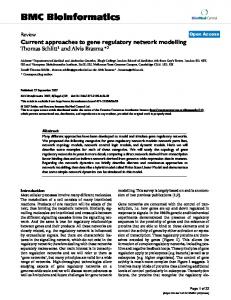
FIG. 1. An example of a simple gene regulatory network. (a) In this network, signal 1 from tissue A signals tissue B via a receptor (>>); this triggers the expression of transcription factors 1 and 2 (gene 2 and 3) and several downstream targets are activated (genes 4–6). These in turn regulate each others’ expression as indicated by the colored arrows. Positive interactions are depicted as arrows, negative interactions as bars. At a later time, tissue C emits a second signal, which leads to changes in gene expression in cells nearby, while cells far away are not exposed to signal 2. This leads to differential gene expression in tissue B1 and B2 depending on the transcription factors interactions and signaling input. (b) The initial stage in network construction is defining the regulatory state: the sum of genes expressed in each tissue at different times and the signals received from neighboring tissues (see Fig. 2, stage 2). (c) Perturbation experiments suggest interactions and hierarchy (see Fig. 2, stage 3). (d) Confirmed interactions after enhancer discovery and testing (Fig. 2, final stage).
4
STREIT ET AL.
edge of fate maps at different stages, cell lineage, inductive interactions that promote and repress certain cell fates, and ideally knowledge about fate specification and commitment. This information can only be acquired through careful study of development including the temporal hierarchy of events and tissue interactions. At least for early development, the chick is very appropriate as a system for such studies because of its accessibility for gene manipulation at different times combined with live imaging to study cell behavior and fate (Kulesa et al., 2010; Rupp and Kulesa, 2007; Stern, 2005a; Voiculescu et al., 2007; Yang et al., 2002). Moreover, its relatively slow development allows the dissection of developmental processes at a resolution not possible in rapidly developing species such as Xenopus and zebrafish as exemplified for neural (Stern, 2005b), neural crest (Betancur et al., 2010a), and placode induction (Grocott et al., 2012; Streit, 2008) as well as neural tube patterning (Balaskas et al., 2012; Ribes and Briscoe, 2009; Vokes et al., 2007), somitogenesis (Pourquie´, 2004), and limb development (Towers and Tickle, 2009). Not only is this knowledge essential for GNR construction, it also points to critical steps in the process, important cell fate decision, and interactions. To focus experimental strategies and design, this knowledge should be assembled in a flow chart, which will serve as a foundation for the GRN. DEFINING THE REGULATORY STATE
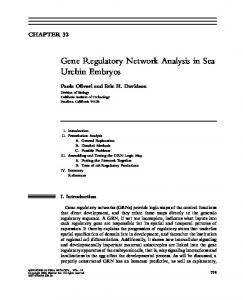
FIG. 2. Experimental workflow for building a gene regulatory network. Details for each step are described in the text. Generating a GRN is an iterative process, in which each perturbation experiment informs about the network architecture; integration of new information into the network points to novel hypotheses that can then be tested experimentally. Bioinformatics approaches are required to predict regulatory interactions and conserved regulatory modules (CRMs). In vivo testing of CRM activity and their regulation feeds back to the network.
opmental processes. A number of recent reviews discuss the feasibility, advantages, and disadvantages of different technical approaches and how they can be applied to particular questions; we refer the reader to these reviews for technical details. The accompanying paper by Khan et al. in this issue provides a complementary computational workflow. DEFINING THE PROBLEM While GRNs may appear abstract and remote from development, the most essential prerequisite for their construction is a detailed understanding of the biological process under investigation. Only when related to the biological process under investigation do GNRs make sense and are informative. This includes detailed knowl-
Once the biology has been thoroughly examined the next task is to define the regulatory state of each step in the process. An extensive survey of the literature will provide an excellent resource to define critical molecular markers as well as initial information on epistatic interactions and linkages within the network. Although cross species comparison is very useful, caution should be taken if equivalent cell states cannot be identified, gene expression data are ambiguous, and experimental designs vary considerably. Ultimately, a close-to-complete knowledge of all transcription factors as well as signals and their effectors is required to assemble a full GRN. With the availability of the chick genome, two strategies have been used successfully over the last few years for unbiased transcriptome analysis: microarrays and to a lesser extent RNA sequencing (RNAseq). A number of different microarrays are currently available for chick (Antin and Konieczka, 2005) among them a 20K chicken 70-mer oligo array [ARK genomics; modified version from Genomics Research Lab, University of Arizona (Hardy et al., 2011)], an Affymetrix GeneChip covering 28,000 validated and predicted chick genes and an Agilent microarray containing 43,803 probes (Paxton et al., 2010). In addition, several more specific arrays have been designed, e.g., for the immune and neuroendocrine systems. The majority of published
GENE REGULATORY NETWORK CONSTRUCTION
studies have used Affymetrix arrays (Alev et al., 2010; Bangs et al., 2010; Bento et al., 2011; Buchtova et al., 2010; Cruz et al., 2010; Handrigan et al., 2007; Kimura et al., 2011; Zhang et al., 2010). In general, a fairly large amount of tissue is micro-dissected, RNA isolated using conventional methods and used for probing gene chips. The relatively large size of the chick embryo and ease of dissection make this readily achievable; however, it requires precise knowledge of the anatomy and developmental process. More recently, tissue specific promoters driving fluorescent proteins have been used to isolate specific cell populations by FACS sorting, which would otherwise be difficult to dissect [e.g., migrating heart precursors (Bento et al., 2011)]. In addition, linear amplification protocols in combination with microarray analysis (Chambers and Lumsden, 2008) reduce the amount of tissue required while maintaining reproducibility. While the use of microarrays has been successful to provide high-throughput transcriptome data, this technology also has limitations. These include to a lesser extent lack of comparability across platforms (Liu et al., 2012; Trachtenberg et al., 2012), but importantly the lack of quantitative information with low copy number transcripts often below detection level, and limitations due to the design of the array. In addition, the annotation of many of the chick genes represented in the arrays is fairly poor (Buza et al., 2009) with about 25% of probes still lacking annotations. Therefore, exploitation of the data to their full potential requires a substantial amount of analysis to identify corresponding transcripts reliably by computational tools; in our own experience even then 5–10% of the arrayed oligonucleotide probes on Affymetrix chips fail to identify corresponding genes. More recently, next generation sequencing RNAseq technology has been developed as an approach for transcriptome analysis. This involves the production of a cDNA library from fragmented Poly-A1 RNA, highthroughput sequencing with several uniquely tagged samples being sequenced in a single reaction and mapping of short reads to the reference genome. Although not yet as popular as microarrays, several studies have used this technology for gene discovery and transcriptome profiling in the chick (Li et al., 2012; Wang et al., 2011a,b; Wolf and Bryk, 2011). Unlike microarrays, RNAseq does not require prior knowledge of sequence information; thus, it can discover new transcripts. It is more sensitive than arrays and can provide quantitative information; RNAseq is, therefore, highly suitable to detect low-abundance transcripts. This is important for GRN construction because mRNAs encoding some transcription factors may be present in low amounts. In addition, it informs about the presence or absence of alternatively spliced forms and promoter usage. Overall, RNAseq, therefore, offers a more comprehensive view
5
of the transcriptome in specific cell populations. In chick, the major disadvantage is again the incomplete assembly of the chick genome, which can make it difficult to identify the corresponding genes. However, with a new release now being available (v 4.0; November 2011) and sequence information for different strains being released, RNAseq will become increasingly attractive in this fast moving field. With improved annotation, in the future technologies such as cap-analysis, gene expression (Kodzius et al., 2006; Takahashi et al., 2012) will allow not only the identification of the transcriptome, but also of all genes actively transcribed in a specific cell population by mapping the transcription start sites within promoters. This will be a major advance in network construction and analysis. The above approaches will generate a comprehensive gene list that defines the regulatory state of specific cell populations, i.e., the sum of all regulatory genes and their targets; this essentially provides the toolkit for network building. This knowledge is required for different time points during cell fate specification to give a dynamic view of development. However, as with all molecular screens, the design is critical to return transcripts relevant to the process, while excluding others that may play more general roles. While temporal information on gene expression is rapidly generated either by the methods described above or by qPCR, the acquisition of spatial expression data is more laborious, but absolutely required for successful GRN establishment. The expression of all network components should be validated by in situ hybridization. In addition, online resources like Geisha (Gallus Expression in Situ Hybridization Analysis, http://geisha.arizona.edu/geisha) and the echickatlas (http:// www.echickatlas.org/ecap/home.html) provide useful resources for expression data. This analysis will distinguish genes with ubiquitous, broad, mosaic, or cell population-specific expression and thus be invaluable to define the regulatory state. For example, although the presence of ubiquitous transcripts may be important, they may or may not provide any information that is specific for the developmental process. Together with temporal profiles, spatial resolution allows prediction of a genetic hierarchy and the assembly of a preliminary network as a testable model. ESTABLISHING A HIERARCHY: PERTURBATION EXPERIMENTS AND ANALYSIS OF NETWORK COMPONENTS While the precise knowledge of gene expression is critical for building a GRN, the regulatory interactions between network components must be determined by functional perturbation experiments. The aim of these experiments is to establish whether changes in the endogenous level of transcripts (loss- or gain-of-function)
6
STREIT ET AL.
FIG. 3. Gain- and loss-of-function experiments in chick embryos. (a) Exogenous DNA or oligonucleotides are transfected into chick embryos by electroporation. (b) eGFP was electroporated into the ectoderm of a primitive streak stage embryo. GFP fluorescence can first be detected about 3–4 h after electroporation. After overnight culture, the neural plate, the non-neural, and extraembryonic ectoderm carries the GFP construct. (c and d) Electroporation of a Pax2-specific morpholino (MO; green) (Mende et al., 2008) at primitive streak stages into otic precursors leads to loss of Pax2 protein (red) in electroporated cells. The images (c) and (d) show the left and right side of the same embryo, respectively. Note: only few cells carry Pax2 MO on the left hand side, whereas most are electroporated on the left-hand side; this leads to a change in placode morphology (Christophorou et al., 2010).
results in repression or activation of downstream targets. While targeted mutagenesis in chick is not established, in the last 10–15 years, transient transgenesis has become a routine technique. Importantly, the young chick embryo lends itself to temporally and spatially controlled knock-down and misexpression, thus allowing the perturbation of gene function at the appropriate time and in the tissue relevant to the process under investigation (see Fig. 3). This circumvents problems when genes have multiple functions at various time points in development. Below, we will briefly consider the many strategies available in the chick to perform such experiments in vivo and in explants in culture (Table 1). Although we focus on early events, with the availability of inducible constructs, of methods for transgene integration into the genome and tissue specific enhancers, similar strategies can be used to examine later processes. Many of the approaches described can be performed in the presence or absence of translation inhibitors to determine direct targets of a signal or transcription factor. Although transfection (Albazerchi et al., 2007; Geetha-Loganathan et al., 2011), sonoporation (Ohta et al., 2008), and retroviruses (Hou et al., 2011) have been used for transgenesis, electroporation is by far the most widespread method in early embryos used for transient misexpression and knock-down approaches in chick (Hatakeyama and Shimamura, 2008; Odani et al., 2008). For gene silencing, electroporation of small interfering RNAs and modified antisense oligonucleotides (morpholinos) are widely used, while dominant negative constructs interfering with endogenous protein function are useful tools, especially for probing the function of transcription factors and receptors.
Loss of Function Approaches Double-stranded RNAs (dsRNA) targeting the gene of interest provide a powerful gene silencing approach. Recently, a number of vectors have been designed that generate small interfering RNAs of 20–21 nucleotides, short hairpin RNAs or pre-miRNAs, which are processed into small dsRNAs by the cellular machinery to lead to sequence-specific target mRNA degradation (Bron et al., 2004; Das et al., 2006; Hu et al., 2002; Katahira and Nakamura, 2003; for review: Hou et al., 2011; SaukaSpengler and Barembaum, 2008). Some of these vectors also contain fluorescent proteins allowing easy detection of cells carrying the transgene. The main advantage of this strategy as compared to morpholinos is the unlimited supply of plasmid and importantly that gene knock-down can be verified by in situ hybridization. However, nonspecific effects including activation and loss of unrelated transcripts have been reported in particular in young chick embryos (Mende et al., 2008) demonstrating the critical importance of appropriate controls (see below). Antisense morpholinos provide a good alternative, especially for early embryos, and result in reproducible and reliable gene inactivation (Basch et al., 2006; Christophorou et al., 2010; Kos et al., 2003; Mende et al., 2008; Sheng et al., 2003; Strobl-Mazzulla et al., 2010; Voiculescu et al., 2008). Antisense morpholinos target either the translation start site to interfere with the initiation complex or splice junctions resulting in exon deletion or intron inclusion. If appropriately designed, the latter generate truncated proteins by introducing premature stop codons. For translation blocking morpholinos, knock-down efficiency must be determined by anti-
GENE REGULATORY NETWORK CONSTRUCTION
body staining, which may be difficult as often specific antibodies are not available. In case of splice-blocking morpholinos, the efficiency is assessed by RT-PCR. In addition, we have recently adapted morpholino-mediated knock-down for tissue explants using the Endoporter system (GeneTools) for delivery; like in vivo, this strategy generates efficient and reliable knock-down in particular as the tissue can be cultured in the presence of morpholinos. Both dsRNA and morpholino approaches require careful controls for off-target, nonspecific effects, for knock-down specificity, and in case of morpholinos, for toxicity. Standard control morpholinos serve as general controls (toxicity, electroporation), whereas 6 base pair mismatched morpholinos or dsRNAs should control for off-target effects. Ideally, two different antisense oligonucleotides with distinct target sites should be used as well as appropriate rescue experiments by co-electroporation of expression constructs that lack the target sequence or by downstream targets. Thus, each knockdown strategy must be carefully controlled before it can be used to determine the epistatic relationship among the components of GRNs. Once this is achieved, electroporated tissues can be collected to assess the changes in endogenous levels of network components using different strategies. Dominant-Negative Constructs, Constitutive Repressor and Activator Forms The use of inhibitory or constitutively active forms of proteins, or fusion proteins that generate constitutive active or repressing transcription factors may also be informative to determine the genetic hierarchy within a gene network. Dominant negative constructs generate mutated proteins, which compete with endogenous proteins expressed in the same cell, whereas constitutively active proteins generally contain mutations that mimic their active state (e.g., phosphorylation). This strategy has been widely used to interfere, e.g., with signaling pathways by constructing receptors that lack intracellular domains or are active in the absence of ligand, or by providing constitutively active downstream mediators (Bobak et al., 2009; Linker and Stern, 2004; Suzuki et al., 1994; Suzuki-Hirano et al., 2005; Timmer et al., 2002), or to interfere with transcription factor function by deleting either the DNA binding or trans-activating domains, but leaving protein interaction domains intact (Cossais et al., 2010; Rallis et al., 2003). In addition, transcription factors are turned into constitutive repressors or activators by fusing their DNA binding domain to repressors domains like the engrailed repressor or activator domains like VP16 or E1A (BelVialar et al., 2002; Christophorou et al., 2009; Glavic et al., 2002; Hollenberg et al., 1993; Horb and Thomsen, 1999; Kolm and Sive, 1995; Li et al., 2009; Steven-
7
ton et al., 2012; Wheeler and Liu, 2012). The latter are particularly useful for transcription factors that recruit either co-repressors or co-activators depending on the cellular context. In this case, comparison with misexpression of wild type forms can determine whether changes of downstream targets are due to repression or activation by the factor under investigation. These approaches have been very successful in other organisms, but have recently also been used in the chick. As for knock-down approaches, careful controls must be designed to ensure specificity and test for off-target effects. In particular, because inhibitory constructs act by competition with endogenous proteins, they largely depend on overexpression at nonendogenous levels. This frequently leads to mislocalization within the cell (e.g., signaling second messengers, transcription factors, and co-factors whose nuclear localization is normally tightly controlled may become constitutively nuclear when overexpressed), or participation in nonspecific protein–protein interactions (e.g., constitutively active and dominant negative receptors may bind nonspecifically to co-receptors), which in turn may trigger unintended and off-target perturbations. Gain-of-Function Approaches Mis- or over-expression strategies are well established in the chick. As discussed above, electroporation is the method of choice to generate transient expression of DNA constructs and assess their effect on network components. Different vectors are currently available; for ubiquitous transgene expression, most vectors use a CMV immediate early enhancer and the chick b-actin promoter and some contain an internal ribosomal entry site followed by GFP or RFP to allow easy tracking of electroporated cells (Ishii and Mikawa, 2005; Itasaki et al., 1999; Nakamura et al., 2004; Odani et al., 2008; Voiculescu et al., 2008). More recently, new vectors were developed using Tol2 transposon-mediated gene transfer for stable integration into the genome; combined with tetracyclineinducible expression and inducible or tissue specific Cre/ loxP systems, misexpression can be achieved in a tissuespecific manner at the desired time (Sato et al., 2007; Takahashi et al., 2008; Yokota et al., 2011). Together, these approaches are powerful tools to perform gain-offunction experiments in a wide variety of tissues in a temporally and spatially controlled manner. Measuring Changes in Gene Expression One of the most critical steps to elucidate the network architecture is to monitor changes in gene expression after perturbation experiments. Although qualitative methods like in situ hybridization may provide important, often critical information (especially for when complex spatial changes of expression occur), they are unlikely to detect subtle changes and are impractical for
8
STREIT ET AL.
large networks with many components. Therefore, quantitative or semi-quantitative methods are required, which ideally allow measuring many transcripts in the same sample. With the development of sensitive methods, it has become possible to use small tissue samples like single embryos, electroporated tissue dissected from embryos or few explants for quantitative analysis of gene expression (Strobl-Mazzulla et al., 2010; Taneyhill and Bronner-Fraser, 2005). To evaluate the effects of gene knock down or overexpression, samples from control and experimental tissues are compared. Currently, two main approaches have been used to determine mRNA levels for network analysis, quantitative real-time PCR (qPCR) and NanoString nCounter. qPCR is widely used providing a reliable, sensitive, and kinetic approach to evaluate changes of gene expression after experimental perturbation. After cDNA synthesis, qPCR uses fluorescent dyes or probes that bind double-stranded DNA to quantify the increase in specific PCR products during the exponential phase of amplification. Internal standards serve as controls for data normalization and the ratio of control to experimental values determines the fold change. Thus, qPCR detects repression and activation of network components after experimental perturbation. While qPCR is a powerful method to quantify transcripts, it is laborious if a large number of network components are to be analyzed. NanoString nCounter alleviates this problem providing a multiplex strategy for sensitive quantification of up to 500 transcripts in a single sample (Geiss et al., 2008; Malkov et al., 2009). NanoString is a hybridization-based technique that uses two target specific short oligonucleotide probes: one capture probe to bind the hybridized RNA to a solid surface and a reporter probe tagged with a unique barcode of fluorescent dyes. The combinatorial use of different fluorescent tags allows the detection of large numbers of transcripts in a sample. Captured samples are analyzed by a fluorescent microscope, which counts the number of times each bar code is detected. Standard probe sets contain positive and negative controls, as well as housekeeping genes for normalization of the data in addition to all regulatory genes that characterize the network. Like qPCR, NanoString provides quantitative information about the changes in gene expression after perturbation by comparing control and experimental conditions. Both approaches generate highly reproducible results with equal fidelity (Materna et al., 2010). However, NanoString has the advantage that a large number of transcripts can be analyzed simultaneously thus simplifying the analysis of complex networks considerably. In the future, with continuously improving methods and decreasing prices, RNAseq may become the method of choice to analyze perturbation experiments.
ENHANCER DISCOVERY AND VALIDATION OF PREDICTED INTERACTIONS For a complete GRN that models specific processes during development ideally, each edge within a network will require experimental validation. Although perturbation analysis provides critical information about the network architecture, it cannot distinguish which of the interactions are direct. Ultimately, this requires the identification of cis-regulatory elements that integrate transcriptional inputs as well as their interacting transcription factors. In the first instance, perturbation experiments will point to important nodes in the network, and thus, highlight candidates for which such cis-regulatory analysis is high priority. In addition, different clustering algorithms such as hierarchical, K-means and selforganizing maps (Johnson, 1967; Kohonen, 1990; MacQueen, 1967) can be used on multiple datasets (e.g., NanoString data) to identify small groups of co-regulated genes, which may share some transcriptional input. Computational methods and sequence alignment must then be used to predict putative enhancer regions for individual genes, but also to discover shared motifs among co-regulated transcripts (see Khan et al., 2012). One major challenge is to predict the most likely cisregulatory modules (CRMs) that control gene expression in the tissue or cells of interest; a workflow to achieve this is described by Khan et al. (2012) in this issue. This is critical since currently the major bottleneck to verify connections is the slow process of validating CRM activity in vivo including analysis and experimental verification of interacting transcription factors. This seems like an impossible task, however, in recent years, the chick has proven to be an excellent system to perform such analysis rapidly as illustrated by the pioneering work of the Kondoh group (Inoue et al., 2007; Kondoh and Uchikawa, 2008; Matsumata et al., 2005; Saigou et al., 2010; Uchikawa et al., 2003). Appropriate reporter vectors have been designed that allow rapid cloning of putative CRMs to drive the expression of fluorescent proteins like YFP, GFP, RFP, cherry, or cerulian. These constructs are electroporated into large regions of the chick embryo together with an ubiquitously expressed fluorescent protein to control for electroporation efficiency and specificity of the putative CRM (Fig. 4). This strategy allows the evaluation of a relatively large number of enhancers at reasonable cost and in a relatively short time. This strategy has been very successful in recent years to identify active enhancers that control gene expression in specific tissues (Barembaum and Bronner-Fraser, 2010; Betancur et al., 2010b, 2011; Iwafuchi-Doi et al., 2011; Neves et al., 2012; Prasad and Paulson, 2011; Sato et al., 2010, 2012; Strobl-Mazzulla et al., 2010). However, in the future, the development of multiplex strategies for CRM validation will greatly speed up this process. Currently,
GENE REGULATORY NETWORK CONSTRUCTION
9
a multiplex approach is used in the sea urchin that allows testing of 100 CRMs in a single experiment (Nam and Davidson, 2012); however, this strategy is not directly applicable to the chick system. Once identified, active CRMs are analyzed computationally for the presence of transcription factor binding sites (Khan et al., 2012). While this analysis is likely to return a large number of possible binding factors or simply families of transcription factors, good candidates are those genes identified by microarrays or RNAseq (see above) to be present in the tissue of interest. Subsequent experiments will need to verify the interaction of such candidates with the CRM and whether this interaction is necessary for CRM activity. Traditionally, electromobility shift assays have been used to show physical protein–DNA interactions in vitro. However, more recently, ChIP for small tissue samples (micro-ChIP), coupled with qPCR, has been used successfully to confirm transcription factor binding to specific enhancer regions in vivo. Finally, mutagenesis of transcription factor binding sites within the CRM as well as knock down of the appropriate transcription factor are critical to demonstrate the requirement of the interaction for CRM function. While the above strategy is likely to identify active CRMs, the question remains of whether these are truly the active enhancers that control expression of the gene of interest in vivo. Ultimately, this issue needs to be resolved using transgenic approaches in other species where the CRM is modified or deleted from its normal location in the genome. PUTTING IT ALL TOGETHER: ASSEMBLING A NETWORK
FIG. 4. Testing enhancer activity in chick embryos. (a) Diagram showing the GFP-reporter construct containing the putative enhancer, a minimal TK promoter and eGFP; RPF is driven by chick b-actin and CMV promoter. Embryos are electroporated at primitive streak stages and cultured until they have reached the stage when enhancer activity is expected. (b–e) The embryo was electroporated at primitive streak stages with ubiquitous RFP and GFP driven by an otic Eya1 enhancer (Ishihara et al., 2008). After overnight culture, the embryo has reached the 13-somite stage and shows enhancer activity in the otic placode (b) bright field image. (c) RFP expression is wide spread. (d) GFP is specifically expressed in the otic placode. (e) Overlay of bright field and GFP image. White circles indicate the otic placode. mb, midbrain; hb, hindbrain, ov, optic vesicle; som, somite.
As discussed above, temporal and spatial analysis of network components allows the assembly of a preliminary network as a working model. The perturbation experiments combined with quantification of the expression of all network components will establish a genetic hierarchy, define upstream regulators and targets, and point to key nodes within the network. In short, the approaches will reveal information about the network architecture. However, establishing the GRN is an iterative process with each iteration refining the network further. Ideally, experimental manipulations should be performed as time course experiments and in the presence of translation inhibitors, which will indicate dynamic changes and help to distinguish direct from indirect interactions. However, only the combination of perturbation experiments with identification of cis-regulatory elements that control gene expression and their interacting transcription factors will provide the necessary evidence. One of the key challenges, however, is to organize the data generated and to incorporate them into a logi-
10
STREIT ET AL.
Table 1 Summary of Perturbation Experiments as Described in the Text Morpholino Small interfering RNA (siRNA) Misexpression Dominant negative forms of TFs, receptors Constitutive activator or repressor forms of TFs
MOs complementary to the transcription start site block translation; MOs complementary to splice junctions result in exon deletion or intron inclusion RNA degradation Ectopic expression of the gene of interest by electroporation or transfection; grafting beads or transfected cells for signaling molecules Expression of genes that lack a critical domain (e.g., intracellular domain of receptor, co-factor binding domain of TF) and interferes with endogenous proteins Expression of TF-fusion constructs where the DNAbinding domain is fused to a constitutive repressor (e.g., EnR) or activator (VP16, E1A)
cal network. The available networks for sea urchin endo- and meso-derm specification provide an excellent example for data organization in interaction tables combined with gene expression data in the embryo (Davidson et al., 2002; Peter and Davidson, 2011b, see: http://sugp.caltech.edu/endomes/index.html). In addition, computational tools are indispensible for network assembly. Our favorite program is BioTapestry (http:// www.biotapestry.org/), because it allows easy navigation between different regions (regulatory states) and times, as well as the ability to follow genetic interactions. BioTapestry was specifically designed for GNR visualization, but also integrates perturbation data, suggests alternative models and helps with data interpretation by pointing to critical interactions to be tested (Longabaugh et al., 2005, 2009). Programs like BioTapestry allow the organization of complex data sets into logical circuits and are thus essential for network construction. In addition, new computational approaches for inferring GRNs are emerging continuously. These approaches allow the reconstruction of networks from complex high-throughput data and are powerful tools to predict hubs and interactions within a network, which can then be tested experimentally (Basso et al., 2005; Hartemink, 2005; Werhli et al., 2006). CONCLUSIONS The chick has been an embryological model system for hundreds of years and thus provides a wealth of information. Many developmental processes have been described in detail and particularly its slow development has made it possible to dissect their timing. Combined with the ease of experimental manipulation, the availability of the chick genome, advances in adapting molecular methods, and medium- to high-throughput gene expression analysis, and the design of new vectors have now made the chick a most attractive model to construct GRNs. In depth, understanding of the biology
Basch et al., 2006; Christophorou et al., 2010; Kos et al., 2003; Mende et al., 2008; Sheng et al., 2003; Strobl-Mazzulla et al., 2010; Voiculescu et al., 2008 Bron et al., 2004; Das et al., 2006; Hu et al., 2002; Katahira and Nakamura, 2003 Nakamura et al., 2004 Bobak et al., 2009; Cossais et al., 2010; Linker and Stern, 2004; Rallis et al., 2003; Suzuki et al., 1994; Suzuki-Hirano et al., 2005; Timmer et al., 2002 Bel-Vialar et al., 2002; Christophorou et al., 2009; Glavic et al., 2002; Hollenberg et al., 1993; Horb and Thomsen, 1999; Kolm and Sive, 1995; Li et al., 2009; Steventon et al., 2012; Wheeler and Liu, 2012
remains key to design appropriate molecular screens, identify network components, and their epistatic relationship. Computational methods for CRM and insulator prediction, data analysis, and network inference complement the experimental approaches and together provide a powerful strategy for network construction. ACKNOWLEDGMENTS We thank all members of the Streit lab for useful discussions. This work is funded by the BBSRC and Deafness Research UK. LITERATURE CITED Albazerchi A, Cinquin O, Stern CD. 2007. A new method to transfect the hypoblast of the chick embryo reveals conservation of the regulation of an Otx2 enhancer between mouse and chick extraembryonic endoderm. BMC Dev Biol 7:25. Alev C, Wu Y, Kasukawa T, Jakt LM, Ueda HR, Sheng G. 2010. Transcriptomic landscape of the primitive streak. Development 137:2863–2874. Amore G, Casares F. 2010. Size matters: The contribution of cell proliferation to the progression of the specification Drosophila eye gene regulatory network. Dev Biol 344:569–577. Antin PB, Konieczka JH. 2005. Genomic resources for chicken. Dev Dyn 232:877–882. Balaskas N, Ribeiro A, Panovska J, Dessaud E, Sasai N, Page KM, Briscoe J, Ribes V. 2012. Gene regulatory logic for reading the sonic hedgehog signaling gradient in the vertebrate neural tube. Cell 148:273– 284. Bangs F, Welten M, Davey MG, Fisher M, Yin Y, Downie H, Paton B, Baldock R, Burt DW, Tickle C. 2010. Identification of genes downstream of the Shh signalling in the developing chick wing and synexpressed with Hoxd13 using microarray and 3D computational analysis. Mech Dev 127:428–441.
GENE REGULATORY NETWORK CONSTRUCTION
Barembaum M, Bronner-Fraser M. 2010. Pax2 and Pea3 synergize to activate a novel regulatory enhancer for spalt4 in the developing ear. Dev Biol 340: 222–231. Basch ML, Bronner-Fraser M, Garcia-Castro MI. 2006. Specification of the neural crest occurs during gastrulation and requires Pax7. Nature 441:218–222. Basso K, Margolin AA, Stolovitzky G, Klein U, DallaFavera R, Califano A. 2005. Reverse engineering of regulatory networks in human B cells. Nat Genet 37:382–390. Bel-Vialar S, Itasaki N, Krumlauf R. 2002. Initiating Hox gene expression: In the early chick neural tube differential sensitivity to FGF and RA signaling subdivides the HoxB genes in two distinct groups. Development 129:5103–5115. Bento M, Correia E, Tavares AT, Becker JD, Belo JA. 2011. Identification of differentially expressed genes in the heart precursor cells of the chick embryo. Gene Expr Patterns 11:437–447. Betancur P, Bronner-Fraser M, Sauka-Spengler T. 2010a. Assembling neural crest regulatory circuits into a gene regulatory network. Annu Rev Cell Dev Biol 26:581–603. Betancur P, Bronner-Fraser M, Sauka-Spengler T. 2010b. Genomic code for Sox10 activation reveals a key regulatory enhancer for cranial neural crest. Proc Natl Acad Sci USA 107:3570–3575. Betancur P, Sauka-Spengler T, Bronner M. 2011. A Sox10 enhancer element common to the otic placode and neural crest is activated by tissue-specific paralogs. Development 138:3689–3698. Bobak N, Agoston Z, Schulte D. 2009. Evidence against involvement of BMP receptor 1b signaling in fate specification of the chick mesencephalic alar plate at HH16. Neurosci Lett 461:223–228. Bron R, Eickholt BJ, Vermeren M, Fragale N, Cohen J. 2004. Functional knockdown of neuropilin-1 in the developing chick nervous system by siRNA hairpins phenocopies genetic ablation in the mouse. Dev Dyn 230:299–308. Buchtova M, Kuo WP, Nimmagadda S, Benson SL, Geetha-Loganathan P, Logan C, Au-Yeung T, Chiang E, Fu K, Richman JM. 2010. Whole genome microarray analysis of chicken embryo facial prominences. Dev Dyn 239:574–591. Buza TJ, Kumar R, Gresham CR, Burgess SC, McCarthy FM. 2009. Facilitating functional annotation of chicken microarray data. BMC Bioinformatics 10 (Suppl 11):S2. Chambers D, Lumsden A. 2008. Profiling gene transcription in the developing embryo: Microarray analysis on gene chips. Methods Mol Biol 461:631–655. Christophorou NA, Bailey AP, Hanson S, Streit A. 2009. Activation of Six1 target genes is required for sensory placode formation. Dev Biol 336:327–336.
11
Christophorou NA, Mende M, Lleras-Forero L, Grocott T, Streit A. 2010. Pax2 coordinates epithelial morphogenesis and cell fate in the inner ear. Dev Biol 345:180–190. Cossais F, Wahlbuhl M, Kriesch J, Wegner M. 2010. SOX10 structure-function analysis in the chicken neural tube reveals important insights into its role in human neurocristopathies. Hum Mol Genet 19:2409–2420. Cripps RM, Olson EN. 2002. Control of cardiac development by an evolutionarily conserved transcriptional network. Dev Biol 246:14–28. Cruz C, Ribes V, Kutejova E, Cayuso J, Lawson V, Norris D, Stevens J, Davey M, Blight K, Bangs F, Mynett A, Hirst E, Chung R, Balaskas N, Brody SL, Marti E, Briscoe J. 2010. Foxj1 regulates floor plate cilia architecture and modifies the response of cells to sonic hedgehog signalling. Development 137:4271–4282. Das RM, Van Hateren NJ, Howell GR, Farrell ER, Bangs FK, Porteous VC, Manning EM, McGrew MJ, Ohyama K, Sacco MA, Halley PA, Sang HM, Storey KG, Placzek M, Tickle C, Nair VK, Wilson SA. 2006. A robust system for RNA interference in the chicken using a modified microRNA operon. Dev Biol 294:554–563. Davidson EH. 2006. The regulatory genome: Gene regulatory networks in development and evolution. San Diego, USA: Academic Press. Davidson EH. 2009. Network design principles from the sea urchin embryo. Curr Opin Genet Dev 19:535– 540. Davidson EH. 2010. Emerging properties of animal gene regulatory networks. Nature 468:911–920. Davidson EH. 2011. Evolutionary bioscience as regulatory systems biology. Dev Biol 357:35–40. Davidson EH, Rast JP, Oliveri P, Ransick A, Calestani C, Yuh CH, Minokawa T, Amore G, Hinman V, ArenasMena C, Otim O, Brown CT, Livi CB, Lee PY, Revilla R, Schilstra MJ, Clarke PJ, Rust AG, Pan Z, Arnone MI, Rowen L, Cameron RA, McClay DR, Hood L, Bolouri H. 2002. A provisional regulatory gene network for specification of endomesoderm in the sea urchin embryo. Dev Biol 246:162–190. Friedrich M. 2006. Ancient mechanisms of visual sense organ development based on comparison of the gene networks controlling larval eye, ocellus, and compound eye specification in Drosophila. Arthropod Struct Dev 35:357–378. Geetha-Loganathan P, Nimmagadda S, Hafez I, Fu K, Cullis PR, Richman JM. 2011. Development of highconcentration lipoplexes for in vivo gene function studies in vertebrate embryos. Dev Dyn 240:2108– 2119. Geiss GK, Bumgarner RE, Birditt B, Dahl T, Dowidar N, Dunaway DL, Fell HP, Ferree S, George RD, Grogan T, James JJ, Maysuria M, Mitton JD, Oliveri P, Osborn
12
STREIT ET AL.
JL, Peng T, Ratcliffe AL, Webster PJ, Davidson EH, Hood L, Dimitrov K. 2008. Direct multiplexed measurement of gene expression with color-coded probe pairs. Nat Biotechnol 26:317–325. Glavic A, Gomez-Skarmeta JL, Mayor R. 2002. The homeoprotein Xiro1 is required for midbrain-hindbrain boundary formation. Development 129:1609– 1621. Grocott T, Tambalo M, Streit A. 2012. The peripheral sensory nervous system in the vertebrate head: A gene regulatory perspective. Dev Biol 370:3–23. Handrigan GR, Buchtova M, Richman JM. 2007. Gene discovery in craniofacial development and disease— Cashing in your chips. Clin Genet 71:109–119. Hardy KM, Yatskievych TA, Konieczka J, Bobbs AS, Antin PB. 2011. FGF signalling through RAS/MAPK and PI3K pathways regulates cell movement and gene expression in the chicken primitive streak without affecting E-cadherin expression. BMC Dev Biol 11:20. Hartemink AJ. 2005. Reverse engineering gene regulatory networks. Nat Biotechnol 23:554–555. Hatakeyama J, Shimamura K. 2008. Method for electroporation for the early chick embryo. Dev Growth Differ 50:449–452. Hinman VF, Davidson EH. 2007. Evolutionary plasticity of developmental gene regulatory network architecture. Proc Natl Acad Sci USA 104:19404–19409. Hollenberg SM, Cheng PF, Weintraub H. 1993. Use of a conditional MyoD transcription factor in studies of MyoD trans-activation and muscle determination. Proc Natl Acad Sci USA 90:8028–8032. Horb ME, Thomsen GH. 1999. Tbx5 is essential for heart development. Development 126:1739–1751. Hou X, Omi M, Harada H, Ishii S, Takahashi Y, Nakamura H. 2011. Conditional knockdown of target gene expression by tetracycline regulated transcription of double strand RNA. Dev Growth Differ 53:69–75. Hu WY, Myers CP, Kilzer JM, Pfaff SL, Bushman FD. 2002. Inhibition of retroviral pathogenesis by RNA interference. Curr Biol 12:1301–1311. Imai KS, Stolfi A, Levine M, Satou Y. 2009. Gene regulatory networks underlying the compartmentalization of the Ciona central nervous system. Development 136:285–293. Inoue M, Kamachi Y, Matsunami H, Imada K, Uchikawa M, Kondoh H. 2007. PAX6 and SOX2-dependent regulation of the Sox2 enhancer N-3 involved in embryonic visual system development. Genes Cells 12:1049–1061. Ishii Y, Mikawa T. 2005. Somatic transgenesis in the avian model system. Birth Defects Res C Embryo Today 75:19–27. Itasaki N, Bel-Vialar S, Krumlauf R. 1999. ‘Shocking’ developments in chick embryology: Electroporation and in ovo gene expression. Nat Cell Biol 1:E203–E207.
Iwafuchi-Doi M, Yoshida Y, Onichtchouk D, Leichsenring M, Driever W, Takemoto T, Uchikawa M, Kamachi Y, Kondoh H. 2011. The Pou5f1/Pou3f-dependent but SoxB-independent regulation of conserved enhancer N2 initiates Sox2 expression during epiblast to neural plate stages in vertebrates. Dev Biol 352:354–366. Johnson SC. 1967. Hierarchical clustering schemes. Psychometrika 32:241–254. Katahira T, Nakamura H. 2003. Gene silencing in chick embryos with a vector-based small interfering RNA system. Dev Growth Differ 45:361–367. Khan MAF, Soto-Jiminez LM, Howe T, Streit A, Sosinsky A, Stern CD. 2012. Computational tools and resources for prediction and analysis of gene regulatory regions in the chick genome. Genesis. Kimura W, Alev C, Sheng G, Jakt M, Yasugi S, Fukuda K. 2011. Identification of region-specific genes in the early chicken endoderm. Gene Expr Patterns 11:171–180. Kodzius R, Kojima M, Nishiyori H, Nakamura M, Fukuda S, Tagami M, Sasaki D, Imamura K, Kai C, Harbers M, Hayashizaki Y, Carninci P. 2006. CAGE: Cap analysis of gene expression. Nat Methods 3:211–222. Kohonen T. 1990. The self-organizing map. Proc IEEE 78:1464–1480. Koide T, Hayata T, Cho KW. 2005. Xenopus as a model system to study transcriptional regulatory networks. Proc Natl Acad Sci USA 102:4943–4948. Kolm PJ, Sive HL. 1995. Efficient hormone-inducible protein function in Xenopus laevis. Dev Biol 171:267–272. Kondoh H, Uchikawa M. 2008. Dissection of chick genomic regulatory regions. Methods Cell Biol 87:313–336. Kos R, Tucker RP, Hall R, Duong TD, Erickson CA. 2003. Methods for introducing morpholinos into the chicken embryo. Dev Dyn 226:470–477. Kulesa PM, Bailey CM, Cooper C, Fraser SE. 2010. In ovo live imaging of avian embryos. Cold Spring Harb Protoc 2010:pdb.prot5446. Kumar JP. 2010. Retinal determination the beginning of eye development. Curr Top Dev Biol 93:1–28. Levine M, Davidson EH. 2005. Gene regulatory networks for development. Proc Natl Acad Sci USA 102:4936–4942. Li B, Kuriyama S, Moreno M, Mayor R. 2009. The posteriorizing gene Gbx2 is a direct target of Wnt signalling and the earliest factor in neural crest induction. Development 136:3267–3278. Li E, Davidson EH. 2009. Building developmental gene regulatory networks. Birth Defects Res C Embryo Today 87:123–130. Li T, Wang S, Wu R, Zhou X, Zhu D, Zhang Y. 2012. Identification of long non-protein coding RNAs in chicken skeletal muscle using next generation sequencing. Genomics 99:292–298.
GENE REGULATORY NETWORK CONSTRUCTION
Linker C, Stern CD. 2004. Neural induction requires BMP inhibition only as a late step, and involves signals other than FGF and Wnt antagonists. Development 131:5671–5681. Liu F, Kuo WP, Jenssen TK, Hovig E. 2012. Performance comparison of multiple microarray platforms for gene expression profiling. Methods Mol Biol 802:141–155. Longabaugh WJ, Davidson EH, Bolouri H. 2005. Computational representation of developmental genetic regulatory networks. Dev Biol 283:1–16. Longabaugh WJ, Davidson EH, Bolouri H. 2009. Visualization, documentation, analysis, and communication of large-scale gene regulatory networks. Biochim Biophys Acta 1789:363–374. Loose M, Patient R. 2004. A genetic regulatory network for Xenopus mesendoderm formation. Dev Biol 271:467–478. MacQueen JB. 1967. Some methods for classification and analysis of multivariate observations. In: Proceedings of the Fifth Symposium on Math, Statistics, and Probablity. Berkley, CA: University of California Press. pp 281–297. Malkov VA, Serikawa KA, Balantac N, Watters J, Geiss G, Mashadi-Hossein A, Fare T. 2009. Multiplexed measurements of gene signatures in different analytes using the Nanostring nCounter Assay System. BMC Res Notes 2:80. Materna SC, Nam J, Davidson EH. 2010. High accuracy, high-resolution prevalence measurement for the majority of locally expressed regulatory genes in early sea urchin development. Gene Expr Patterns 10:177–184. Matsumata M, Uchikawa M, Kamachi Y, Kondoh H. 2005. Multiple N-cadherin enhancers identified by systematic functional screening indicate its Group B1 SOX-dependent regulation in neural and placodal development. Dev Biol 286:601–617. Mende M, Christophorou NA, Streit A. 2008. Specific and effective gene knock-down in early chick embryos using morpholinos but not pRFPRNAi vectors. Mech Dev 125:947–962. Monteiro A. 2012. Gene regulatory networks reused to build novel traits: Co-option of an eye-related gene regulatory network in eye-like organs and red wing patches on insect wings is suggested by optix expression. Bioessays 34:181–186. Morley RH, Lachani K, Keefe D, Gilchrist MJ, Flicek P, Smith JC, Wardle FC. 2009. A gene regulatory network directed by zebrafish No tail accounts for its roles in mesoderm formation. Proc Natl Acad Sci USA 106:3829–3834. Nakamura H, Katahira T, Sato T, Watanabe Y, Funahashi J. 2004. Gain- and loss-of-function in chick embryos by electroporation. Mech Dev 121:1137– 1143.
13
Nam J, Davidson EH. 2012. Barcoded DNA-tag reporters for multiplex cis-regulatory analysis. PLoS One 7:e35934. Nasiadka A, Dietrich BH, Krause HM. 2002. Anteriorposterior patterning in the Drosophila embryo. In: Melvin LD, editor. Advances in developmental biology and biochemistry. Elsevier. pp 155–204. Neves J, Uchikawa M, Bigas A, Giraldez F. 2012. The prosensory function of Sox2 in the chicken inner ear relies on the direct regulation of Atoh1. PLoS One 7:e30871. Odani N, Ito K, Nakamura H. 2008. Electroporation as an efficient method of gene transfer. Dev Growth Differ 50:443–448. Ohta S, Suzuki K, Ogino Y, Miyagawa S, Murashima A, Matsumaru D, Yamada G. 2008. Gene transduction by sonoporation. Dev Growth Differ 50:517–520. Oliveri P, Carrick DM, Davidson EH. 2002. A regulatory gene network that directs micromere specification in the sea urchin embryo. Dev Biol 246:209–228. Paxton CN, Bleyl SB, Chapman SC, Schoenwolf GC. 2010. Identification of differentially expressed genes in early inner ear development. Gene Expr Patterns 10:31–43. Peter IS, Davidson EH. 2011a. Evolution of gene regulatory networks controlling body plan development. Cell 144:970–985. Peter IS, Davidson EH. 2011b. A gene regulatory network controlling the embryonic specification of endoderm. Nature 474:635–639. Pourquie´ O. 2004. The chick embryo: A leading model in somitogenesis studies. Mech Dev 121: 1069–1079. Prasad MS, Paulson AF. 2011. A combination of enhancer/silencer modules regulates spatially restricted expression of cadherin-7 in neural epithelium. Dev Dyn 240:1756–1768. Rallis C, Bruneau BG, Del Buono J, Seidman CE, Seidman JG, Nissim S, Tabin CJ, Logan MP. 2003. Tbx5 is required for forelimb bud formation and continued outgrowth. Development 130:2741–2751. Revilla-i-Domingo R, Oliveri P, Davidson EH. 2007. A missing link in the sea urchin embryo gene regulatory network: hesC and the double-negative specification of micromeres. Proc Natl Acad Sci USA 104:12383–12388. Ribes V, Briscoe J. 2009. Establishing and interpreting graded sonic hedgehog signaling during vertebrate neural tube patterning: The role of negative feedback. Cold Spring Harb Persp Biol 1:a002014. Rupp PA, Kulesa PM. 2007. A role for RhoA in the twophase migratory pattern of post-otic neural crest cells. Dev Biol 311:159–171. Saigou Y, Kamimura Y, Inoue M, Kondoh H, Uchikawa M. 2010. Regulation of Sox2 in the pre-placodal cephalic ectoderm and central nervous system by enhancer N-4. Dev Growth Differ 52:397–408.
14
STREIT ET AL.
Sato S, Ikeda K, Shioi G, Nakao K, Yajima H, Kawakami K. 2012. Regulation of Six1 expression by evolutionarily conserved enhancers in tetrapods. Dev Biol 368:95–108. Sato S, Ikeda K, Shioi G, Ochi H, Ogino H, Yajima H, Kawakami K. 2010. Conserved expression of mouse Six1 in the pre-placodal region (PPR) and identification of an enhancer for the rostral PPR. Dev Biol 344:158–171. Sato Y, Kasai T, Nakagawa S, Tanabe K, Watanabe T, Kawakami K, Takahashi Y. 2007. Stable integration and conditional expression of electroporated transgenes in chicken embryos. Dev Biol 305:616– 624. Sauka-Spengler T, Barembaum M. 2008. Gain- and lossof-function approaches in the chick embryo. Methods Cell Biol 87:237–256. Sauka-Spengler T, Bronner-Fraser M. 2008. A gene regulatory network orchestrates neural crest formation. Nat Rev Mol Cell Biol 9:557–568. Sheng G, dos Reis M, Stern CD. 2003. Churchill, a zinc finger transcriptional activator, regulates the transition between gastrulation and neurulation. Cell 115:603–613. Stern CD. 2005a. The chick; a great model system becomes even greater. Dev Cell 8:9–17. Stern CD. 2005b. Neural induction: Old problem, new findings, yet more questions. Development 132:2007–2021. Steventon B, Mayor R, Streit A. 2012. Mutual repression between Gbx2 and Otx2 in sensory placodes reveals a general mechanism for ectodermal patterning. Dev Biol 367:55–65. Streit A. 2008.The cranial sensory nervous system: Specification of sensory progenitors and placodes. StemBook, ed. The Stem Cell Research Community, StemBook, doi/10.3824/stembook.1.31.1, http:// www.stembook.org Strobl-Mazzulla PH, Sauka-Spengler T, Bronner-Fraser M. 2010. Histone demethylase JmjD2A regulates neural crest specification. Dev Cell 19:460–468. Suzuki A, Thies RS, Yamaji N, Song JJ, Wozney JM, Murakami K, Ueno N. 1994. A truncated bone morphogenetic protein receptor affects dorsal-ventral patterning in the early Xenopus embryo. Proc Natl Acad Sci USA 91:10255–10259. Suzuki-Hirano A, Sato T, Nakamura H. 2005. Regulation of isthmic Fgf8 signal by sprouty2. Development 132:257–265. Takahashi H, Kato S, Murata M, Carninci P. 2012. CAGE (cap analysis of gene expression): A protocol for the detection of promoter and transcriptional networks. Methods Mol Biol 786:181–200. Takahashi Y, Watanabe T, Nakagawa S, Kawakami K, Sato Y. 2008. Transposon-mediated stable integration and tetracycline-inducible expression of elec-
troporated transgenes in chicken embryos. Methods Cell Biol 87:271–280. Taneyhill LA, Bronner-Fraser M. 2005. Dynamic alterations in gene expression after Wnt-mediated induction of avian neural crest. Mol Biol Cell 16:5283–5293. Timmer JR, Wang C, Niswander L. 2002. BMP signaling patterns the dorsal and intermediate neural tube via regulation of homeobox and helix-loop-helix transcription factors. Development 129:2459–2472. Towers M, Tickle C. 2009. Generation of pattern and form in the developing limb. Int J Dev Biol 53:805–812. Trachtenberg AJ, Robert JH, Abdalla AE, Fraser A, He SY, Lacy JN, Rivas-Morello C, Truong A, Hardiman G, Ohno-Machado L, Liu F, Hovig E, Kuo WP. 2012. A primer on the current state of microarray technologies. Methods Mol Biol 802:3–17. Uchikawa M, Ishida Y, Takemoto T, Kamachi Y, Kondoh H. 2003. Functional analysis of chicken Sox2 enhancers highlights an array of diverse regulatory elements that are conserved in mammals. Dev Cell 4:509–519. Voiculescu O, Bertocchini F, Wolpert L, Keller RE, Stern CD. 2007. The amniote primitive streak is defined by epithelial cell intercalation before gastrulation. Nature 449:1049–1052. Voiculescu O, Papanayotou C, Stern CD. 2008. Spatially and temporally controlled electroporation of early chick embryos. Nat Protoc 3:419–426. Vokes SA, Ji H, McCuine S, Tenzen T, Giles S, Zhong S, Longabaugh WJ, Davidson EH, Wong WH, McMahon AP. 2007. Genomic characterization of Gli-activator targets in sonic hedgehog-mediated neural patterning. Development 134:1977–1989. Wahl ME, Hahn J, Gora K, Davidson EH, Oliveri P. 2009. The cis-regulatory system of the tbrain gene: Alternative use of multiple modules to promote skeletogenic expression in the sea urchin embryo. Dev Biol 335:428–441. Wang Y, Ghaffari N, Johnson CD, Braga-Neto UM, Wang H, Chen R, Zhou H. 2011a. Evaluation of the coverage and depth of transcriptome by RNA-Seq in chickens. BMC Bioinformatics 12 (Suppl 10):S5. Wang Z, Young RL, Xue H, Wagner GP. 2011b. Transcriptomic analysis of avian digits reveals conserved and derived digit identities in birds. Nature 477:583–586. Werhli AV, Grzegorczyk M, Husmeier D. 2006. Comparative evaluation of reverse engineering gene regulatory networks with relevance networks, graphical gaussian models and bayesian networks. Bioinformatics 22:2523–2531. Wheeler GN, Liu KJ. 2012. Xenopus: An ideal system for chemical genetics. Genesis 50:207–218. Wilczynski B, Furlong EE. 2010. Challenges for modeling global gene regulatory networks during development: Insights from Drosophila. Dev Biol 340:161–169.
GENE REGULATORY NETWORK CONSTRUCTION
Wolf JB, Bryk J. 2011. General lack of global dosage compensation in ZZ/ZW systems? Broadening the perspective with RNA-seq. BMC Genomics 12:91. Woznica A, Haeussler M, Starobinska E, Jemmett J, Li Y, Mount D, Davidson B. 2012. Initial deployment of the cardiogenic gene regulatory network in the basal chordate, Ciona intestinalis. Dev Biol 368:127– 139. Yang X, Dormann D, Munsterberg AE, Weijer CJ. 2002. Cell movement patterns during gastrulation in the chick are controlled by positive and negative che-
15
motaxis mediated by FGF4 and FGF8. Dev Cell 3:425–437. Yokota Y, Saito D, Tadokoro R, Takahashi Y. 2011. Genomically integrated transgenes are stably and conditionally expressed in neural crest cell-specific lineages. Dev Biol 353:382–395. Zhang SO, Mathur S, Hattem G, Tassy O, Pourquie O. 2010. Sex-dimorphic gene expression and ineffective dosage compensation of Z-linked genes in gastrulating chicken embryos. BMC Genomics 11:13.