AP13.12706.m00022_s_at. Kanlow CTG15421_s_at. AP13CTG06255_s_at. Kanlow CTG06323_x_at. AP13.12696.m00016_x_at. OTHSWCTG06249_s_at.
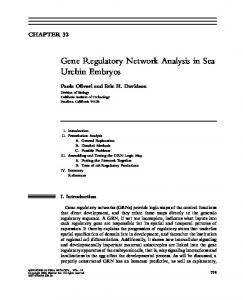
Composition of the cell walls 100%
Mannose Rhamnose Glucose 50%
Galactose Xylose Arabinose
0%
Monocot
dicot
Figure S1. Comparison of the monosaccharide composition of switchgrass suspension cell walls with those of other plant cell suspensions. The data for cell culture from wheat, oat, rice, sugarcane, bromegrass and sycamore are from (Burke et al, 1974).
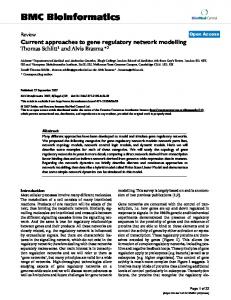
Non-induced
Induced
Xyloglucans
Xylans
0H 6H 1D 3D 7D 6H 1D 3D 7D
4M KOH
0H 6H 1D 3D 7D 6H 1D 3D 7D
1M KOH
0H 6H 1D 3D 7D 6H 1D 3D 7D
Carbonate
0H 6H 1D 3D 7D 6H 1D 3D 7D
0H 6H 1D 3D 7D 6H 1D 3D 7D
0H 6H 1D 3D 7D 6H 1D 3D 7D
Oxalate
Chlorite
4M KOH PC
Pectin/arabinogalactans
Figure S2. Glycome profiling heat map showing the relative abundance of cell wall glycan epitopes released sequentially from the AIR fractions of non-induced and BL-induced suspension cells.
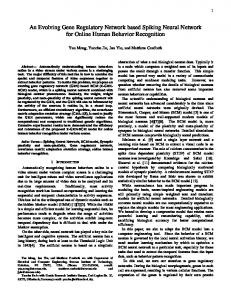
mAU
30
FA NI I
400 p-CA 200 0 5
10
15 20 25 30 Retention time ( min)
35
p-CA (NI)
p-CA (I)
FA (NI)
FA (I)
20 10 0
0
6h
1d
3d
C p-CA/FA Ratio (NI) Wall-bound p-CA/FA ratio
B
Wall-bound phenolic acids (mg/g CWR)
Absorbance at 310 nm
A
7d
p-CA/FA Ratio (I)
4 3 2 1 0 0
6h
1d
3d
7d
Figure S3. Measurement of wall-bound phenolic acids in non-induced and BL-induced switchgrass suspension cell culture. A, HPLC chromatogram of ester-linked wall bound phenolics from induced (I) and non-induced (NI) cultures harvested at 3d. B, Levels of ester-linked wall-bound p-CA and FA in induced (I) and non-induced (NI) cells. C, Ester-linked wallbound p-CA/FA ratio. p-CA, p-coumaric acid. FA, ferulic acid. The wavelength is p-CA, 310 nm and FA, 352 nm.
B
PC2 0 -2
2 0
-4
1
Variances Variances
3
2
4
4
A
1
2
3
4
5
-6
-4
-2
0
2
4
6
Components PC1
Figure S4. Principal component (PCA analysis) of genes expressed in BL-induced cultures. A, Plot of variance of five primary components. B, Plot of dimensionally reduced expression data on the first and secondary primary components. The first component is the weighted average expression, and the second component is the changes in expression over time.
309
OsC ESA 100 5 OsC ES 10 A3 0 Pv 10 J2 0 76 81 Pv Ba 01 08 8
PvJ01772
PvJ2673
95
6 SA
P
3 vJ
43
00
J1 Pv
00
1
0
18
51
b00 P vD
100
87
PvJ3
39
100
100 29
100
86 0 10
0
100
10
10 AtCE
SA3
350 PvJ
6 25
A8
03
CE S
Und_7D
Und_1D
Und_0h
A9
Ind_7D
CE S
Ind_3D
Ba
97
SA6
PvEb
Os
29
ES A7
Ind_1D
Os
AtCE
5
Kanlow CTG47577_s_at VS16ITG06226_s_at AP13.12059.m00001_s_at AP13CTG06092_at AP13CTG00607_s_at AP13CTG03673_s_at AP13CTG25870_s_at AP13ITG52811_s_at Kanlow CTG12907_s_at AP13CTG01684_at Kanlow CTG34110_at VS16ITG17943_s_at AP13CTG25049_s_at AP13ITG52653_s_at AP13.12706.m00022_s_at Kanlow CTG15421_s_at AP13CTG06255_s_at Kanlow CTG06323_x_at AP13.12696.m00016_x_at OTHSWCTG06249_s_at AP13ITG37355_s_at Ind_6h
100
10
PvEa00385
AtCESA
AtCESA1
Pv
J1
AtC
AtCESA
OsCESA6 OsCESA6 OsCESA1 OsCESA1 OsCESA3 OsCESA3 OsCESA8 OsCESA8 OsCESA4 OsCESA4 OsCESA7 OsCESA7 OsCESA9 OsCESA9 OsCESA1 OsCESA1 OsCESA2 OsCESA2 OsCESA2 OsCESA5 OsCESA5 Ind_0h
2 SA
100
O
E sC
0
Pv
5 20 02 73 Bb 10 0 Pv Ca Pv 19 46 0 J0 10 Pv 1 0 10 ESA OsC 8 0043
58
10 100
28
0
685
0
10
0
10
5
0
10
10
AtCESA2
AtCESA9 100
100
61 1 vJ
86
100
1370
4 ESA AtC
100
737
8382
0
92
PvJ2
P
E sC
100
OsCESA7
J3
98
10
100
PvIb00804
Pv
100
98
74
B
10
88
39
9
A4
SA8
O
0
13
10
PvJ079
100
1 A1
03
PvJ
AtCE
48
CE S
230
05
S CE Os
0 A1
Os
0.1
50
0 Da
ES sC
Pv Eb
6
b01 P vD
Pv
O
A
Figure S5. The expression of CESA genes in non-induced and BL-induced cultures. A, Phylogenetic tree of CESA genes in switchgrass, rice and Arabidopsis. B, Expression of candidate CESA genes in switchgrass suspension cells.
2 1 0 -1 -2
T0 0
T6H 6h
T1D 1d
T3D 3d
T7D 7d
AP13ISTG52811 (CESA8)
0.15 0.1 0.05 0 T0 0
0.05
T6H 6h
T1D 1d
T3D 3d
T7D 7d
AP13ISTG37355 (CESA5)
0.04 0.03 0.02 0.01 0 T0 0
T6H 6h
T1D 1d
T3D 7d T7D 3d
0.000015 0.00001 0.000005 0 T0 0
0.005
T6H 6h
T1D 1d
T3D 3d
T7D 7d
AP13CTG25049 (CESA9)
0.004 0.003 0.002 0.001 0 T0
0
T6H
6h
T1D
1d
T3D
3d
T7D
0.00008 0.00006 0.00004 0.00002 0 T6H 6h
Non-induced
T1D 1d
T3D 3d
KanlCTG19494 (CSLF6) 0.15 0.1 0.05 0 T00
0.03
T7D 7d
T6H 6h
T1D 1d
T3D 3d
T7D 7d
AP13CTG00856 (CSLF4)
0.02 0.01 0 T00
7d
KanlCTG34110 (CESA7)
T0 0
Relative expression of Ubi gene
0
KanlCTG12907 (CESA4)
Relative expression of Ubi gene
0.1
0.00002
Relative expression of Ubi gene
0.2
Relative expression of Ubi gene
0.3
Relative expression of Ubi gene
AP13CTG06092 (CESA1)
Relative expression of Ubi gene
Relative expression of Ubi gene Relative expression of Ubi gene
0.2
Relative expression of Ubi gene
0.4
0.03
T6H 6h
T1D 1d
T3D 3d
T7D 7d
AP13CTG20100 (GAUT4)
0.02 0.01 0 T0
0
T6H
6h T1D 1d
T3D
3d
T7D 7d
BL-induced
Figure S6. Validation of cell wall-related gene expression in switchgrass suspension cultures by qRT-PCR. Non-induced and induced samples are presented as open bars and closed bars, respectively. All data are means ± SE (n = 3).
D-Glucose-6P Up-regulated Down-regulated
Inositol-1-P PGI
PGM
Not changed
Insitol D-Fructose-6P
D-Glucose-1P D-Glucuronic acid GlcAK
D-Mannose-6P
UGP
D-Mannose-1P
D-Glucuronic acid-1P GMP GAE
UGD1 UDP-D-Glucose
UDP-D-Glucuronic acid UGD2
RHM UGE
UDP-D-Galacturonic acid AXS
UXS
UER UDP-L-Rhamnose
GDP-D-Mannose GMD
GDP-4-keto-6-deoxy-D-mannose UDP-D-Galactose
UDP-D-Xylose UXE
UDP-D-Xylose UDP-arabinose
UXT
GME GDP-L-galactose
GER GDP-L-Fucose
UDP-L-Arabinose
Golgii
Figure S7. Overview of changes in transcript levels for genes involved in cell wall precursor synthesis in BL-induced cultures. Orange, blue and gray arrow indicate up-regulation, down-regulation and no significant change of gene expression after BL treatment in switchgrass suspension cells, respectively. PGM, phosphoglucomutase; PGI, glucose-6-phosphate isomerase; UGP, UDP-glucose pyrophosphorylase; GlcAK, glucuronokinase; UGD, UDP-glucose dehydrogenase; RHM, UDP-rhamnose synthase; UER, nucleotide-rhamnose synthase/epimerase-reductase; UGE, UDP-galactose-epimerase; UXS, UDP-xylose synthase; UXT, UDP-xylose transporter; UXE, UDP-xylose epimerase; AXS, UDP-apiose/xylose synthase; GAE, UDP-glucuronate-epimerase; GMP, GDP-mannose pyrophosphorylase; GMD, GDP-mannose-dehydratase; GME, GDP-mannoseepimerase; GER, GDP-4-keto-6-deoxymannose epimerase/reductase.
A
B L-phenylalanine PAL L-cinnamic acid C4H
L-tyrosine TAL CAD
CCR
4CL
p-coumaric acid
4-coumaroyl CoA
4-coumaraldehyde
4-coumaryl alcohol (H)
HCT 4-coumaroyl shikimate C3’H Caffeoyl shikimate
CSE
HCT Caffeic acid
Caffeyl aldehyde
Caffeoyl CoA
COMT?
CCoAOMT
Ferulic acid
Caffeyl alcohol
COMT
COMT
Coniferaldehyde
Feruloyl CoA
coniferyl alcohol (G)
F5H 5-hydroxyferuloyl CoA
5-hydroxyferulic acid
5-hydroxyconiferaldehyde
CCoAOMT Sinapoyl CoA
4CL
5-hydroxyconiferyl alcohol
COMTb?
COMT
sinapaldehyde
CCR
sinapyl alcohol (S)
CAD
Figure S8. Proposed route for S lignin biosynthesis in BL-induced suspension cells. A, heat map showing changes in expression of key lignin pathway genes. B, preferred pathway based on the data in A.