Hence the need for a study to benchmark advanced Verification and Validation .... If code fixes for a bug were available, they were provided as soon as the bug.
Experimental Evaluation of Verification and Validation Tools on Martian Rover Software —Extended Abstract— Guillaume Brat, Dimitra Giannakopoulou, Allen Goldberg, Klaus Havelund, Mike Lowry, Corina Pasareanu, Arnaud Venet, Willem Visser NASA Ames Research Center
1
Introduction
To achieve its science objectives in deep space exploration, NASA has a need for science platform vehicles to autonomously make control decisions in a time frame that excludes intervention from Earth-based controllers. Round-trip light-time is one significant factor motivating autonomy capability, another factor is the need to reduce ground support operations cost. An unsolved problem potentially impeding the adoption of autonomy capability is the verification and validation of such software systems, which exhibit far more behaviors (and hence distinct execution paths in the software) than is typical in current deep-space platforms. Hence the need for a study to benchmark advanced Verification and Validation (V&V) tools on representative autonomy software. The objective of the study was to assess the maturity of different technologies, to provide data indicative of potential synergies between them, and to identify gaps in the technologies with respect to the challenge of autonomy V&V. The study consisted of two parts: first, a set of relatively independent case studies of different tools on the same autonomy code, second a carefully controlled experiment with human participants on a subset of these technologies. This paper describes the second part of the study. Overall, nearly four hundred hours of data on human use of three different advanced V&V tools were accumulated, with a control group that used conventional testing methods. The experiment simulated four independent V&V teams debugging three successive versions of an executive controller for a Martian Rover. Defects were carefully seeded into the three versions based on a profile of defects from CVS logs that occurred in the actual development of the executive controller. The rest of the document is structured as follows. In section 2 and 3, we respectively describe the tools used in the study and the rover software that was analyzed. In section 4 the methodology for the experiment is described; this includes the code preparation, seeding of defects, participant training and experimental setup. Next we give a qualitative overview of how the experiment went from the point of view of each technology; model checking (section 5), static analysis (section 6), runtime analysis (section 7) and testing (section 8). The final section gives some preliminary quantitative results on how the tools compared.
2
Overview of Technologies Benchmarked
The experiment tested tools representing three technologies: static analysis, model checking, and runtime analysis; and compared them to conventional methods. The static analysis tool was the commercial PolySpace C-verifier [5]. This tool analyzes a C program without executing it; it focuses on finding errors that lead to run-time faults such as underflow/overflow, non-initialized variables, null pointer de-referencing, and array bound checking. The model checking tool was Java PathFinder (JPF) [6], which is an explicit-state model checker that works directly on Java code. JPF specializes in finding deadlocks, verifying assertions, and checking temporal logic specifications. JPF explores all possible interleavings in multi-threaded programs. The runtime analysis tools were Java Path Explorer (JPaX) [4] and DBRover [3]. JPaX can infer potential concurrency errors in a multi-threaded program by examination of a single execution trace. Amongst the errors detectable are deadlocks and data races. DBRover supports conformance check of an execution trace against a specification written in metric temporal logic.
3
Target Software and Verification Requirements
The NASA Ames K9 rover is an experimental platform for autonomous wheeled vehicles called rovers, targeted for the exploration of the Martian surface. K9 is specifically used to test out new autonomy software, such as the Rover Executive. The rover executive provides a flexible means of commanding a rover through plans that control the movement, experimental apparatus, and other resources of the Rover - also taking into account the possibility of failure of command actions. The Rover executive is a software prototype written in C++ by researchers at NASA Ames. It is multi-threaded program that consists of approximately 35K lines of C++, of which 9.6K lines of code are related to actual functionality. Because the V&V tools benchmarked in this experiment analyzed programs written in Java and C, the C++ code was manually translated into these languages. Due to resource constraints, the translation was selective; some components of the executive were stubbed. The translated Java version is approximately 7.3 KLOC. The C version consists of approximately 3.2 KLOC. A simple definition of correctness of the rover implementation is that plans are executed correctly. That is, given a plan, the rover shall execute that plan according to its intended semantics, which is given informally in various documents describing the plan language. The rover can violate the plan semantics in numerous ways, which we of course cannot exhaustively cover here. Additionally, some of the tools examine a program for particular kinds of bugs, or rather coding errors, that can cause a program to fail its goal. Deadlocks can for example cause the rover to halt execution in the middle of a plan. Data races can cause unexpected concurrent accesses to variables that may alter the outcome. Null pointer references, un-initialized variables and indexing out of array bounds may cause the program to terminate abruptly during execution.
4
Methodology
The experiment consisted of 4 groups of 2 people each, with each group using a specific technology to analyze (essentially) the same code. The technologies used were: model checking (MC), runtime analysis (RA), static analysis (SA) and traditional testing (TT) as the control. The experimental design of the controlled experiment was done according to the principals proposed in [2]. 4.1
Code Preparation - Defects and Defect Seeding
In order to be able to guarantee the existence of at least a few bugs of different categories in the code for the experiment, we seeded bugs from the developer’s CVS logs in the current version of the code. We classified the bugs into three categories: deadlocks, data races, and plan execution defects. A total of 12 bugs were extracted from the CVS logs, of which 5 were deadlocks, 2 were data races, and 5 were plan-related. One of the deadlock bugs was given as an example during training on the tools. In our experiment, we simulated a normal development cycle where testing teams receive updated versions of the code and performed regression testing. Moreover, we also wanted to evaluate to which extent the set-up effort that advanced verification techniques sometimes require gets levelled-off during regression testing. For these reasons, we produced 3 versions of the code, where versions contained a number of common and a number of different errors. The code was also reorganized and changed at places between versions. During the experiment, 18 new previously unknown bugs were detected, 3 of which were deadlocks, and 15 of which were plan-related. Although we did our best to understand these bugs and their causes, it is possible that some of them are different manifestations of the same actual bug. 4.2
Participants
The participants to the study consisted of 4 graduate students in Computer Science on summer internships at NASA Ames, and 4 NASA Ames computer scientists. The summer interns are working towards PhDs in the domain of formal methods. Some are very proficient with the tools used in the study, while others have only a superficial knowledge of these tools. However, even the latter are very knowledgeable in formal methods and have worked with similar tools. The permanent Ames employees hold Masters or PhDs in relevant fields of computer science, and have extensive background in software development. To bring all participants to a similar level of competence within the time frame of the experiment, we gave them 3 days of training on the tools they were to use and the code they were to analyze, as described in the training section. Except for the SA group, all participants were provided with exactly the same code, as well as a set of requirements that this code should satisfy. Specifically, in our context, these requirements consisted of the semantics of the plan language that the Executive interprets. The experiment time was exactly the same for all
groups. Since the SA team worked on different code and concentrated on different types of bugs, their experiment results were not directly used for comparison with other tools. However, the SA experiment has still been valuable for obtaining some information about the benefits that the PolySpace tool can offer vs. the effort that its use requires in practice. Each participant had a powerful PC, with the exact same configuration. Finally, it was important to also ensure that during the experiment, groups would not receive hints or input from the observers/designers of the experiment accidentally. For this reason, personal communication had to be avoided. A mailing list was created through which all communication between the participants and the observers was performed. The mailing-list included all the observers. This gave time to the observers to read the queries carefully, think before sending replies, and check the replies sent by others. Four experts (one per technology) were responsible for replying to queries of their respective groups. 4.3
Experimental Set-Up
Each version of the code to be verified was sent to all participants at the same time through email, at the beginning of the session for the particular version. The participants had 16 hours to work on the version. The start and the end times of each sub-experiment were fixed. However, since each sub-experiment was two working days, and to accommodate the constraints on the daily schedule of the participants, they had the flexibility to schedule their 16 hours as fit. Experiments started at 1pm and ended 1pm, to allow for overnight runs of the PolySpace Verifier. Participants had to send a report to the mailing list after every hour of work. This report accounted for the way they used their time during this hour. The aim was for us to collect data about the relative set-up times of tools, tool running times, time required to understand/analyze the results obtained, etc. Moreover, participants were asked to send two types of bug reports. The first, named preliminary bug report, was a report that had to be sent immediately after a potential bug was encountered, together with the information (output) provided by the tool, or the reason why this was considered a potential bug. The second, named final bug report, had to be sent after the participants had performed sufficient analysis of the bug, to be able to say with some confidence whether they considered the bug in the preliminary report spurious, or real. All teams had to provide at least the following information associated with each bug considered real: the input that resulted in the manifestation of the bug (a plan, or a property, or both), whether the bug was reproducible, and the reason why the behavior of the system on the specific input was considered erroneous. The intention for the bug reports was to collect data about types and percentages of bugs that were found by different tools, rates of finding defects, spurious errors reported, etc. If code fixes for a bug were available, they were provided as soon as the bug was confirmed real.
4.4
Debriefing
After the end of the experiment, all participants were asked about their experiences from the use of the tools. They also prepared written reports including such issues as the approach/methodology they followed, difficulties that they faced, and potential improvements for the tools.
5
Model Checking
Abstraction is typically a very important technique required for the success of model checking, since it combats the state-explosion problem inherent to the analysis of complex software systems. We therefore provided a framework in which the participants could add abstractions in a non-intrusive fashion to the code. Besides the infrastructure for adding abstractions we also gave the participants the so-called “point” abstraction for all time-related data - i.e. all operations on time become nondeterministic choices. We anticipated that they would refine this abstraction to suit their needs. Lastly, we also provided the participants with a number of simple Rover plans as examples, as well as a so-called “universal” planner that can generate all possible plan structures up to a specific size limit in a nondeterministic fashion. The idea behind the universal planner is common in model checking, where a system is often analyzed within the most general environment it can operate in. Since the participants were both familiar with model checking and more specifically had used JPF before, the instructions on how to use the tool were minimal. Essentially, we requested that the participants “only” run the model checker and not run the code directly to determine where possible errors might exist - we wanted them to use the model checker to discover errors rather than just localize errors first observed during testing/simulation. We also requested them to determine whether errors reported were spurious or real - this meant that they needed to understand the code quite well. 5.1
Observations
After finding the first spurious error the participants abandoned the point abstraction of time in favor of a more realistic (under-approximation) of time. The main reason for this was the complexity involved in understanding the Rover code to determine if a bug is spurious or not. This new abstraction of time, had time starting at 0 and on each lookup of time, time either remained the same or incremented a random amount up to a certain maximum time at which point time stood still. The participants only used the universal planner sparingly: first they would try and uncover bugs with the concrete plans provided (and small modifications thereof) and only after exhausting most of their ideas would they turn to the universal planner to discover errors. During the running of the JPF tool most time was spent in trying different search strategies to reach different parts of the state-space. These mostly
included setting different parameters for the heuristic facilities provided by the tool. The participants used the point abstraction of time and the universal plan less than we anticipated. We believe this to be due to the fact that we knew the code much better than they did and could find all the known bugs with the abstracted code, whereas they found spurious behaviors early on and decided rather to abandon the abstracted code for something more realistic (although at the risk of missing some errors). This was a good decision on their behalf since they clearly spent less time on determining whether bugs were spurious than what we anticipated, but still found almost all the known errors.
6
Static Analysis
In the context of the V&V benchmarking study the static analyzer, PolySpace Verifier, has been solely used as an abstract debugger for finding runtime errors. The output of the tool consists of a color-coded version of the program source code. Each potentially dangerous operation can be flagged by four colors depending on how the associated safety conditions have been handled by the tool: – Red: the operation causes a runtime error for all execution paths that lead to that operation. – Green: the operation is safe, a runtime error can never occur at that point. – Orange: this color covers two cases: • An execution path to this operation causes a runtime error, whereas another execution path does not. • the tool has not been able to draw any conclusion on this operation. – Black: the operation is unreachable (dead code). The verification process using the static analyzer starts with a piece of software and no a priori insight on the structure of the code. This is the most common situation: it amounts to using the static analyzer during the validation process of a fully developed software. There are three main stages in putting the static analyzer to work: – Isolate the part of the code that will be analyzed and make it accepted by the front-end. This is the compilation stage. – Run the analyzer and correct all certain runtime errors that are detected by the tool. This is the debugging stage. – Run the analyzer and modify the code in order to improve the precision and remove false alarms. This is the refinement stage. Each of these three stages is highly iterative: the user runs the analyzer and modifies the command-line parameters and/or the code until no more error messages are issued. If this process had to be compared to software development, the first stage would correspond to compiling the program and eliminating all
syntax and type errors, the second stage to debugging the program and the third stage to optimizing the algorithms for achieving better efficiency. The training of the participants consisted of verifying the cipher algorithm RC4 from the ssh source distribution with PolySpace Verifier. Several runtime errors have been artificially inserted into this algorithm. 6.1
Observations
The users of the static analyzer spent a lot of time trying to remove orange alerts by adding assertions into the code (refinement). Their efforts were mostly vain because the assertions they inserted could not be taken into account precisely by the tool. Performing refinement efficiently requires a very good knowledge of the abstract interpretation used by PolySpace Verifier. This can be interpreted as a limitation of the tool. During the reviewing process of orange alerts, some obvious runtime errors were completely overlooked whereas numerous spurious bugs were reported. There are two interpretations: – The domain of applicability of each operation flagged as orange should be carefully checked in every possible execution context. The overwhelming amount of orange operations makes this process very difficult to apply rigorously. – Most importantly, the notion of runtime error was loosely interpreted: a runtime error is the violation of a safety condition which is clearly defined by the programming language (in this case C) specification for each operation. Several (spurious) bugs that were not related to the violation of a safety condition have been reported. Similarly, the users of the tool spent a substantial amount of their time trying to increase the number of execution paths that could be analyzed by the tool. This resulted into unduly modifying the original program or trying to make dead code reachable.
7
Runtime Analysis
Two tools were used for runtime analysis: DBRover and JPaX. Both tools are dynamic tools in the sense that an instrumented version of the program must be run to drive the tools. In essence the tools examine a single execution trace and analyze it for bugs using various algorithms. DBRover is specification driven, and checks that the trace satisfies a set of temporal formulae. JPaX checks for deadlock and data race potentials and requires no specification to be provided. Instructions for the participants were separated into general instructions on how to use DBRover and JPaX on any application, and specific instructions on how to use the tools on the Executive. The general instructions for using JPaX were minimal since the tool requires no specifications to be written and since instrumentation is performed automatically by the tool. Since DBRover requires specification writing, and manual code-snippet generation and insertion,
the general instructions for this tool were more elaborate. However, the learning curve did not seem to cause any problems and could be done in a few hours. The participants furthermore were instructed on how to write temporal formulae in DBRover for plans, representing the plan semantics. In general terms, for each action node in the plan the testers were recommended to write a set of formulae that would test that it was executed correctly. Note that although the other groups were also given instructions on the plan semantics and its temporal properties, the RA group received specific instructions. The RA group was asked to use the DBRover as much as possible, and not to only rely on the printed information from the program executions. 7.1
Observations
The JPaX tool appeared to be used in the way it was intended. When receiving a new version of the Executive, they usually started out applying JPaX to a few simple test cases, and thereby easily discovered deadlocks and data races this way. No advance preparation was required in addition to writing the test cases. From time to time, in between applications of DBRover, they further applied JPaX on some of the more complex plans, to see if it could detect in them other possible deadlock and race conditions. Close to the end of the time available they also tried to construct plans to maximize the coverage of the locking instructions reported by the deadlock analysis, or determined by examining the code that such a locking instructions was not reachable. The use of JPaX required to check that a deadlock or race condition potential reported was actually able to lead to a real error. For these kinds of errors the code was analyzed to understand if the error could effectively occur or not. They did not try to make the errors happen in the real code. The testers stated that the tool allowed them to ”easily detect deadlock and race Conditions”. Stating that ”We could run it and it would come back with suspected deadlock and race condition problems which would have been very hard and time-consuming to find with the traditional testing”. The DBRover was not fully used as requested. For each plan they had to write temporal formulae, generate instrumentation and insert the instrumentation in the Rover code. It took them some time to get familiar with the notation and the tool. Furthermore, they perceived the writing of temporal formulae as ”consistent overhead”, while for most of the simple plans just looking at the output was effective to determine if the plan behaved correctly or not. Hence, their general working mode was to write test cases, and in some cases just run the program while examining the output, and in some cases also writing temporal formulae using DBRover. In some cases DBRover detected errors that were not caught by analyzing printed results. One of the testers was specifically responsible for applying JPaX, while both testers applied DBRover. The tester that applied JPaX also wrote most of the test cases. The other tester would mostly try to locate and often fix the bugs in the code, and hence was the one that eventually became very familiar with the code and found bugs by simple code inspection.
JPaX found all the cyclic deadlocks and a data race condition that were seeded in the program quite easily. Since these are the only kinds of bugs the tool is designed to catch, one may say that its application was a success. Furthermore, it gave no false positives. The testers were quite happy with the tool. Of course, the ease of use has been achieved by restricting the kind of errors that can be found to deadlocks and data races. DBRover, on the other hand, allows much more general properties to be analyzed, and hence also is more complicated to use. In general, however, DBRover seemed to be less useful for the testers (their own formulation), and the main reason for this was that it took time to write the temporal formulae. Although this can be said to be a negative result, three observations can be made for a positive evaluation of DBRover for testing real systems in a realistic development environment: – the plans used were quite small and one could manually check the outputs, but in general plans will be very large and an automated tool to check the properties will be required – if an automated translation from plans to temporal formulae were available the tool would have been used much more – the tool is specifically useful in regression testing where large numbers of tests are run, which were not the case here
8
Testing
The testing team relied on the Eclipse IDE, using the debugger to demonstrate deadlocks. The testing team is seasoned developers who did not need any training on traditional V&V techniques. 8.1
Observations
The testing team took a black box approach to finding bugs. However they did modify the code to provide more elaborate diagnostic information via print statements. The participants recognized from the tutorial that concurrency was extensively used and may be a major source of bugs. Thus they focused their efforts on formulating test plans that might demonstrate concurrency bugs. They ran their test on multiple platforms to identify whether behavior depended upon the scheduling algorithm. For some tests they modified task priorities. They also wrote plans in which the time point in temporal constraints were temporally close, to analyze boundary cases. They maintained a regression suite that they ran on each new version, and so quickly identified bugs that were seeded in multiple versions.
9
Experimental Results
In this section we will give some preliminary qualitative results from the study. Due to the complexity of setting up an experiment like this it is almost impossible
to draw statistically valid conclusions. We’ll nonetheless give our interpretation of the results in the hope that it’ll serve as a source of reference for similar studies. The static analysis portion of the results were obtained on a different version of the code than the other techniques, and furthermore, static analysis looked for a different set of errors since the errors from the CVS log were not suitable for static analysis. For these reasons we only concentrate on the results from model checking, runtime analysis and testing in this section.
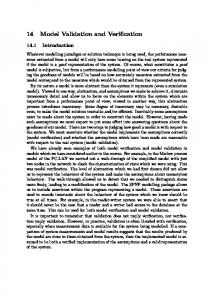
Fig. 1. Seeded Bugs found by each technique.
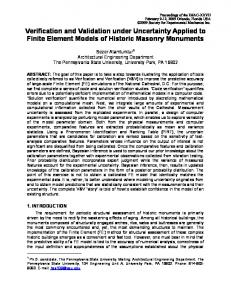
Figure 1 shows how the different techniques performed when looking for the seeded errors. Although we started with 12 errors, 1 was used for illustration during the training phase and 1 of the race errors was unreachable in the version of the Rover the participants worked on. It is obvious that the advanced tools - model checking and runtime analysis - performed much better on the concurrency related errors. This was a result we anticipated beforehand, and is also common folklore in the verification community. The fact that testing performed worse than model checking in all categories was somewhat of a surprise. Runtime analysis outperforming testing is not that surprising, since runtime analysis can be seen as a advanced form of testing. Figures 2, 3 and 4 shows how the participants spent their time during the analysis of the three different versions of the code. The information for these figures were constructed from the hourly reports that the participants provided during the experiment. The different categories were defined roughly as follows:
Delays: This includes waiting for hardware or tool failures to be resolved, as well as time spent waiting for feedback on questions to the ”developers”. Setup/Preparation: This category had a different meaning to each group. For example for model checking this included time to create abstractions, writing properties and test-cases, whereas for runtime analysis this mostly included creating properties and test-cases, and for testing, the activity of creating test cases and instrumenting the code (for example, adding print statements). Running the rover: Not really relevant for model checking, but essential for runtime analysis and testing. Running the tool: Testing didn’t really use any tools, but model checking and runtime analysis were tool-based. Result Analysis: This is the time spent determining what the cause of an error is. For model checking and to a lesser extent runtime analysis this involves determining whether an error is spurious or not.
Fig. 2. Time usage during version 1.
The most notable observation is that the model checking participants used the tool a great deal - essentially running the tool at all times while doing other activities. There is only slightly less time spent running the model checker in the first version, obviously due to getting to grips with the problem, and then in the other versions almost 100% tool usage is reported. This is due to the fact that the model checker is quite slow on such a large example.
Fig. 3. Time usage during version 2.
Another observation for the model checking group is that they spent more time on setup in the first version than the next two. This also confirms the suspicion that when using a complex tool such as a model checker, it takes some time to setup the ideal working environment before any meaningful work can be done. A similar pattern is seen for runtime analysis - again as to be expected. Somewhat amazingly, the testing group never spent much time analyzing the errors they found. This put much more of a burden on the controllers of the experiment to determine which of the known bugs, if any, they found. The other two groups spent quite large amounts of time on determining the cause of errors in the first version, but far less on the later two versions. We assume this is due to having to understand the code in the beginning, whereas later they could go through error-traces more quickly. In the final version we’ll elaborate more on the setup of the experiment, the different tools used, give more results (for example the rates at which bugs were found etc.), and, try and make more meaningful conclusions. We hope this preliminary version will allow for fruitful discussions.
References 1. B. Boehm and D. Port. Defect and fault seeding in dependability benchmarking. In Proc. of the DSN Workshop on Dependability Benchmarking, June 2002. 2. C. Drew and M. Hardman. Designing and Conducting Behavioral Research. Pergamon General Psychology Series, 1985.
Fig. 4. Time usage during version 3.
3. D. Drusinsky. The Temporal Rover and the ATG Rover. In SPIN Model Checking and Software Verification, volume 1885 of LNCS, pages 323–330. Springer, 2000. 4. K. Havelund and G. Ro¸su. Monitoring Java Programs with Java PathExplorer. In Proceedings of Runtime Verification (RV’01), volume 55 of Electronic Notes in Theoretical Computer Science. Elsevier Science, 2001. 5. PolySpace. http://www.polyspace.com. 6. W. Visser, K. Havelund, G. Brat, and S.-J. Park. Model checking programs. In Proc. of the 15th IEEEInternational Conference on Automated Software Engineering, Grenoble, France, September 2000.