EPJ Web of Conferences 180, 02060 (2018) https://doi.org/10.1051/epjconf/201818002060 EFM 2017
Experimental investigation and numerical modelling of 3D radial compressor stage and influence of the technological holes on the working characteristics Richard Matas1,*, Tomáš Syka1 and Lukáš Hurda1 1
University of West Bohemia in Pilsen, New Technologies Research Centre, Univerzitní 2732/8, 301 00 Plzeň, Czech Republic Abstract. The article deals with a description of results from research and development of a radial compressor stage with 3D rotor blades. The experimental facility and the measurement and evaluation process is described briefly in the first part. The comparison of measured and computed characteristics can be found in the second part. The last part of this contribution is the evaluation of the rotor blades technological holes influence on the compressor stage characteristics.
1 Introduction Centrifugal compressors are widely used in the industry. A traditional producer of multi-stage centrifugal compressors, the company Howden ČKD Compressors s.r.o. (HCKD) has developed a new family of compressor stages. The development project was realized in the cooperation among PCA Engineers Limited and University of West Bohemia in Pilsen (UWB). The main goal of the project is to achieve higher stage efficiency and better operational properties. The description of processes, operations and performance of the centrifugal compressors are described in many publications, for example in [1]. Performances of the centrifugal compressors stages are analysed through two of the main properties: the pressure ratio and the efficiency. These two parameters vary with volume flow and with Mach number. The verification of the new stages properties requires detailed measurement of performance characteristics to obtain reliable data for compressor design. Measured data are also important for validation of CFD numerical models. The validated numerical models can give also the complex information about the flow in the stage and help to design the profile of the channel.
exchangeable flow part is placed. The compressor consists of an inlet cone, an impeller, a diffuser, a return bend, a de-swirl channel and an exit part. This quite unique compressor is driven by the electromotor with maximum input wattage 1.2 MW, which is driven by the frequency converter for the continuous revolution change. The test rig is shown in the upper part of Fig. 1. The test rig is designed for impellers with diameter of 440 mm. It is possible to change shaft revolutions from 4 000 to 17 500 rpm. A set of throttle-valves for the aerodynamic resistance adjusting is placed in the discharge piping. Mass-flow rates of the air through the suction and discharge piping are measured by orifices.
2 Experimental facilities 2.1 Experimental rig The current development of the centrifugal compressor stages follows the systematic research and development program in the former ČKD company in the past; see for example the paper [2]. The experimental compressor stages verification is being realized in the development test facility HCKD built in Pilsen in 2013, where the single-stage test compressor DARINA IV with the *
Fig. 1. Photo of the centrifugal compressor stage together with the cross-section with red colour highlighted evaluated planes
Corresponding author:
[email protected]
© The Authors, published by EDP Sciences. This is an open access article distributed under the terms of the Creative Commons Attribution License 4.0 (http://creativecommons.org/licenses/by/4.0/).
EPJ Web of Conferences 180, 02060 (2018) https://doi.org/10.1051/epjconf/201818002060 EFM 2017
marked as proper for curve reconstruction is kept minimal, although there are some parts of the curve which the measurement should never omit. The campaign starts at the maximum flow rate and minimum pressure ratio and then the flow rate is slowly reduced by discharge control shutter. The operators find several points to determine carefully the shape of curve during the diminishing choking of flow. Then a maximum discharge pressure point is searched carefully. After that, an approximate position of surge initiation is found. The aim is to measure one operational curve keeping the reference (blade) Mach number (1) constant. This number is based on speed of sound in gas at stage intake state and the velocity of blades at outer diameter of the impeller:
2.2 Experimental equipment The parameters of the measured stage are obtained by complex measurement and data acquiring system. The flow parameters are measured in the evaluation planes. The description of the planes in the stage is longterm used, see [3]. The main evaluation planes are the planes 0 and 7 depicted in the bottom part of Fig. 1. There is a number of static and total pressure and total temperature probes (multiple sensors are placed in the planes 0 and 7). The torquemeter gives the value of torque and rotating speed of the compressor rotor. Physical models of the new designed stages were prescribed in HCKD. For the evaluation the stage RTK01 was selected in two modifications with various blade lengths, which is the stage for high flow rates. The impellers and stator parts of the stages RTK01W and RTK02N are depicted in Fig. 2.
M 2u
2 D2 u 2 a0 a0
(1)
This means the rotational speed is being adjusted slightly based on the actual intake conditions. The measurement evaluations has two main branches based on the way of determination of the stage required power. A simple evaluation based on the torquemeter direct measurement of the power throughput is supplied by the bearings losses determined by the measurement of heatup of the lubricating oil continuous stream. These losses are subtracted from the measured power. The more complex set of calculations is needed to express the required power based on the flow temperature measurements. The polytrophic change of state of gas is accounted for after the exact total and static parameters in evaluation planes 0 and 7 are calculated. Iterative procedures are employed several times. The reason for the implementation of iterative algorithms (if it is not required even for a perfect gas) is the required option of performing the calculations with real gas properties based on pressure and temperature explicit equation of state. At first, the restitution factor of the total temperature probes is evaluated based on the mean flow speed in the intake and discharge plane respectively, while the static states i.e. the effective densities are not known a priori. A theoretical isentropic discharge temperature and specific work is the main output of the polytrophic compression analysis as other parameters can be readily obtained from already analysed states at the endpoints of the real polytrophic curve. The theoretical isentropic discharge temperature is searched to assure zero entropy change while assuming the same total pressure ratio as the real compression measured by total pressure probes. The key parts when thinking of data comparison (current measured with older measured or even CFD results) are the procedures of corrections for reference conditions. The test rig is prone to various effects of the environment, the intake air state being the strongest. Not only the state of air but also its composition change when the humidity differences are involved. One correction procedure carries out the effects of the intake gas state and composition on compressor
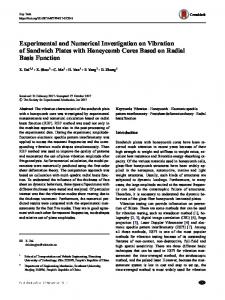
Fig. 2. Models of the stage RTK01W and RTK01N for the experimental compressor.
2.3 Evaluation of measurement The measurement campaigns are established to produce curves of operational characteristics – branches of compressor map. The number of points on the curve
2
EPJ Web of Conferences 180, 02060 (2018) https://doi.org/10.1051/epjconf/201818002060 EFM 2017
following sections. The values PIN, ETAN and mN are normalized by the design point values in the measured characteristic. The results from stages CFD simulations were compared to the measured data converted to the standard inlet conditions.
operation employing the classic similitude relations in its most general form to readily utilize real gas equation of state. Five non-dimensionless numbers are kept constant for the actual and reference intake compressions: blade Mach number, flow coefficient, power coefficient, total pressure ratio and polytrophic efficiency. This assumption allows the absolute performance characteristics to be transformed using algebraic equations. The polytrophic efficiency is then used to back-check the evaluation of corrected polytrophic discharge temperature based on the predicted enthalpy rise. The second correction procedure is used to account for the inequality of the blade Mach numbers in measurement and the desired reference. Efforts are put to minimize this difference during measurement, but the weather conditions and a non-sensitive rotational speed control system cannot be overcome perfectly. Idealized relations are utilized to cancel the above mentioned effect. Those are functional relations of the compressor performance characteristics with the impeller rotational speed being the function argument. The result of this procedure is an approximation, but when the actual revolutions are close to the desired, it should be very accurate while the magnitude of corrections is very low. As well as for the CFD results, dimensionless numbers can be expressed to be used in compressor design tasks. Besides the whole stage evaluation, a part-by-part analysis can be carried out using the data acquired from the internal planes visible in lower part of Fig. 1. Mean velocity vectors, performance characteristics of diffuser or the losses of the de-swirl channel could be addressed.
3 Numerical simulations measured stage
of
the
3.1. Software CFD simulations are now an essential tool for the design of all types of devices in turbomachinery. They enable to gain much time between the concept and the test. The verification of simulations is carried out virtually in all development turbomachinery groups and widely published; for example in [4] and many others. For the purposes of this work many CFD simulations of various compressor stages were solved in the NUMECA FINE/Turbo (NFT) software environment, where the main goal was to determine the suitable turbulence model and computational grid parameters. 3.2 Simulations of the stages The methodology of simulation and properties of the model has also been evaluated and improved [6]. The mentioned stages were modelled without and with leakage. The geometry of the numerical models, computational domains and an example of the computational mesh for the stage with leakages can be seen in Fig. 3.
2.4 Parameters of stages The evaluation of various compressor stage parameters was done according to the formulas below. Values of the evaluated parameters were averaged by mass flow in postprocessing. The parameters are: specific total work (2), specific isentropic work (3), pressure ratio (4), isentropic efficiency (5) and flow coefficient (6). ht c p Tt 7 Tt 0 (2)
p t 7 his z r Tt 0 1 pt 0
PI
pt 7 pt 0
1
1
(3)
(4)
ETA
his ht
(5)
FI 0
4 Q0 D22 u2
(6)
The obtained characteristics include the confidential data of HCKD and only relative values are presented in the
Fig. 3. Stages geometries of the computational domains and an example of the computational mesh.
3
EPJ Web of Conferences 180, 02060 (2018) https://doi.org/10.1051/epjconf/201818002060 EFM 2017
The air, modelled as an ideal gas, was used as the flow medium, SST k-ω and EARSM turbulence models were used for the described simulations. 3.3 Comparison of results - stage RTK01W The values for this stage were already published in [5]. In Fig. 4 you can see the performance characteristics for M2u = 0.9. It is possible to compare the results of described CFD simulations with measured data. The measured pressure ratio of the stage is lower than the ratio obtained from the CFD simulations. The reason can be the shape of the impeller – the fillets or other inaccuracies [6]. The efficiency values for the EARSM model with leakages are predicted well. The question is why all the CFD simulations (the authors have other results from ANSYS CFX available) predict higher flow rate than the measurement shows. The shift between flow rates in the measured and computed characteristics is typical for this stage and despite the repetition of measurements and calculations with different models this remains unclear.
Fig. 5. Performance characteristics of the RTK01N stage
4 Influence of the technological holes to the performance characteristics 4.1. Technological holes For the most part the impellers with 3D blades are manufactured by milling on a 5 axes CNC machine. In some cases the technology combining the classical machining and welding can be preferable. The welding of impellers requires the technological holes in the blade; you can see an example of such hole in Fig. 6.
Fig. 4. Performance characteristics of the RTK01W stage
On the basis of the above, it can be concluded that the efficiencies and pressure ratios are kept in the used CFD models and those can be regarded as credible.
Fig. 6. An example of a technological hole
The goal is to find out the suitable holes location depending on the blade type and achieved stage efficiency. Due to the complexity of shape and with regard to the demanded precision of the blades it is necessary to place the weld and also the holes near the tip of the blades, so only low ribs remain on the cover disc to form the shape of blades. The holes are then formed from two semi-circular notches in both welded parts.
3.4 Comparison of results - stage RTK01N The same process as for the stage RTK01W was implemented for the stage RTK01N. In Fig. 5, the performance characteristics are presented. The results of numerical simulations can be compared sufficiently to the measured values. The situation here is very similar as for the stage with the longer blades in the impeller shown in the Fig. 4.
4
EPJ Web of Conferences 180, 02060 (2018) https://doi.org/10.1051/epjconf/201818002060 EFM 2017
The second method also uses the non-conformal grid interfaces, but the connection of the domain with the hole is performed away from the blade surface and it is possible to keep the geometry of the hole including edges. New blocks of the mesh and the connection to the channel mesh is depicted in Fig. 9.
Important factors are the diameter of the hole and its orientation. In all cases the perpendicular direction of the axis of the hole to the central equidistant surfaces of the blade is handled. Since this is the first analysis of this type and the parameters of the hole depending on its specific position, the central cross section was modelled as constant with the diameter of 5 mm with regard to the technology. The current position on the edge of the blade is defined by the distance from the leading edge. Hole in the geometrical variants were placed in positions 24, 41, 59, 65, 71 and 87 % of blade length from the leading edge. The Fig. 7 describes the positions of the holes. The basic position of the hole in the 65 % is indicated in green ink, this should be closest to the real positioning. Other possible locations are in range between 59 and 71 % from the leading edge. The remaining positions probably will not be usable because of the manufacturing technology or the high stress in the compressor impeller and they are only theoretical.
Fig. 9. Domains of technological hole created using new mesh blocks
The comparison of both methods shows that the results of the first method are worse. The different density of the mesh on the non-conformal interface is followed by the distortion of the flow field. That was the reason why all of the described simulations used the second, more complicated method. All numerical simulations in this chapter were carried out using simplified models without leakages and with the same settings as the models mentioned in chapter 3. 4.3 Results of simulations - stage RTK01W The results were evaluated as for the stage without holes. The Fig. 10 illustrates the flow in the hole.
Fig. 7. Locations of the technological holes
4.2 Computational domains and meshes For the CFD computations the quality a topology of the computational mesh is often very important. It was not easy to include the holes into the mesh of the blade. Two types of meshes were tested. The first one is relatively simple and it is based on using non-conformal grid interfaces applied directly on the volume representing the hole, see. Fig. 8.
Fig. 10. Influence of the technological holes to the velocity field
The shapes of the performance characteristics are similar to the above depicted ones and therefore it is more appropriate to use the relative influence on the efficiency characteristics. The influence on the pressure ratio is inconsiderable and the pressure ratios obtained by CFD models with and without holes are almost the same. The Fig. 11 shows the relative influence of the holes to the efficiency of the stage. The influence was tested for three basic values of the M2u (i. e. three values of the rotor speed). The normalised mass flow rate mN is encident to the computed point for the stage without hole in the characteristics in the Fig 4. The influence of the hole is different for various M2u, but usually lies between 0 and 0.5 %. The
Fig. 8. Domains of the technological hole connected using non-conformal interfaces
5
EPJ Web of Conferences 180, 02060 (2018) https://doi.org/10.1051/epjconf/201818002060 EFM 2017
comparison shows the small decreases in efficiency depending on the compression point. The effect is the greatest in case of higher flow rates above 0.5 and does not exceed 1.8 %. These values show that the usage of the welded impellers with small technological holes is possible without a significant impact on efficiency.
Fig. 12. CFD simulations of the RTK01N stage – influence of the technological holes on the efficiency
5 Conclusions
The verification of the compressor stages with the relatively wide range of parameters is possible to perform on the HCKD DARINA IV compressor with good repeatability. The test facility is able to evaluate complete integral and some local quantities in order to prepare appropriate data for the thermodynamic design. It is possible to verify CFD models and their applicability by mutual comparison of experimental data and CFD simulations results. The methodology for the centrifugal compressor stages CFD simulations was verified in the NUMECA FINE/Turbo software for the stage with 3D blades in the impeller. The verification for stages with 2D blades was published in [7].
Fig. 11. CFD simulations of the RTK01W stage – influence of the technological holes on the efficiency
4.4 Results of simulations - stage RTK01N The same set of simulations and evaluation was made for the stage RTK01N with the technological holes. You can see the influence on the efficiency in Fig 12. It is evident that the results are similar to the results of the impeller with the wide channels but not the same. Obviously the results are about 0 and 0.5 % again, but the impact is different and the maximum value is only 1 %.
6
EPJ Web of Conferences 180, 02060 (2018) https://doi.org/10.1051/epjconf/201818002060 EFM 2017
References
The presented results of two variations the stage RTK01 shows good agreement in efficiency, relatively good agreement in the pressure ratio but yet unexplained slight differences in the flow rates. These simulations and comparisons are the basis for the last part of the contribution, for the influence of the technological holes to the performance characteristics. The appropriate model of the stages with the holes was developed. The results of the simulations with the technological holes show very small influence on the pressure characteristic and to the flow rate. Influence to the efficiency varies with the position of the hole from zero to 1.8 % in specific conditions. The result show that in case of a welded impeller it is necessary to assess working conditions due to the relative size of the hole and where appropriate, reduce the values of the efficiency expected for compressor design.
1.
2.
3.
4.
Acknowledgement 5.
The results were developed within the CENTEM PLUS (LO1402) by financial means from the Ministry of Education, Youth and Sports under the ”National Sustainability Programme I.” and specific research. The authors would like to thank the Howden ČKD Compressors Ltd. for permission to publish this paper and all colleagues who participated on this work.
6. 7.
Nomenclature a cp D ETA FI0 l m M2u PI pt r Tt u2 z Δh κ Ω
Speed of sound Isobaric specific heat capacity Impeller outer diameter Isentropic efficiency Flow coefficient for intake volumetric flowrate Hole position measured from blade tip Mass flow rate Blade Mach number Total pressure ratio Total pressure Specific gas constant Total temperature Blade speed at impeller exit Real gas compressibility factor Specific enthalpy difference Ratio of specific heats Rotational speed of the impeller
Common indices: 0 Plane 0 (stage intake) 2 Impeller exit 7 Plane 7 (stage discharge) is Isentropic N Normalized
7
M. P. Boyce, “Principles of Operation and Performance Estimation of Centrifugal Compressors,” Proceedings of the twentysecond turbomachinery symposium, Dallas, TX. (1993) J. Paroubek and J. Kynčl, “The Influence of Impeller Flow Channel on Aerodynamic Performance of a Centrifugal Compressor Stage,” ASME Paper 98-GT-40 (1998). J. Paroubek and V. Cyrus and J. Kynčl, „The Influence of Outlet Stator Part Surface Roughness on the Performance of a Very Low Flow Coefficient Centrifugal Compressor Stage", ASME Paper 96-OT-179 (1996) P. Le Sausse and P. Fabrie and D. Arnou and F. Clunet, “CFD comparison with centrifugal compressor measurements on a wide operating range,” EPJ Web of Conferences, Volume 45 (2013) Numerical and Experimental Modelling of the Radial Compressor Stage Syka, Tomáš and Matas, Richard and Luňáček, Ondřej, AIP Conference Proceedings, 1745, 020059 (2016). T. Syka, “Geometry structure influence on the radial compressor stage efficiency,” Ph.D. thesis, in Czech, ZČU in Pilsen (2015) Matas R., Syka T., Luňáček O., “Numerical and experimental modelling of the centrifugal compressor stage – setting the model of impellers with 2D blades”, EPJ Web of Conferences, Volume 143, 02073 (2017)