Hindawi Advances in Acoustics and Vibration Volume 2017, Article ID 7091425, 8 pages https://doi.org/10.1155/2017/7091425
Research Article Experimental Investigation on Flutter Similitude of Thin-Flat Plates I. P. G. Sopan Rahtika,1,2 I. N. G. Wardana,2 A. A. Sonief,2 and E. Siswanto2 1
Department of Mechanical Engineering, Bali State Polytechnics, Badung, Bali 80361, Indonesia Department of Mechanical Engineering, Brawijaya University, Malang, East Java 65144, Indonesia
2
Correspondence should be addressed to I. P. G. Sopan Rahtika;
[email protected] Received 28 December 2016; Revised 20 February 2017; Accepted 27 February 2017; Published 12 March 2017 Academic Editor: Marc Thomas Copyright © 2017 I. P. G. Sopan Rahtika et al. This is an open access article distributed under the Creative Commons Attribution License, which permits unrestricted use, distribution, and reproduction in any medium, provided the original work is properly cited. This paper shows the experimental results of the flutter speed of thin-flat plates with free leading edge in axial flow as a function of plates’ geometry, fluid densities, and viscosities, as well as natural frequencies of the plates. The experiment was developed based on similitude theory using dimensional analysis and Buckingham Pi Theorem. Dimensional analysis generates four dimensionless numbers. Experiment was conducted by placing the thin-flat plates in a laminar flow wind tunnel in order to obtain the relationship among those dimensionless numbers. The flutter speed was measured by varying the flow velocity until the instability occurred. The dimensional analysis gives a map of the flutter Reynolds number as a function of a new type of dimensionless number that is hereby called flutter fluid structure interaction number, thickness-to-length, and aspect ratios as the correcting factors. This map is a very useful tool for predicting the flutter speed of thin-flat plates in general. This investigation found that the flutter Reynolds number is very high at the region of high flutter fluid structure and thickness-to-length ratios numbers; however, it is very sensitive to the change of those two dimensionless numbers. The sensitivity is higher at lower aspect ratio.
1. Introduction Flutter is a potentially damaging dynamic aeroelastic phenomenon where aerodynamic forces with the natural modes of vibration cause a periodic motion of a structure going unstable. In a certain fluid structure interaction, the aerodynamic forces serve as input energy to the structural vibration. When the system is not damped by the aerodynamic damping, the vibration amplitude will increase and eventually will lead to structural failure. Flutter can occur in a variety of structures, such as in aircraft wings and turbine blades or even on the bridge. Most previous studies on flutter were focused on the prediction of the flutter speed using numerical methods. Very few literatures are available that discuss flutter using experimental similitude method as a tool to predict flutter phenomenon, despite the fact that similitudes offer cost savings in the investigation of the fluid flow phenomena. This scarcity was one that motivated this study. The flutter phenomenon observed in this research focused on the flutter of thin-flat plates with free leading edge
in axial flow. There were numerous studies which have been done on the flutter of the thin-flat plates due to the canonical characteristics of the problem, such as researches by Chad Gibbs et al. [1], Tang et al. [2], Tang and Pa¨ıdoussis [3], Tang and Dowell [4], Howell et al. [5], and Zhao et al. [6]. Chad Gibbs et al. [1] performed experimental and theoretical work on the flutter of a flat plate with a fixed leading edge using the three-dimensional vortex-lattice method. Gibbs’ report comprehensively described the characteristics of plate flutter as a function of the mass ratio and the aspect ratio. Tang and Pa¨ıdoussis [3] discussed the flutter of two flat plates which were positioned in parallel with the axial direction of the fluid flow. The work of Tang and Dowell [4] was about nonlinear flutter and Limit Cycle Oscillation (LCO) of two-dimensional panels in low subsonic flow and later was extended to threedimensional panels by Tang et al. [2]. The dynamics of the system was built to produce nonlinear models. Zhao et al. [6] discussed both theory and experiment of the flutter of a flat plate. The discussion emphasizes nonlinear analysis to
2 produce Poincar´e maps. The nonlinear analysis results were compared to experimental results. Howell et al. [5] used fluid flow interactions to discuss the nature of a cantilevered plate with ideal flow. The aeroelastic instability of a flexible plate has been investigated using weakly nonlinear analyses by Eloy et al. [7]. Later, a deeper investigation was focused on the origin of the instability hysteresis [8]. Despite the detrimental effect of flutter, there are new research trends to utilize flutter for wind harvesting. The utilization of flutter phenomena for energy harvesting has been explored by Doar´e and Michelin [9], Makihara and Shimose [10], and Dunmon et al. [11]. The other works on energy harvesting using a slender structure in the wake of a bluff body were also conducted by Allen and Smits [12]. As a matter of fact, this research is oriented as a theoretical base to explore this application further. This research chose to explore the free leading edge instead of a fixed leading edge because the chosen configuration experiences flutter at a lower wind speed. A free leading edge plate will experience flutter in its first mode shape as shown later on the experimental results, while the fixed leading edge will experience flutter at the second mode [1, 5, 7]. This advantage of free leading edge is the reason of the selection of this configuration in this research. Furthermore, the utilization of thin-flat plates for wind harvester requires a map of flutter speed as a function of plates’ geometry for design optimization. One significant part of this research is to generate a flutter speed map for wind harvester design optimization. The authors currently have an on-going development of a micropower generator utilizing flutter of a free leading edge configuration. This is new expansion of flutter energy conversion utilization into the field of microelectromechanical systems. This paper puts a benchmark for this research. Flutter phenomena of plates continuously have been observed in the last several years. More recent studies on plate or panel flutter were also done by Fernandes and Mirzaeisefat [13], Cunha-Filho et al. [14], Peng and DeSmidt [15], and Yaman [16]. Similitude theory has been well developed and widely used in the field of fluid dynamic. The use of similitude theory continues to grow in the field of structural vibration, for example, Torkamani et al. [17], and acoustic, for example, De Rosa et al. [18]. A work has also been done on structural similitude for flutter of composite plates by Yazdi and Rezaeepazhand [19]. In this study, a testing method is developed using dimensional similitude analysis based on the Buckingham Pi Theorem. Dimensional analysis generated four dimensionless numbers. Experiment was conducted on thin-flat plate which is placed in a wind tunnel. The problem in this research was to formulate relationships between the flutter speed and the affecting parameters. Flutter speed is defined as the velocity of fluid flow at which flutter started happening. The plates’ parameters that affect the flutter speed that were taken into account in this experiment were their length, width, thickness, and natural frequencies, while the fluid’s parameters (in this case, fluid is air) that were taken into
Advances in Acoustics and Vibration account were its density and viscosity. By using the similitude principle, the experimental results were used to obtain the relationship between the dimensionless numbers Π1 , Π2 , Π3 , and Π4 . Later on, it has been observed during the analysis that the first dimensionless number Π1 is the Reynolds number measured during flutter and then called flutter Reynolds number. The second dimensionless number Π2 is called fluid structure interaction number since it contains the interacting forces. The third Π3 and fourth Π4 numbers are the thicknessto-length and aspect ratios, consecutively. This study finally discovered the relationship of the flutter Reynolds number as a function of the fluid-structure interaction number and the geometric ratios.
2. Theory of Flutter and Similitude Theoretically, this research was about implementing the similitude theory to observe the flutter phenomenon of thin-flat plates which then was used to generate a map for predicting the flutter speed. The conceptual theory of this research was developed from the theory of flutter and the similitude theory. 2.1. Flutter. Theoretical work on flutter has been recognized as early as 1878 by Rayleigh [20]. However, the practical work on flutter was later on reported by Theodorsen in 1934. Theodorsen explained the flutter mechanism theoretically and experimentally of the aircraft wing and also the combination of wing-aileron-tab [21–23]. Flutter is an unstable fluid and structure interaction. The dynamics of a thin-flat plate’s structure is stable by itself. However, when it is placed in a moving air, the aerodynamic forces shift the stability of the system. The system will become unstable when the air speed reaches a certain speed. This speed is called the flutter speed. The dynamics of a thin-flat plate can be modeled as a matrix equation of motion where the plate’s structural dynamics is subjected to aerodynamic force 𝐹𝑎 . 𝑀𝑈̈ + 𝐶𝑈̇ + 𝐾𝑈 = 𝐹𝑎 .
(1)
In this case, 𝑈, 𝑈,̇ 𝑈̈ are the element nodal displacement, velocity, and acceleration vectors, consecutively. 𝑀, 𝐶, and 𝐾 are the mass, damping, and stiffness matrices. The aerodynamic force 𝐹𝑎 is nonlinear in nature. For the purpose of predicting the flutter speed, 𝐹𝑎 is often linearized to be 𝐹𝑎 = 𝐶𝑎 𝑈̇ + 𝐾𝑎 𝑈.
(2)
The denotation “𝑎” on 𝐶𝑎 and 𝐾𝑎 represents the aerodynamic contribution to the damping and stiffness matrices. Substituting the linearized 𝐹𝑎 into the full plate’s aeroelastic equation of motion yields the plate’s linearized equation of motion: 𝑀𝑈̈ + (𝐶 − 𝐶𝑎 ) 𝑈̇ + (𝐾 − 𝐾𝑎 ) 𝑈 = 0.
(3)
Equation (3) shows how the flutter can occur. The flutter will occur if (3) is unstable. The eigenvalue analysis of this
Advances in Acoustics and Vibration
3
linearized equation can give the value of the flutter speed of the plate. 2.2. Similitude Requirements for Modeling in Fluid Mechanics. The similitude requirements for the fluid dynamic problems are already well developed. Similitude is usually used in analyzing fluid dynamic problems such as lift and drag forces. In this study, the similitude method is used for analyzing the fluid structure interaction. Similitude deals with the similarity of the actual system with its lab-scaled model or prototype. The similitude requirements for fluid dynamic problems have been well defined by Wolowicz et al. [24]. Similarity in geometric configuration is a fundamental requirement. Prototype and actual objects have to be geometrically congruent. Another requirement is kinematic similarity. Two flows are kinematically similar if the associated velocities at the same point are related to a constant factor in the direction and magnitude [24]. This means that two streams are equal in their kinematics when streamline pattern associated with a constant factor. Further requirements that must be met are the dynamics similarity. Two flows are dynamically similar when the associated forces at the same point are related to a constant factor in the direction and magnitude. For the purpose of this research, an extra similitude requirement should be considered. Flutter problem is a moving boundary problem. The shape of the boundary varies with time. Ideally, in a steady case, the change is periodic or constant in frequency spectrum. Flutter will occur in a certain shape that is associated with the structural natural mode. Due to this reason, it is required to add a fourth similarity requirement when similitude theory is implemented to flutter problem. This fourth requirement is that the mode shape of the actual and the prototype must be congruent. 2.3. Buckingham Pi Theorem. The development of a similitude method relays very much on the Buckingham Pi Theorem. In this section, the Beckingham Pi Theorem is recalled as the base for the dimensional analysis. For every physical phenomenon dependent parameter which can be expressed by a function of 𝑛 − 1 independent parameters, we can express the relationship between the parameters to form 𝑞1 = 𝑓 (𝑞2 , 𝑞3 , . . . , 𝑞𝑛 )
(4)
which is dependent parameters 𝑞1 and 𝑞2 , 𝑞3 , . . . , 𝑞𝑛 is the 𝑛 − 1 independent parameters. In mathematics the above functional relationship can be expressed by an equivalent function 𝑔 (𝑞1 , 𝑞2 , 𝑞3 , . . . , 𝑞𝑛 ) = 0,
(5)
where 𝑔 is an unspecified function, different from 𝑓. Buckingham Pi Theorem states that [25] if there are 𝑛 parameters in the function 𝑔 (𝑞1 , 𝑞2 , 𝑞3 , . . . , 𝑞𝑛 ) = 0
(6)
L
t
w
Figure 1: Plate’s dimensions.
then 𝑛 parameters can be grouped into different 𝑛 − 𝑚 dimensionless ratio, or Π parameters, which can be expressed in the form of the function 𝐺 (Π1 , Π2 , . . . , Π𝑛−𝑚 ) = 0
(7)
Π1 = 𝐺1 (Π2 , Π3 , . . . , Π𝑛−𝑚 ) .
(8)
or
Theorem does not predict the form of functional 𝐺s or 𝐺1 . The form of the functional relationship between Π dimensionless independent parameters must be determined experimentally. 2.4. Π Group for Flutter Similitude Thin-Flat Plate. In this experimental study, the dependent variable is the flutter speed 𝑉𝑓 . Measurements were performed in SI units; thus, 𝑉𝑓 unit is m/s. Variable definitions for the plate’s dimensions can be referred to Figure 1. Independent parameters that are expected to affect the value of 𝑉𝑓 are 𝐿 = plate length (m), 𝑡 = plate thickness, 𝑤 = plate width, 𝜇 = fluid viscosity (N⋅s/m2 = kg/(m⋅s)), 𝜌 = fluid mass density (kg/m3 ), 𝜔𝑛 = natural frequency of the thin-flat plate (rad/s). Relationship between the variables studied can be expressed by the symbolic function as follows: 𝑉𝑓 = 𝑓 (𝐿, 𝜇, 𝜌, 𝜔𝑛 ) .
(9)
Based on this function then 𝑛 = 5. Primary dimensional dimension used in this analysis is the mass, length, and time. The selected repeating parameters are 𝐿, 𝜇, 𝜌. So 𝑚 = 3. Analysis results obtained two Πs that are Π1 =
𝜌𝑉𝑓 𝐿 𝜇
,
(10)
𝜌𝜔𝑛 𝐿2 , 𝜇
(11)
Π1 = 𝑓 (Π2 ) .
(12)
Π2 =
The formulation of the dimensional analysis on (12) will work for geometrically similar plates. For the cases of thin-flat
4
Advances in Acoustics and Vibration the inertia forces of both fluid and structure as well as the structural elastic forces and fluid viscous forces. Hence, Π2 represents the fluid-structural interaction of the system. Since the experiments allow the variation in the thickness and aspect ratios free from the requirement of structural similarity, the thickness factor Π3 and aspect ratio Π4 have to be included in the empirical equation (18). Thin-flat plate
Figure 2: Experimental setup (top view).
plates, the thicknesses of the plates are relatively much smaller than the other geometric parameters and the variations in the thickness will not affect the geometric similarity of the flow significantly. Based on this reasoning—also approved by the experimental data—it is reasonable to do similitude analysis of the plates with various thicknesses but having the same aspect ratios. Allowing the variations in the plates’ thickness requires the thickness (𝑡) to be included in the dimensional analysis. An extra dimensionless number Π3 is introduced to the analysis with the addition of thickness (𝑡) to the dimensional analysis with the value: Π3 =
𝑡 . 𝐿
(13)
Hence, the experiment was used to obtain the relationship of Π1 as a function of Π2 and Π3 . Π1 = 𝑓 (Π2 , Π3 )
(14)
or 𝜌𝑉𝑓 𝐿 𝜇
= 𝑓(
𝜌𝜔𝑛 𝐿2 𝑡 , ). 𝜇 𝐿
(15)
Consider the control volume of the fluid-structure interaction as shown in Figure 2. It is shown that the system is geometrically congruent from the top view projection. Then, it is possible to include the plates with different aspect ratio to analysis by considering the width to dimensional analysis. Inclusion of all plates with different aspect ratio to the analysis then introduces a fourth dimensionless number: Π4 =
𝑤 , 𝐿
(16)
Π1 = 𝑓 (Π2 , Π3 , Π4 ) , 𝜌𝑉𝑓 𝐿 𝜇
= 𝑓(
𝜌𝜔𝑛 𝐿2 𝑡 𝑤 , , ). 𝜇 𝐿 𝐿
(17) (18)
The form of first dimensionless number Π1 can be viewed as a form of comparison between inertial forces to the viscous forces of the fluid. It is a kind of Reynolds number. Since it is calculated during the flutter speed, it can be called flutter Reynolds number. Dimensionless number Π2 contains
2.5. Structural Analysis. The experiment shows the flutter of the plates in this free leading edge configuration occurring in their first natural frequencies. The calculation of the second dimensionless number Π2 requires the value of the plate’s natural frequency. The mode shapes and the natural frequencies of the plates can be approximated using Euler-Bernoulli beam model as in (19). Using the beam approximation for a plate, the displacement of the plate is restricted to the transverse direction 𝑊(𝑥, 𝑡) with its value as a function of the distance 𝑥 from the end of the beam and time 𝑡: 𝜕4 𝑊 (𝑥, 𝑡) 𝜕2 𝑊 (𝑥, 𝑡) + 𝑐2 =0 2 𝜕𝑡 𝜕𝑥4
(19)
with 𝑐=√
𝐸𝐼 . 𝜌𝑠 𝐴
(20)
The natural frequency of a clamped-free beam [26] can be derived from partial differential equation (19) to become the following formula: 𝛽4 =
𝜌𝑠 𝐴𝜔𝑛2 . 𝐸𝐼
(21)
The calculated natural frequency 𝜔𝑛 from (21) is used to calculate the dimensionless number Π2 . In (20) and (21), 𝐸 is plate’s Young’s modulus of elasticity; 𝜌𝑠 is plate’s mass density; 𝐴 is plate’s cross-sectional area; 𝐼 is second moment of plate’s cross-sectional area. The value of constant 𝛽 depends on the boundary conditions and the length of the beam. For a cantilevered beam, the value of 𝛽𝐿 is 1.8751 for the first natural frequency.
3. Experimental Setup The purpose of the experiment was to determine the function 𝑓 as in (18) that describes the relationship of the three dimensionless numbers. Therefore, the test data should be taken with a plate that has a variety of different length and different natural frequencies. Form of the function 𝑓 will be obtained through multivariable nonlinear regression analysis. All plates tested were copper plates with Young’s modulus of elasticity of 110 GPa and mass density of 8960 kg/m3 . Experimental setup can be seen in Figure 2. The flutter speed of every single thin-flat plate was measured one by one. The plate was placed on the wind tunnel that has maximum speed of 40 m/s. Each plate was positioned in vertical direction in the width direction. The trailing edge of the plate was clamped and the leading edge was set free.
Advances in Acoustics and Vibration
5
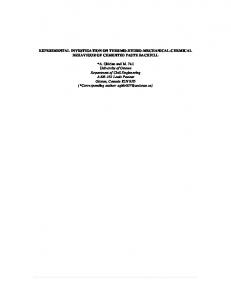
Figure 3: Snapshot of flutter mode shape taken by high speed camera (top view).
40
Flutter speed (m/s)
35 30 25 20 15 10 5 0
0
20
40
60 80 Length (mm)
100
120
Aspect ratio 1 : 6 Aspect ratio 1 : 5 Aspect ratio 1 : 3
Figure 4: Flutter speed for various plates’ dimensions.
Air was blown by a blower into the test section. Air velocity in the wind tunnel was set by regulating the air intake into the blower. The flow velocity was measured using a pitot tube. For each plate, the testing is done by varying the air velocity from zero to flutter speed. The image of the plate motion was captured by high speed camera that was set on 210 frame-per-second speed as shown in Figure 3. The flutter speed determined from that image is the air speed when the plate was stopped at the infinite deflection. The results of measurements were presented in the form of the flutter speed as a function of plates’ dimensions.
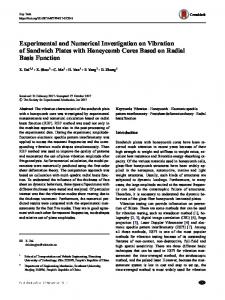
4. Result and Discussion The experimental results are tabulated in two ways: the first way is the tabulation without dimensional analysis as in Table 1 and the second one is the tabulation with dimensional analysis as in Table 2. Table 1 is divided into three subtables according to the plates’ aspect ratio. The list of flutter speed for various dimensions was obtained from the experiment and tabulated on Table 1. The natural frequency of each plate was also calculated using (21). The data from Table 1 is plotted on Figure 4 in the form of flutter speeds verses the lengths of the plates. In this graph, the data are also classified according
to the plates’ aspect ratio: green dots for aspect ratio of 1 : 6; yellow ones for that of 1 : 5; and red for that of 1 : 3. Not all physical trends can be observed in Figure 4. One trend can be observed from Figure 4: that is, a longer plate has a lower flutter speed. The length of the plate relates to the area of the interaction surface between structure and the fluid. A longer plate has a larger area of interaction surface so that it is easier to transfer energy from fluid; thus, the flutter will occur at lower speed. Similitude analysis on flutter speed offers a comprehensive view of all data trends. The values of dimensionless variable are calculated using the data from Table 1 and tabulated on Table 2 using (10), (11), (13), and (16). Table 2 is also divided into three subtables according to the value of Π4 . The calculated dimensionless numbers from Table 2 are plotted on 2-dimensional chart of Π1 versus Π2 as in Figure 5. In Figure 5, the data are also classified into three different aspect ratios: black dots are for Π4 = 1 : 6; blue dots are for Π4 = 1 : 5; and red dots are for Π4 = 1 : 3. Some physical trends can be observed from Figure 5. The dimensionless number Π1 represents flutter speed and Π2 represents the plate’s natural frequency. The relationship of the flutter speed with the plate’s natural frequency can be described using energy scheme. The higher the frequency of a vibrating plate, the higher its vibration energy. A plate with higher natural frequency will need a higher energy from the fluid to reach flutter. Also from Figure 5, a plate with relative higher thickness with respect to its length will tend to have a higher flutter Reynolds number, because thicker plates tend to be stiffer and have a higher value of structural stiffness matrices. By thinking in the static stability scheme, to invoke the instability requires a higher speed with the stiffer plate. The trends of the data are not clearly identified if the data are plotted on 2-dimensional graph as in Figure 5 without the classification of their geometric ratios. This implies that the geometric ratios should be included in the analysis as the correcting factors as in (17). The data were apparently nonlinear and approximating the power trends. Then, a multivariable nonlinear regression analysis is conducted to obtain the form of function 𝑓 in (17). The result of the regression analysis is shown on (22) and (23). 1.86 −1.63 . Π1 = 1.51 × 10⁷ Π0.60 2 Π3 Π4
(22)
6
Advances in Acoustics and Vibration Table 2: Π1 as a function of Π2 , Π3 , and Π4 .
Table 1: Flutter speed for several plates with different dimensions and aspect ratios. (a) Aspect ratio 1 : 6
Plate’s dimension (mm) Thickness Width Length 0.06 10 60 0.08 10 60 0.06 12 72 0.08 12 72 0.06 15 90 0.08 15 90 0.13 15 90 0.06 18 108 0.08 18 108 0.13 18 108
𝜔𝑛 (rad/s) 59.27 79.03 41.16 54.88 26.34 35.12 57.08 18.29 24.39 39.64
Flutter (m/s) 11.71 25.09 6.69 11.71 4.52 9.20 35.12 3.34 4.52 18.40
𝜔𝑛 (rad/s) 85.35 113.80 59.27 79.03 37.93 50.58 26.34 35.12 57.08
Flutter (m/s) 13.58 18.11 9.43 12.58 6.04 8.05 4.19 5.59 9.08
𝜔𝑛 (rad/s) 59.27 79.03 128.42 41.16 54.88 89.18 26.34 35.12 57.08 18.29 24.39 39.64
Flutter (m/s) 9.43 12.58 20.44 6.55 8.73 14.19 4.19 5.59 9.08 2.91 3.88 6.31
(b) Aspect ratio 1 : 5
Plate’s dimension (mm) Thickness Width Length 0.06 10 50 0.08 10 50 0.06 12 60 0.08 12 60 0.06 15 75 0.08 15 75 0.06 18 90 0.08 18 90 0.13 18 90 (c) Aspect ratio 1 : 3
Plate’s dimension (mm) Thickness Width Length 0.06 20 60 0.08 20 60 0.13 20 60 0.06 24 72 0.08 24 72 0.13 24 72 0.06 30 90 0.08 30 90 0.13 30 90 0.06 36 108 0.08 36 108 0.13 36 108
Substituting the values of Π1 as a function of Π2 , Π3 , and Π4 into (23) yields 𝜌𝑉𝑓 𝐿 𝜇
= 1.51 × 10⁷ (
𝜌𝜔𝑛 𝐿2 ) 𝜇
0.60
𝑡 1.86 𝑤 −1.63 ( ) ( ) . (23) 𝐿 𝐿
The illustration of trends body of (22) requires a 4dimensional plot. The 4-dimensional plot is projected as isoaspect-ratio surfaces on 3-dimensional space as shown in
(a) Π4 = 1 : 6
Π1 45538.65 97571.71 31219.84 54646.38 26366.53 53666.39 204865.60 23379.88 31639.84 128799.33
Π2 829.80 1106.40 995.76 1327.69 1244.70 1659.61 2696.86 1493.65 1991.53 3236.23
Π3 0.00100 0.00133 0.00083 0.00111 0.00067 0.00089 0.00144 0.00056 0.00074 0.00120
(b) Π4 = 1 : 5
Π1 39291.69 92611.40 27222.08 48696.34 27783.42 51978.02 20279.99 36522.25 129125.67
Π2 691.50 922.00 829.80 1106.40 1037.25 1383.01 1244.70 1659.61 2696.86
Π3 0.00120 0.00160 0.00100 0.00133 0.00080 0.00107 0.00067 0.00089 0.00144
(c) Π4 = 1 : 3
Π1 35143.56 39134.21 47150.03 26672.08 43826.70 47712.47 21086.13 39448.54 43470.18 17892.18 28290.02 40008.12
Π2 829.80 1106.40 1797.91 995.76 1327.69 2157.49 1244.70 1659.61 2696.86 1493.65 1991.53 3236.23
Π3 0.00100 0.00133 0.00217 0.00083 0.00111 0.00181 0.00067 0.00089 0.00144 0.00056 0.00074 0.00120
Figure 6. The iso-aspect-ratio surfaces are the relationship of Π1 as a function of Π2 and Π3 with constant value of Π4 . Equation (23) is 4-dimensional map of the tendency of the flutter speed for various plates’ dimensions. The projection of this map to 3-dimensional space on Figure 6 shows the characteristic of the flutter Reynolds numbers Π1 as a function of flutter fluid structure interaction numbers Π2 , with the geometric ratios as the correcting factors. This map shows that flutter Reynolds number Π1 is very high at the region of high flutter fluid structure interaction number Π2 and thickness-to-length ratios number Π3 . However, it is very sensitive to the change of those two dimensionless numbers at the region. The sensitivity is higher at lower
Advances in Acoustics and Vibration
7
250000.00 L = 90 mm
200000.00 150000.00
L = 180 mm
Π1
L = 90 mm L = 50 mm
100000.00
t = 0.13 mm
L = 60 mm L = 72 mm L = 90 mm
50000.00 0.00 0.00
t = 0.06 mm
500.00
L = 108 mm
t = 0.08 mm
1000.00 1500.00 2000.00 2500.00 3000.00 3500.00 Π2
Aspect ratio 1 : 6 Aspect ratio 1 : 5 Aspect ratio 1 : 3
Π1
Figure 5: Flutter Reynolds number verses flutter fluid interaction number on 2-dimensional plot.
140000 120000 100000 80000 60000 40000 20000 0 0.0001 0.0003
Π4 = 1 : 6 Π4 = 1 : 5 Π4 = 1 : 3
2500 0.0005 0.0007 0.0009 0.0011 500 0.0013 0.0015 Π3
Π2
Figure 6: Iso-aspect-ratio trend surfaces showing flutter Reynolds number as a function of flutter fluid interaction number and thicknessto-length ratio on 3-dimensional plot.
aspect ratio Π4 following the power trends. A lower aspect ratio means the plate is narrow and long (see (16)) so it has smaller interaction surface. The sensitivity of values of flutter Reynold number increases to the change of the values of fluid structure interaction number for the plate with lower aspect ratio. This happens as a result of decreasing contact surface for lower aspect ratio plates. Thus, the change of natural frequencies, which is also identical to the change of flutter fluid interaction number, has more dominant effect on flutter Reynolds number. On the contrary, at higher aspect ratio the contact surface is broader and it has dominant effect. As a result flutter Reynolds number is less sensitive to the change in natural frequency Π2 . The map generated in this research is a very useful tool in optimizing the design of wind harvester given its range of operating wind speed. The map illustrates the flutter speed trends for various plates’ dimensions. A specific plate’s dimension will be optimum for a specific range of wind speed. An experimental setup is often limited to a certain flutter Reynolds number due to the limited speed of the wind tunnel. Numerical investigations should have more freedom to exceed this limitation. The dimensional analysis and similitude method formulated in this paper can be used in
a future research as method of presenting a result numerical investigation to generate a broader map, of course with some minor drawbacks of the numerical method limitations in representing the real case. The similitude analysis presented in this paper is focused on the free leading edge plates in axial flow with application orientation for wind harvesting. However, there are also possibilities of using this method for other applications such as for the flutter speed analysis of airfoil of an aircraft wings or turbine blades.
5. Conclusions Similitude method has been developed to generate an empirical map to predict the flutter speed of a thin-flat plate. The experiment has showed that the trend of flutter speed has been traced in various geometric parameters. The relationship between the flutter speeds of thin flat-plates in a variety of sizes that are geometrically congruent and the parameters that affect them such the plates’ width, thickness, length, fluid density, fluid viscosity, and their natural frequencies has been described.
8 This research also has found an empirical relationship between the flutter Reynolds number and the fluid-structure interaction number with the geometric ratios as correcting factors. Departing from the testing of thin-flat plate, this study provides a formulation in testing the similitude theory for a future study on flutter analysis of an airfoil that is used in the aircraft or turbomachinery industries. In addition, flutter similitude method can also be used to test the possibility of a detrimental effect of flutter on narrow and long bridges.
Conflicts of Interest The authors declare that there are no conflicts of interest regarding the publication of this paper.
References [1] S. Chad Gibbs, I. Wang, and E. Dowell, “Theory and experiment for flutter of a rectangular plate with a fixed leading edge in three-dimensional axial flow,” Journal of Fluids and Structures, vol. 34, pp. 68–83, 2012. [2] D. M. Tang, H. Yamamoto, and E. H. Dowell, “Flutter and limit cycle oscillations of two-dimensional panels in threedimensional axial flow,” Journal of Fluids and Structures, vol. 17, no. 2, pp. 225–242, 2003. [3] L. Tang and M. P. Pa¨ıdoussis, “The coupled dynamics of two cantilevered flexible plates in axial flow,” Journal of Sound and Vibration, vol. 323, no. 3–5, pp. 790–801, 2009. [4] D. Tang and E. H. Dowell, “Limit cycle oscillations of twodimensional panels in low subsonic flow,” International Journal of Non-Linear Mechanics, vol. 37, no. 7, pp. 1199–1209, 2002. [5] R. M. Howell, A. D. Lucey, P. W. Carpenter, and M. W. Pitman, “Interaction between a cantilevered-free flexible plate and ideal flow,” Journal of Fluids and Structures, vol. 25, no. 3, pp. 544–566, 2009. [6] W. Zhao, M. P. Pa¨ıdoussis, L. Tang, M. Liu, and J. Jiang, “Theoretical and experimental investigations of the dynamics of cantilevered flexible plates subjected to axial flow,” Journal of Sound and Vibration, vol. 331, no. 3, pp. 575–587, 2012. [7] C. Eloy, R. Lagrange, C. Souilliez, and L. Schouveiler, “Aeroelastic instability of cantilevered flexible plates in uniform flow,” Journal of Fluid Mechanics, vol. 611, pp. 97–106, 2008. [8] C. Eloy, N. Kofman, and L. Schouveiler, “The origin of hysteresis in the flag instability,” Journal of Fluid Mechanics, vol. 691, pp. 583–593, 2012. [9] O. Doar´e and S. Michelin, “Piezoelectric coupling in energyharvesting fluttering flexible plates: linear stability analysis and conversion efficiency,” Journal of Fluids and Structures, vol. 27, no. 8, pp. 1357–1375, 2011. [10] K. Makihara and S. Shimose, “Supersonic flutter utilization for effective energy-harvesting based on piezoelectric switching control,” Smart Materials Research, vol. 2012, Article ID 181645, 10 pages, 2012. [11] J. A. Dunnmon, S. C. Stanton, B. P. Mann, and E. H. Dowell, “Power extraction from aeroelastic limit cycle oscillations,” Journal of Fluids and Structures, vol. 27, no. 8, pp. 1182–1198, 2011. [12] J. J. Allen and A. J. Smits, “Energy harvesting eel,” Journal of Fluids and Structures, vol. 15, no. 3-4, pp. 629–640, 2001.
Advances in Acoustics and Vibration [13] A. C. Fernandes and S. Mirzaeisefat, “Flow induced fluttering of a hinged vertical flat plate,” Ocean Engineering, vol. 95, pp. 134–142, 2015. [14] A. G. Cunha-Filho, A. M. G. de Lima, M. V. Donadon, and L. S. Le˜ao, “Flutter suppression of plates using passive constrained viscoelastic layers,” Mechanical Systems and Signal Processing, vol. 79, pp. 99–111, 2016. [15] M. Peng and H. A. DeSmidt, “Stability analysis of a flutter panel with axial excitations,” Advances in Acoustics and Vibration, vol. 2016, Article ID 7194764, 7 pages, 2016. [16] K. Yaman, “Subsonic flutter of cantilever rectangular PC plate structure,” International Journal of Aerospace Engineering, vol. 2016, Article ID 9212364, 10 pages, 2016. [17] S. Torkamani, H. M. Navazi, A. A. Jafari, and M. Bagheri, “Structural similitude in free vibration of orthogonally stiffened cylindrical shells,” Thin-Walled Structures, vol. 47, no. 11, pp. 1316–1330, 2009. [18] S. De Rosa, F. Franco, X. Li, and T. Polito, “A similitude for structural acoustic enclosures,” Mechanical Systems and Signal Processing, vol. 30, pp. 330–342, 2012. [19] A. A. Yazdi and J. Rezaeepazhand, “Structural similitude for flutter of delaminated composite beam-plates,” Composite Structures, vol. 93, no. 7, pp. 1918–1922, 2011. [20] L. Rayleigh, “On the instability of jets,” Proceedings of the London Mathematical Society, vol. s1-10, no. 1, pp. 4–13, 1878. [21] T. Theodorsen, “General theory of aerodynamic instability and the mechanism of flutter,” NACA Technical Report 469, 1934. [22] T. Theodorsen and L. E. Garrick, “Mechanism of flutter: a theoretical and experimental investigation of the flutter problem,” NACA Technical Report 685, 1940. [23] T. Theodorsen and L. E. Garrick, “Nonstationary flow about a-wing-aeleron-tab combination including aerodynamic balance,” NACA Technical Report 736, 1941. [24] C. H. Wolowicz, J. S. Bowman Jr., and W. P. Gilbert, “Similitude requirement and scaling relationships as applied to model testing,” NASA Technical Paper, 1979. [25] R. W. Fox and A. T. McDonald, Introduction to Fluid Mechanics, John Wiley & Son, 1994. [26] D. J. Inman, Engineering Vibration, Prentice-Hall, Upper Saddle River, NJ, USA, 1994.
International Journal of
Rotating Machinery
Engineering Journal of
Hindawi Publishing Corporation http://www.hindawi.com
Volume 2014
The Scientific World Journal Hindawi Publishing Corporation http://www.hindawi.com
Volume 2014
International Journal of
Distributed Sensor Networks
Journal of
Sensors Hindawi Publishing Corporation http://www.hindawi.com
Volume 2014
Hindawi Publishing Corporation http://www.hindawi.com
Volume 2014
Hindawi Publishing Corporation http://www.hindawi.com
Volume 2014
Journal of
Control Science and Engineering
Advances in
Civil Engineering Hindawi Publishing Corporation http://www.hindawi.com
Hindawi Publishing Corporation http://www.hindawi.com
Volume 2014
Volume 2014
Submit your manuscripts at https://www.hindawi.com Journal of
Journal of
Electrical and Computer Engineering
Robotics Hindawi Publishing Corporation http://www.hindawi.com
Hindawi Publishing Corporation http://www.hindawi.com
Volume 2014
Volume 2014
VLSI Design Advances in OptoElectronics
International Journal of
Navigation and Observation Hindawi Publishing Corporation http://www.hindawi.com
Volume 2014
Hindawi Publishing Corporation http://www.hindawi.com
Hindawi Publishing Corporation http://www.hindawi.com
Chemical Engineering Hindawi Publishing Corporation http://www.hindawi.com
Volume 2014
Volume 2014
Active and Passive Electronic Components
Antennas and Propagation Hindawi Publishing Corporation http://www.hindawi.com
Aerospace Engineering
Hindawi Publishing Corporation http://www.hindawi.com
Volume 2014
Hindawi Publishing Corporation http://www.hindawi.com
Volume 2014
Volume 2014
International Journal of
International Journal of
International Journal of
Modelling & Simulation in Engineering
Volume 2014
Hindawi Publishing Corporation http://www.hindawi.com
Volume 2014
Shock and Vibration Hindawi Publishing Corporation http://www.hindawi.com
Volume 2014
Advances in
Acoustics and Vibration Hindawi Publishing Corporation http://www.hindawi.com
Volume 2014